JVM Tuning Using jcmd
Join the DZone community and get the full member experience.
Join For FreeIt's quite often that a Java application comes across multiple performance issues. Mostly, performance issues are due to inefficient JVM tuning. We have a number of tools that come packaged with JDK/JRE and some available commercially. For a developer, it's good to have knowledge of these JVM tuning helping tools to create applications with optimum performance.
Obviously, having knowledge of all tools is best, but there is one tool provided with Java jre itself (from Java7 onwards), which can provide important information regarding a Java application. I am talking about jcmd, which is quite simple to use and can provide a wide variety of information.
What Is jcmd?
As per the manual, jcmd is a utility which sends diagnostic command requests to a running Java Virtual Machine i.e. JVM.
This utility gets various runtime information from a JVM. And, thing to note is, it must be used on the same machine on which JVM is running.
How to Use jcmd
To explain the usage of this tool, let’s have a sample java application running on your machine.
Run a Web Application
I have created a simple web application (JvmtuningApplication) with a simple controller to return a String message.

Run the application with some VM arguments:
-Xss256k -Xms512m -Xmx512m -XX:MaxMetaspaceSize=256m
Get pid
Each process has an associated process id known as pid. To get the associated pid for our application, one can use jcmd itself, which will list all applicable java processes.

In this case, the pid for our application is 2171.
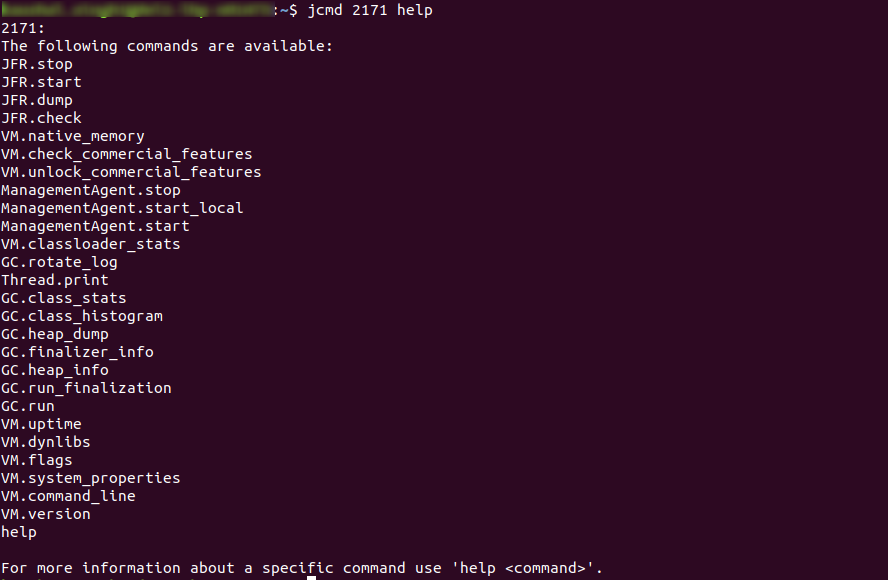
Get List of Possible jcmd Usage
Here, you can see the number of available options with the jcmd command.
jcmd Commands
Now, let’s go over some useful options to get details about our running JVM.
VM.version
This is to get JVM basic details

- VM.flags
This will print all VM arguments used by our application, either given by us or taken default by jvm. Various defaults VM arguments can be noticed here.

Other commands, like VM.system_properties, VM.command_line, VM.uptime, VM.dynlibs also provide other basic and useful details about various other properties used.
Thread.print
This command is to get the thread dump i.e. it will print the stack trace of all threads currently running. Following is the way to use it, which can give long output depending on the number of threads running.

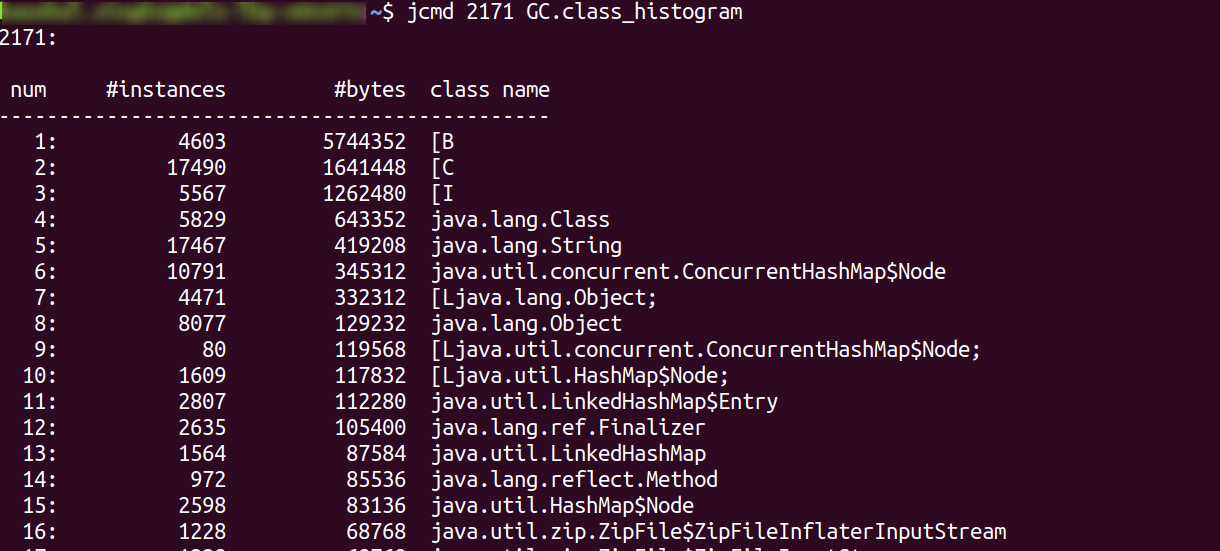
- GC.class_histogram
This command will provide important information regarding heap usage and it lists all the classes (either external or application specific) with a number of instances and their heap usage sorted by heap usage. As this list is very long, one can look for their known classes using grep command to verify details or can route the output of this command to a file output.

Grep Usage
GC.heap_dump
If you want to get the jvm heap dump instantly, then this is the command to go for. Following is the command usage, where jvmTuningHeapDum is the file name.
Notice, it’s better to give full file path rather than file name only. Else, it will create a file at some random location, although one can find that file in the system using “ find -name jvmTuningHeapDum ” or any other such tool.

JFR command options
If one want to analyze performance issues with their application then JFR, i.e. Java Flight Recorder, is a great utility to provide information. Although JFR is a commercial feature, one can use it on their local machines for free.
jcmd command can provide relevant JFR files for analysis on the fly. By default, JFR features are disabled and to enable those feature one can opt following way:


After enabling JFR features, start JFR recording. In my case, I have asked for a recording of 30 sec after a delay of 10sec. These can be configured as per usage. One can check the status of recording using the JFR.check command also.

Recorded JFR files can be used in other utilities like JMC to analyse further.
VM.native_memory (Native Memory Tracking)
This is one of the best commands that can provide a lot of useful details about heap and non-heap memory. This can be used to tune memory usage and detect any memory leak.
As we know, JVM memory usage depends on many memory areas, broadly classified as heap and non-heap memory. To get the details of complete JVM memory usage use this utility. This can be useful in defining your application container size, if you are creating distributed applications, and can save cost if tuned correctly.
To use this feature I have to restart my application with additional argument i.e. -XX:NativeMemoryTracking=summary or -XX:NativeMemoryTracking=detail.
Check for new PID and new VM flag added:


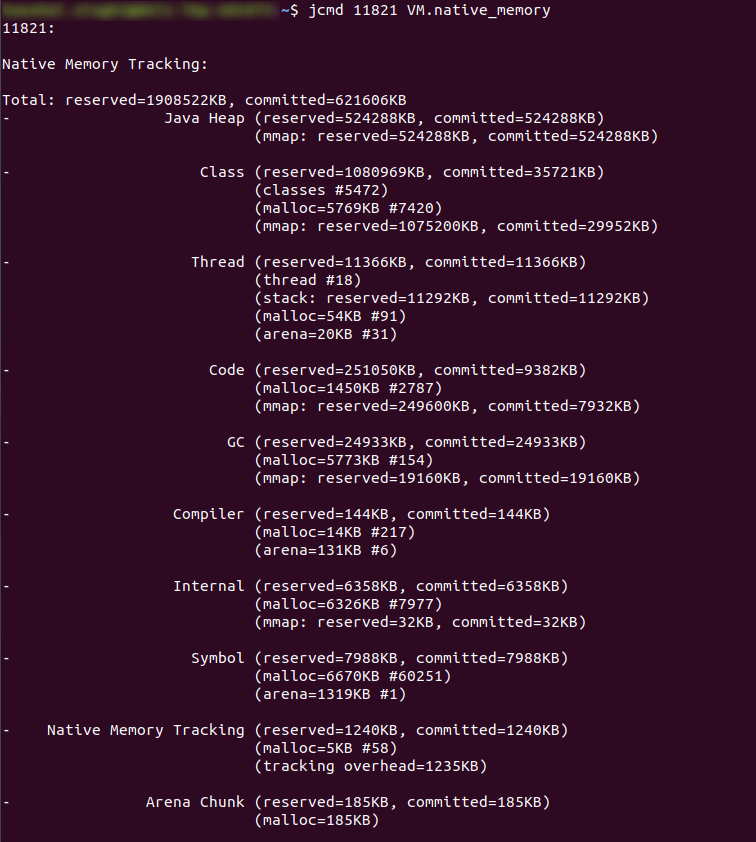
Running VM.native_memory command will give details something like below:

Apart from Java Heap memory, Thread specifies the memory threads are using, also Class specifies the memory captured to store class metadata, Code gives the memory used to store JIT generated code, Compiler itself has some space usage, similarly GC occupies space. All these come under native memory usage.
Total reserved can give rough estimation about memory required for your application, but various VM arguments can still control things, as mostly are default memory usage here because we haven’t configured all flags. All memories can be tuned after requirement analysis.
Refer, all VM arguments here.
Notice, that all committed usage shows the actual used memory and reserved shows what jvm expects usage over time. E.g.
xxxxxxxxxx
Java Heap (reserved=524288KB, committed=524288KB)
(mmap: reserved=524288KB, committed=524288KB)
We specified heap memory i.e. Xms = 512m which is equivalent to 524288KB, hence committed memory is the same as Xms. Similarly, Xmx is mapped to reserved memory.
This command gives the snapshot of current memory usage. To analyse the memory leak, one should baseline the memory stats after starting application using command

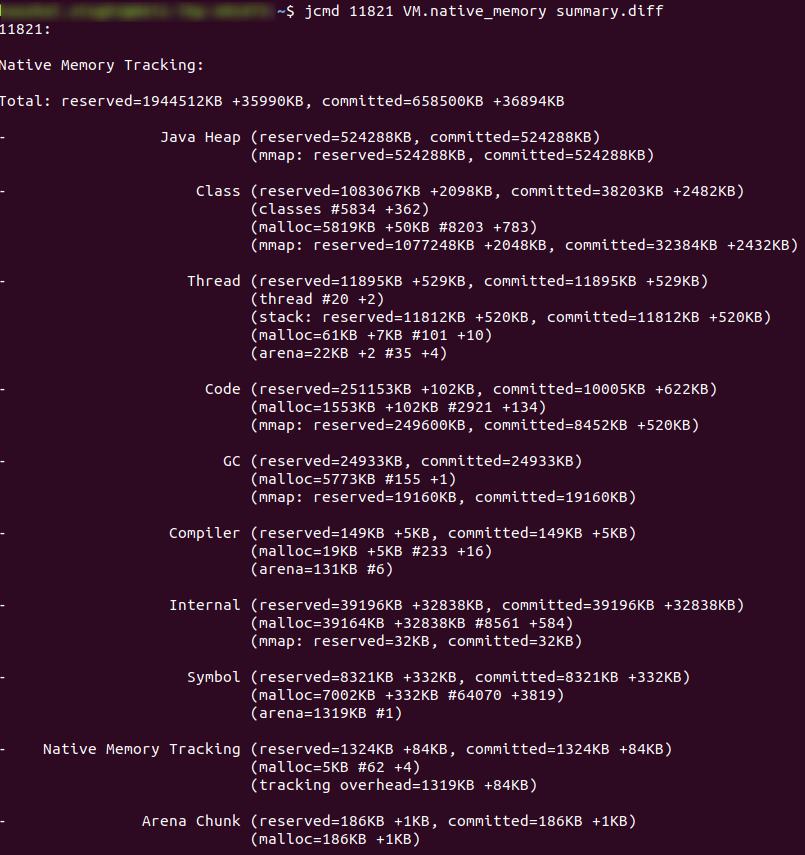
Then diff can be used to observe the change, where exactly memory is being used. Over the time as GC works you will notice an increase and decrease in memory. But if there is only an increase in memory usage, then it could be a memory leak issue. Identify the leak area, like heap, thread, code, class etc. If your application requires more memory, tune corresponding VM arguments accordingly.
If memory leak is in heap, take heap dump (as explained earlier), or if number of threads are increasing, use thread pool. If any of the threads cause OOM, Xss can be tuned.
In the following snap, one can observe an increase in memory over different sections.

Note:
xxxxxxxxxx
Thread (reserved=11895KB +529KB, committed=11895KB +529KB)
(thread #20 +2)
(stack: reserved=11812KB +520KB, committed=11812KB +520KB)
(malloc=61KB +7KB #101 +10)
(arena=22KB +2 #35 +4)
‘stack’ shows the thread stack memory, and that could mismatch what you have configured using Xss while running the application. As some jvm system threads allocate stack memory as per their usage and the user can’t override those using Xss.
We specified thread stack size as Xss=256k, and here we have a total 18+2 = 20 threads. These 2 additional threads are application specific threads to handle request, hence 2*(Xss=256k ) ~ 520k.
Happy Tuning!!
Opinions expressed by DZone contributors are their own.


Comments