Easy and Accurate Performance Testing With JUnit/Maven
Easy and Accurate Performance Testing With JUnit/Maven
Learn how you can utilize JUnit and Maven for performance and load testing in a variety of scenarios, like reusing test code and testing in parallel.
Join the DZone community and get the full member experience.
Join For Free1. Introduction
This article will demonstrate how easily we can do performance testing with the help of JUnit, Zerocode and an IDE(IntelliJ, Eclipse, etc).
We will cover the following aspects.
-
The problem and the solution
-
JUnit + Zerocode-TDD Open-Source framework
-
Usage with examples
-
Reports and failure test logs
You can find the demo performance test project in GitHub.
2. The Problem and The Solution
We can do Performance Testing as easily as we do JUnit for unit testing.
Sometimes, we keep the Performance Testing ticket toward the end of the development sprints, i.e. much nearer to the production release date. Then, the developers or performance testers (sometimes a specialized team) are asked to choose a standalone tool from the market and produce some fancy reports of the performance testing.
That means it is done in isolation from the regular builds and the important aspects of a product or service API are missed or not done properly. This fails to provide any room for improvement or fixing of the potential issues found in the product.
The Solution is to have this aspect of testing in the CI Build Pipeline, if not regularly on every commit/merge, then a nightly build should be good enough.
3. Mocking or Stubbing Boundry APIs
It is very important we mock or stub our boundary APIs which are external to the application under test. Otherwise, we will be unnecessarily generating load on other applications as well as producing the wrong analytics reports.
The clip below shows, how easily you can do external service virtualization via WireMock without writing Java code i.e. by simply put JSON payloads for mock APIs.
We can find this api-mock-maker in Github.

4. How Can We Integrate Performance Testing With the CI Build?
In the traditional approach, we spent too much time in understanding a tool and making the tool work since some are not IDE-friendly or not even Maven/JUnit-based.
At times, pointing our performance testing tool anywhere in the tech stack is not easy or straight forward, for example, pointing to a REST endpoint, DB server, SOAP endpoint, or Kafka topic, or SSL Host via corporate proxy.
This makes our life a bit difficult to isolate the issue. We are not sure then whether, our application APIs are underperforming, and only the downstream systems are underperforming. Let's explain what it means.
For instance, we just tested our GET API's performance, pointing to the URL "/api/v1/loans/LD1001" using a standalone tool and found that the response delay was very high. Then we (development team) tend to blame it on the DB with the reasoning that the OracleDB server is pretty slow while handling parallel loads.
5. How Do You Produce Evidence That Your APIs Are Not Slow?
Now, we wish we had a mechanism or tool to isolate this issue from our application by pointing our performance testing tool directly to the DB, Kafkatopics, etc.
Because (as a developer) we are aware of which SQL queries are fired to the DB to fetch the result.
Or the topic/partition names from which we can directly fetch data bypassing the application API processing layer.
This could prove our point meaningfully as well as produce evidence.
Reusing the Existing JUnit Tests for Load/Stress Generation
Ideally, we need a custom JUnit load runner with reusing our existing JUnit tests (e2e integration tests, feature tests, or component tests, as most of them, use JUnit behind the scenes) to generate load or stress on the target application.
Luckily, we have this ready-made runner available which we will learn in the next section.
The load runner would look like below:
@LoadWith("load_config.properties")
@TestMapping(testClass = AnyTest.class, testMethod = "testXyz")
@RunWith(ZeroCodeLoadRunner.class)
public class LoadTest {
}
Where load_config.properties should hold the below properties:
number.of.threads=80
ramp.up.period.in.seconds=80
loop.count=2
Here, we have 80 users to be ramped up in 80 seconds (each user firing tests in a one-second gap) and this to be run twice (loop=2) for a total of 160 parallel users firing requests each approximately in a one-second gap.
@TestMapping means
@TestMapping(testClass = AnyTest.class, testMethod = "testXyz")Your "testXyz" method of AnyTest above had the required test "assertions".
Once the load running is completed, we should be able to derive statistics like below:
|
Total number of tests fired |
160 |
|
Total number of tests passed |
140 |
|
Total number of tests failed |
20 |
|
The average delay between requests (in sec) |
1 |
|
Average response time delay (in sec) |
5 |
Ideally, more statistics could be drawn on demand, as the LoadRunner produces a CSV/Spreadsheet with the kinds of data below (or more):
|
TestClassName |
TestMethod |
UniqueTestId |
RequestTimeStamp |
ResponseDelay |
ResponseTimeStamp |
Result |
|
YourExistingTest |
aTest |
test-id-001 |
2018-05-09T21:31:38.695 |
165 |
2018-05-09T21:31:38.860 |
PASSED |
|
YourExistingTest |
aTest |
test-id-002 |
2018-05-09T21:31:39.695 |
169 |
2018-05-09T21:31:39.864 |
FAILED |
Of course, these are the basics and you should be able to do all this testing using any given tools.
6. Firing Different Kinds of Requests for Each User Concurrently
-
What if we want to gradually increase or decrease the load on the application under test?
-
What if one of our users wants to fire POST, then GET?
-
What if another user is dynamically changing the payload every time they fire a request?
-
What if another user keeps on firing POST, then GET, then PUT, then GET to verify all CRUD operations are going well? And so on, every scenario here is asserting their corresponding outcome of the test.
Now we definitely need a mechanism to reuse your existing tests, as we might already have test cases doing these in your regular e2e testing (sequentially and independently, but not in parallel).
You might need a JUnit runner like below, which could create a production-like load, with parallel users firing different types of requests and asserting them for each call. Go to the demo repo to see this in action.
@LoadWith("load_generation.properties")
@TestMappings({
        @TestMapping(testClass = GetServiceTest.class, testMethod = "testGet"),
        @TestMapping(testClass = PostServiceTest.class, testMethod = "testPostGet"),
        @TestMapping(testClass = PutServiceTest.class, testMethod = "testPostGetPutGet"),
        @TestMapping(testClass = PostServiceTest.class, testMethod = "testStress")
})
@RunWith(ZeroCodeMultiLoadRunner.class)
public class LoadMultipleGroupAnnotationTest {
}
7. Junit + Zerocode TDD Open Source Testing Library
<dependency>
    <groupId>org.jsmart</groupId>
    <artifactId>zerocode-rest-bdd</artifactId>
    <version>1.3.x</version> <!-- Pick the latest from maven repo -->
    <scope>test</scope>
</dependency>

<dependency>
    <groupId>junit</groupId>
    <artifactId>junit</artifactId>
    <version>4.12</version>
    <scope>test</scope>
</dependency>
Basically, you combine these two libraries, JUnit and Zerocode, to generate load/stress:
-
JUnit (very popular, open-source, and commonly used in the Java community)
-
Zerocode (new and gaining popularity due to easy assertions for BDD/TDD automation)
Recently, our team used the open-source Maven library Zerocode (see the README on GitHub) with JUnit, which made the performance testing an effortless job.
We could think of many scenarios creatively and be ready with load tests pretty quickly. Of course, we kept on adding these tests to our load-regression pack ready for the CI build at the same time.
The advantage was that we are able to reuse the subsets of tests in JMeter too to generate load which was used by the Business(non-Developers). Business users needed a UI-based tool to pick up a certain business scenario and run.
8. Usage With Examples
Browse the sample performance testing repo performance-test project
We can find the working examples here.
9. Reports and Reading Failed Test Logs
When you have the test run statistics generated in a CSV file, you can draw the charts or graphs using the datasets produced by the framework.
This framework generates two kinds of reports (see sample load test reports here):
1) CSV report (in the target folder)
2) Interactive fuzzy search and filter HTML report (in the target folder)
You can trace a failed test by many parameters, but most easily by its uniquestep-correlation-id.
Most importantly, there will be times when tests fail and we need to know the reason for the failure of that particular instance of the request. In the CSV report (as well as HTML), you will find a column correlationId holding a unique ID corresponding to a test step for every run. Just pick this ID and search in the target/zerocode_rest_bdd_logs.log file — you will get the entire details for the matching TEST-STEP-CORRELATION-ID, as below:
2018-06-23 21:55:39,865 [main] INFO org.jsmart.zerocode.core.runner.ZeroCodeMultiStepsScenarioRunnerImpl -
--------- TEST-STEP-CORRELATION-ID: b3ce510c-cafb-4fc5-81dd-17901c7e2393 ---------
*requestTimeStamp:2018-06-23T21:55:39.071
step:get_user_details
url:https://api.github.com:443/users/octocat
method:GET
request:
{ }
--------- TEST-STEP-CORRELATION-ID: b3ce510c-cafb-4fc5-81dd-17901c7e2393 ---------
Response:
{
  "status" : 200,
  "headers" : {
    "Server" : [ [ "GitHub.com" ] ],
    "Status" : [ [ "200 OK" ] ]
  },
  "body" : {
    "login" : "octocat",
    "id" : 583231,
    "updated_at" : "2018-05-23T04:11:18Z"
  }
}
*responseTimeStamp:2018-06-23T21:55:39.749
*Response delay:678.0 milli-secs
---------> Assertion: <----------
{
  "status" : 200,
  "body" : {
    "login" : "octocat-REALLY",
    "id" : 583231,
    "type" : "User"
  }
}
-done-


java.lang.RuntimeException: Assertion failed for :-

[GIVEN-the GitHub REST end point, WHEN-I invoke GET, THEN-I will receive the 200 status with body]
|
|
+---Step --> [get_user_details]

Failures:
---------
Assertion path '$.body.login' with actual value 'octocat' did not match the expected value 'octocat-REALLY'
Throughput results can be drawn as below:
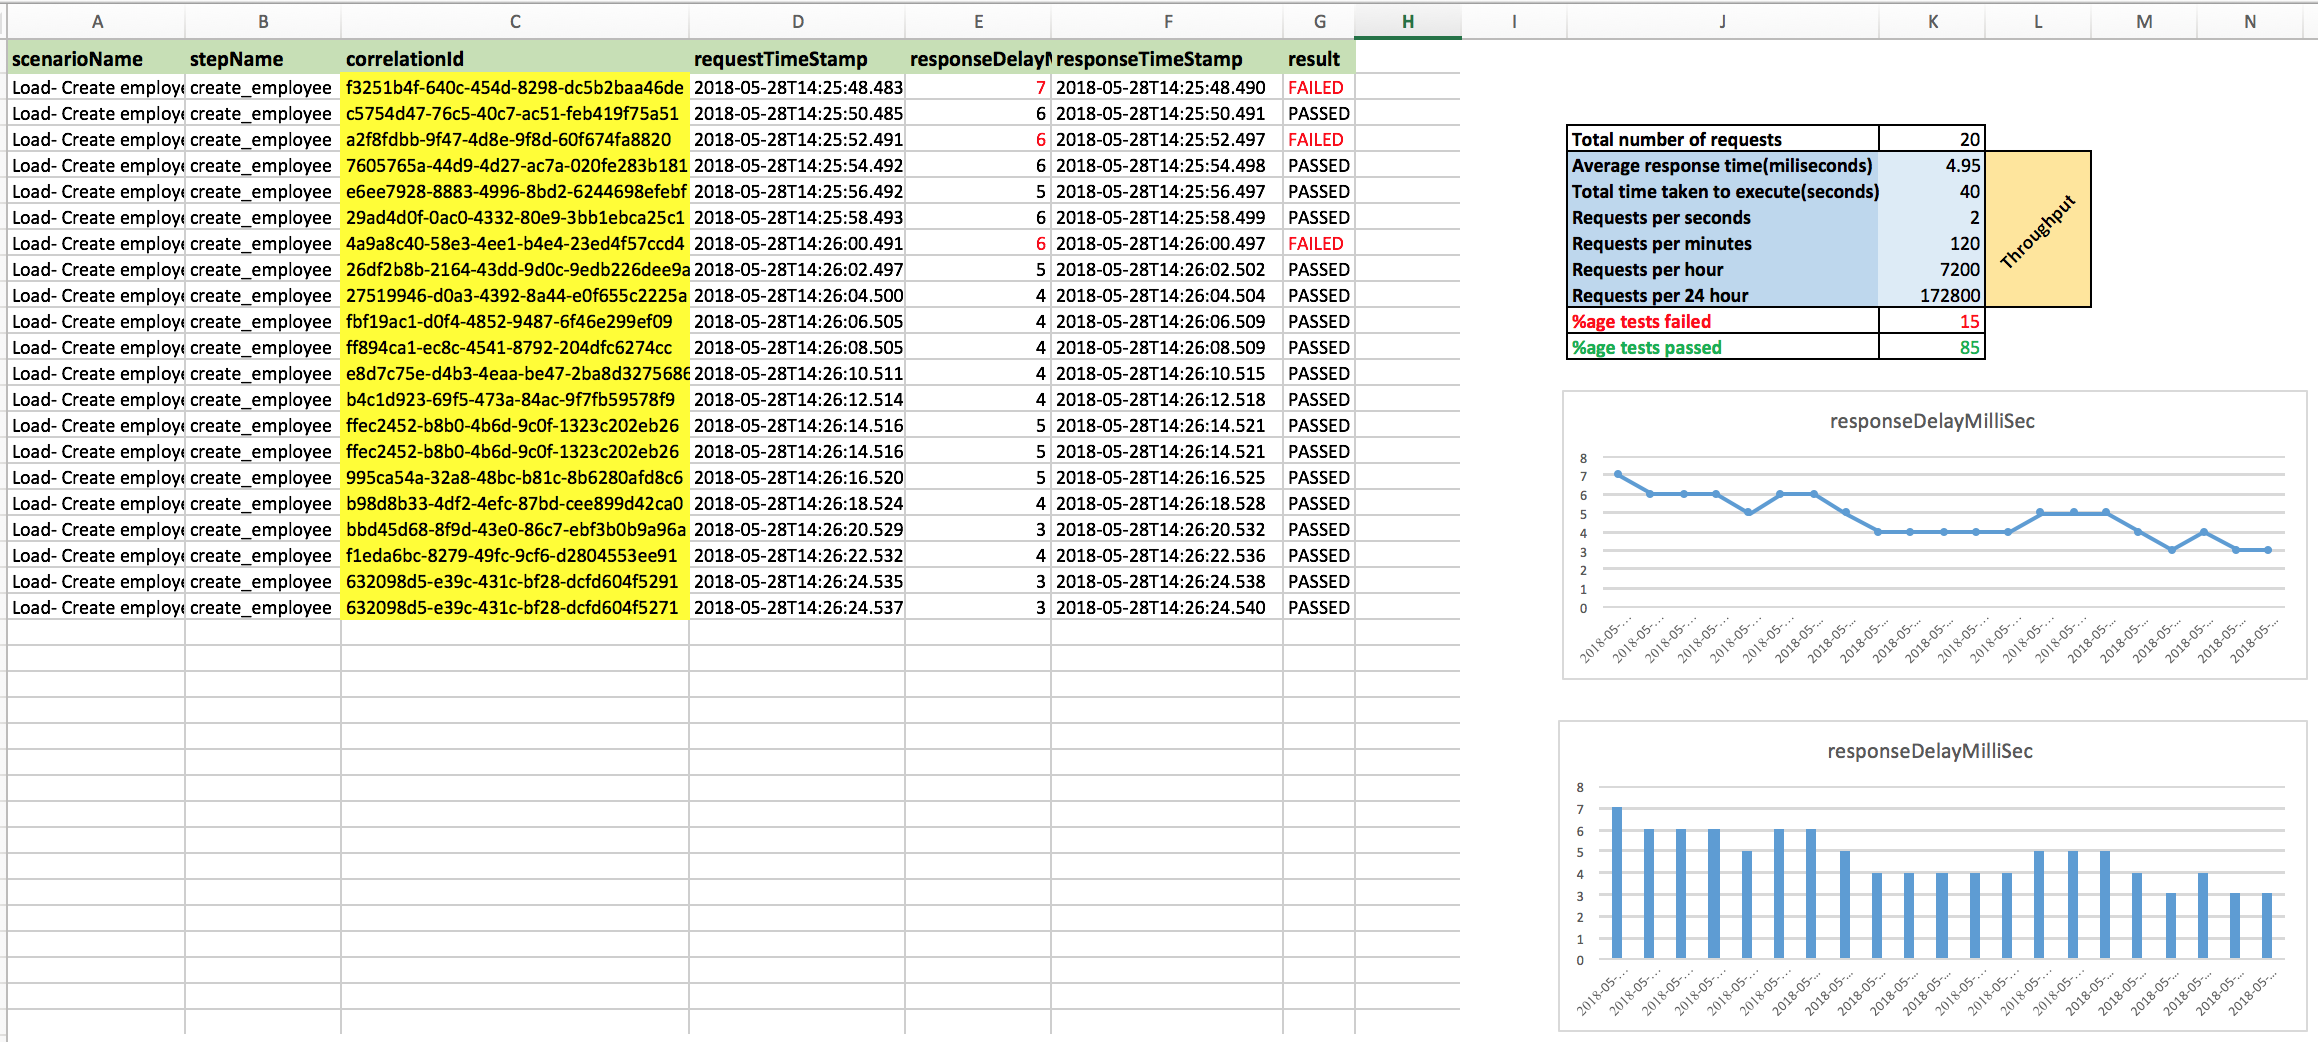
Of course, you can draw line graphs, pie charts, and 3D charts using Excel or any other handy tools.
Good luck and happy testing!
Article originally posted on August 28, 2018.
Opinions expressed by DZone contributors are their own.
{{ parent.title || parent.header.title}}
{{ parent.tldr }}
{{ parent.linkDescription }}
{{ parent.urlSource.name }}