Low-Latency Java: Part 1 — Introduction
What is latency, and why should I worry about it as a developer?
Join the DZone community and get the full member experience.
Join For FreeThis is the first article of a multi-part series on low-latency programming in Java. At the end of this introductory article, you will have grasped the following concepts:
- What is latency, and why should I worry about it as a developer?
- How is latency characterized, and what do percentile numbers mean?
- What factors contribute to latency?
So, without further ado, let's begin.
What Is Latency and Why Is it Important?
Latency is simply defined as the time taken for one operation to happen.
Although operation is a rather broad term, what I am referring to here is any behavior of a software system that is worth measuring and that a single run of that type of operation is observed at some point in time.
For example, in a typical web application, an operation could be submitting a search query from your browser and viewing the results of that query. In a trading application, it could be the automatic dispatching of a Buy or Sell order for a financial instrument to an exchange upon receiving a price tick for it. The lesser the time these operations take, the more they usually tend to benefit the user. Users prefer web applications that do not keep them waiting. You can recall that blazing fast searches were what initially gave Google a winning edge over other search engines prevalent at the time. The faster a trading system reacts to market changes, the higher the probability of a successful trade. Hundreds of trading firms are routinely obsessed with their trading engines having the lowest latency on the street because of the competitive edge they gain from it.
Where the stakes are high enough, lowering latencies can make all the difference between a winning business and a losing one!
How Is Latency Characterized?
Every operation has its own latency. With hundreds of operations, there are hundreds of latency measurements. Hence, we cannot use a single measure like number_of_operations/second, or num_of_seconds/operation to describe latency in a system because that is what can be used to describe a single run of that operation only.
At first impulse, you may think it then makes sense to quantify latency as an average of all the operations of the same kind that were measured. Bad idea!
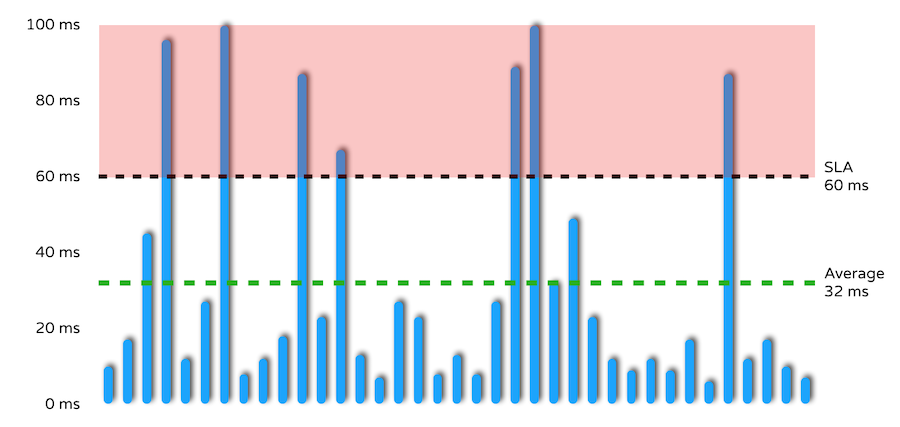
The problem with averages? Consider the latency graph shown below.

Several measurements (seven, in fact) exceed the SLA target of 60 ms, but the average response time happily shows us well within SLA bounds. All the performance outliers lying within the red zone get smoothed over as soon as you start dealing in terms of average response times. Ignoring these outliers is like throwing away that part of the data that matters the most to you as a software engineer — this is where you need to focus to tease out performance-related issues in the system. Worse still, chances are that the underlying problems that these outliers mask will rear their head more often than not in a production system under real conditions.
Another thing to note, a lot of latency measurements in practice would probably end up looking like the graph above, with a few random heavy outliers seen every now and then. Latency never follows a normal, Gaussian, or Poisson distribution; you see more of a multi-modal shape to latency numbers. Actually, that is why it is useless to talk about latency in terms of averages or standard deviations.
Latency is best characterized in percentile terms.
What are percentiles? Consider a population of numbers. The nth percentile (where 0< n< 100) divides this population into two portions so that the lower portion contains n percent of the data and the upper portion contains (100 - n)% of the data. As such, the two portions will always add up to 100 percent of the data.
For example, the 50th percentile is the point where half of the population falls below and the other half falls above it. This percentile is better known as the median.
Let's take a few examples in the context of measuring latency.
When I state the 90th percentile latency is 75 ms, it means that 90 out of 100 operations suffer a delay of at most 75 ms, and the remainder, i.e 100 - 90 = 10, operations suffer a delay of at least 75 ms. Note that my statement doesn't place any upper bound on the maximum latency observed in the system.
Now, if I further add that the 98th percentile latency is 170 ms, it means that 2 out of 100 operations suffer a delay of 170 ms or more.
If I further add that the 99th percentile latency is 313 ms, it implies that 1 out of every 100 operations suffers a substantial delay as compared to the rest.
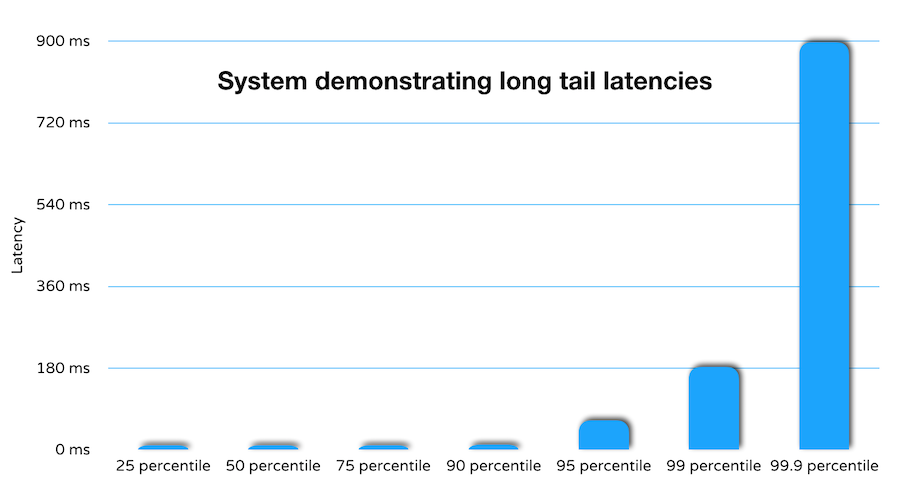
In fact, many systems exhibit such characteristics where you find that latency numbers sometimes grow significantly, even exponentially as you go higher up the percentile ladder.

But why should we worry about long tail latencies? I mean, if only 1 in 100 operations suffers a higher delay, isn't the system performance good enough?
Well, to gain some perspective, imagine a popular website with a 90th, 95th, and 99th percentile latency of 1, 2, and 25 seconds respectively. If any page on this website crosses a million page views per day, it means that 10000 of those page views take more than 25 seconds to load — at which point 10000 users have possibly stifled a yawn, closed their browser, and moved onto other things, or even worse, are now actively relating their dismal user experience on this website to friends and family. An online business can ill-afford tail latencies of such a high order.
What Contributes to Latency?
The short answer is: everything!
Latency "hiccups" that lead to its characteristic shape, with random outliers and everything, can be attributed to a number of things like:
- Hardware Interrupts
- Network/IO delays
- Hypervisor Pauses
- OS activities like rebuilding internal structures, flushing buffers etc
- Context Switches
- Garbage Collection Pauses
These are events that are generally random and don't resemble normal distributions themselves
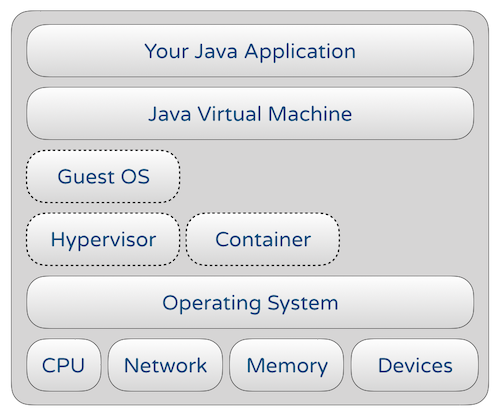
Also, consider how your running Java program looks like in terms of a high-level schematic:
 (The hypervisor/containers are optional layers on bare-metal hardware but very relevant in a virtualised/cloud environment)
Latency reduction is intimately tied to considerations, like:
- The CPU/Cache/Memory architecture
- JVM architecture and design
- Application design — concurrency, data structures and algorithms, and caching
- Networking protocols, etc.
Every layer in the diagram above is as complex as it gets and adds considerably to the surface area of the knowledge and expertise required to optimize and extract the maximum performance possible — that, too, within the ubiquitous constraints of reasonable cost and time.
But then, that is what makes performance engineering so interesting!
Our challenge lies in engineering applications where latency always stays reasonably low for every single execution of the required operation
Well, this is all much easier said than done!
Thanks for reading!
Please join me in part two of this series; we will cover how to go about measuring latency, touching on useful Java tools like JMH, HDRHistogram, and their usage, with a brief on subtle issues, like co-ordinated omission, and pitfalls with using code profiling/micro-benchmarking tools
Opinions expressed by DZone contributors are their own.

