Request Tracing Using Nginx and Spring Boot
Learn the simplest method for tracing dynamic content requests in an Nginx and Spring Boot-based application.
Join the DZone community and get the full member experience.
Join For FreeMost web applications are hosted behind a load balancer or web-server such as Nginx/HTTPD, which intercepts all the requests and directs dynamic content requests to the application server, such as Tomcat. Correlating requests traversing from the front-end server to the backend servers are general requirements. In this post, we will discuss tracing the request in the simplest way in an Nginx and Spring Boot-based application without using an external heavyweight library like Slueth.
Assign an Identifier to Each Request Coming Into Nginx
Nginx keeps request identifier for HTTP request in a variable $request_id, which is a 32 haxadecimal characters string. $request_idcan be passed to further downstream with request headers. Following configuration passes the $request_id as X-Request-ID HTTP request header to the application server.
server { listen 80; location / { proxy_pass http://apiserver; proxy_set_header X-Request-ID $request_id; }}Log the Request Identifier in Front-end Access Logs
Include the $request_id in the log format of the Nginx configuration file as follows.
log_format req_id_log '$remote_addr - $remote_user [$time_local] $request_id "$request" ' '$status $body_bytes_sent "$http_referer" "$http_user_agent" ' '"$http_x_forwarded_for"';access_log /dev/stdout req_id_log;It will print the access logs in the following format:
172.13.0.1 [28Sep2018:05:28:26 0000] 7f75b81cec7ae4a1d70411fefe5a6ace "GET /v0/status HTTP/1.1" 200 184 "http://localhost:80/" "Mozilla/5.0 (Macintosh; Intel Mac OS X 10_13_6) AppleWebKit/537.36 (KHTML, like Gecko) Chrome/69.0.3497.100 Safari/537.36" "-"Intercept the HTTP Request on the Application Server
Every HTTP request coming into the application server will now have the header X-Request-ID, which can be intercepted either in the interceptor or servlet filter. From there, it can be logged along with every log we print in the logs, as follows.
Define a Request Filter Using MDC
Define the following request filter, which reads the request header and puts it in the MDC (read about MDC here). It basically keeps the values in the thread local.
...public class RegLogger implements Filter { public void doFilter(ServletRequest servletRequest, ServletResponse servletResponse, FilterChain filterChain) throws IOException, ServletException { try { MDC.put("X-Request-ID", ((HttpServletRequest)servletRequest).getHeader("X-Request-ID")); filterChain.doFilter(servletRequest, servletResponse); } finally { MDC.clear(); } } public void init(FilterConfig filterConfig) throws ServletException {} public void destroy() {}}Configure the Logger to Print the Request id
I have used logback, which can read MDC variables in the %X{variable_name} pattern. Update the logback pattern as follows:
<configuration> <appender name="STDOUT" class="ch.qos.logback.core.ConsoleAppender"> <encoder class="ch.qos.logback.classic.encoder.PatternLayoutEncoder"> <Pattern>%d{HH:mm:ss.SSS} [%thread] %X{X-Request-ID} %-5level %logger{36} - %msg%n</Pattern> </encoder> </appender> <root level="info"> <appender-ref ref="STDOUT" /> </root></configuration>It will print the following logs:
17:28:26.011 [httpnio8090exec7] 7f75b81cec7ae4a1d70411fefe5a6ace INFO c.d.e.controllers.StatusController received requestThis way, you can see the request id in all the logs from the origin to the end. We can configure ELK to aggregate the logs and trace them in a nice user interface to help with troubleshooting.
Get the Generated Request id Back in the Response
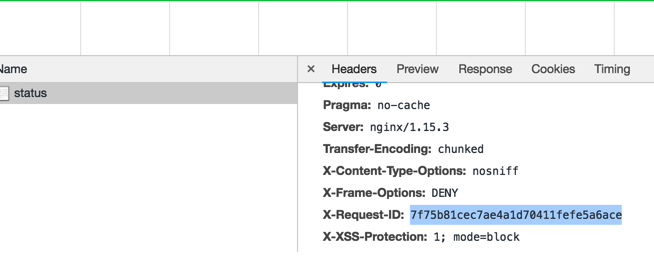
Nginx can also add the request id in the response header with the following configuration:
server { listen 80; add_header X-Request-ID $request_id; # add to response header ....As you see here:
Conclusion
We have explained a simple way to assign a unique identifier to each request, then trace the request end-to-end. You can get more details here.
Opinions expressed by DZone contributors are their own.