Building an Agentic Incident Resolution System for Developers
This is how you can build an automated agentic incident resolution system using Port as a context layer and Datadog for incident tracing.
Join the DZone community and get the full member experience.
Join For FreeAgentic engineering gets really interesting when it moves beyond dashboards and alerts and starts taking action. One of the clearest places to apply it is incident response. Instead of waking someone up at 2:00 a.m. just to answer basic questions, I can build a system that understands what broke, who owns it, what changed recently, what the dependencies are, and whether the problem can be healed automatically.
That is exactly what I set up with Port as the context layer and Datadog as the monitoring and tracing layer. Datadog tells me something is wrong. Port tells me what that thing means inside the organization. Once those two are wired together with automation, I get a practical example of agentic engineering in action: incidents can be investigated, enriched with context, auto-resolved when possible, or escalated to the right team with the right details.
The Problem That Normal Alerting Does Not Solve
Traditional monitoring is good at detection. It is not always good at decision-making. An alert can tell me that the error rate crossed 5 percent, latency spiked, or a service is unhealthy. But when an incident happens, that is rarely the only thing I need to know.
I still need answers to questions like these:
- Who owns this service?
- Was there a recent deployment?
- Is this service tier one or lower priority?
- What other systems depend on it?
- Is there a runbook for this exact issue?
- Should I retry, roll back, restart, or escalate?
That gap is where a lot of incident time gets wasted. The first several minutes are often spent gathering organizational context instead of resolving the issue. In many teams, that delay is the difference between a minor blip and a major operational headache.
This is why agentic engineering matters. The goal is not only to detect events but to make systems context-aware enough to respond intelligently. In this setup, Datadog is excellent at telemetry, monitoring, tracing, and alerting. Port fills in the missing layer: ownership, dependencies, runbooks, service criticality, and engineering context.
Why Port Is the Missing Context Layer
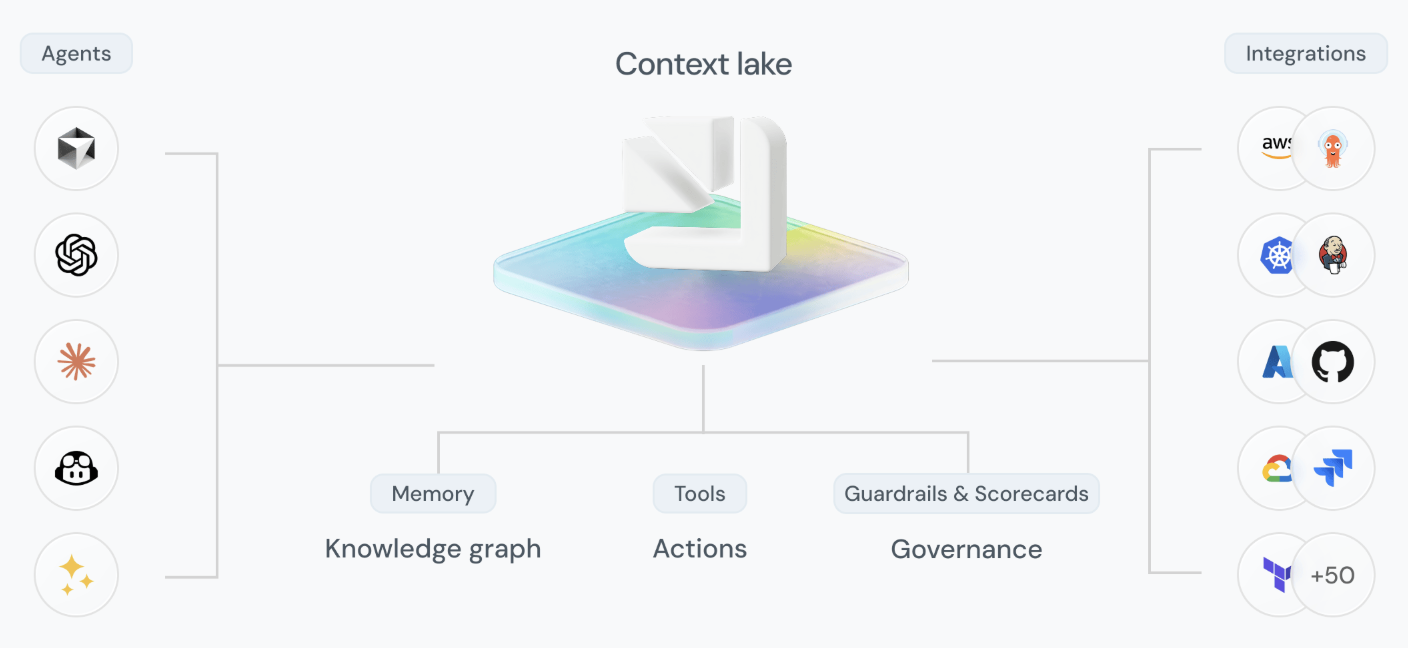
Think of Datadog as the system that knows what is happening technically, and Port as the system that knows what it means operationally. Datadog can tell me a service has a 15 percent error rate or that latency is high. Port can tell me that the affected service belongs to the platform team, is business critical, depends on another backend, and has a known runbook for recovery.
That combination is what turns monitoring into agentic engineering. Without context, automation is shallow. It can only react to thresholds. With context, automation can choose the right path.
In my setup, Port stores and exposes things like:
- Service ownership
- Deployment history
- Dependencies
- Criticality or tier
- Runbooks
- Tags and metadata
Once that data is available to workflows, the response system can behave more like an on-call engineer with memory instead of a blind script reacting to numbers.
How I Built the Self-Healing Incident Flow
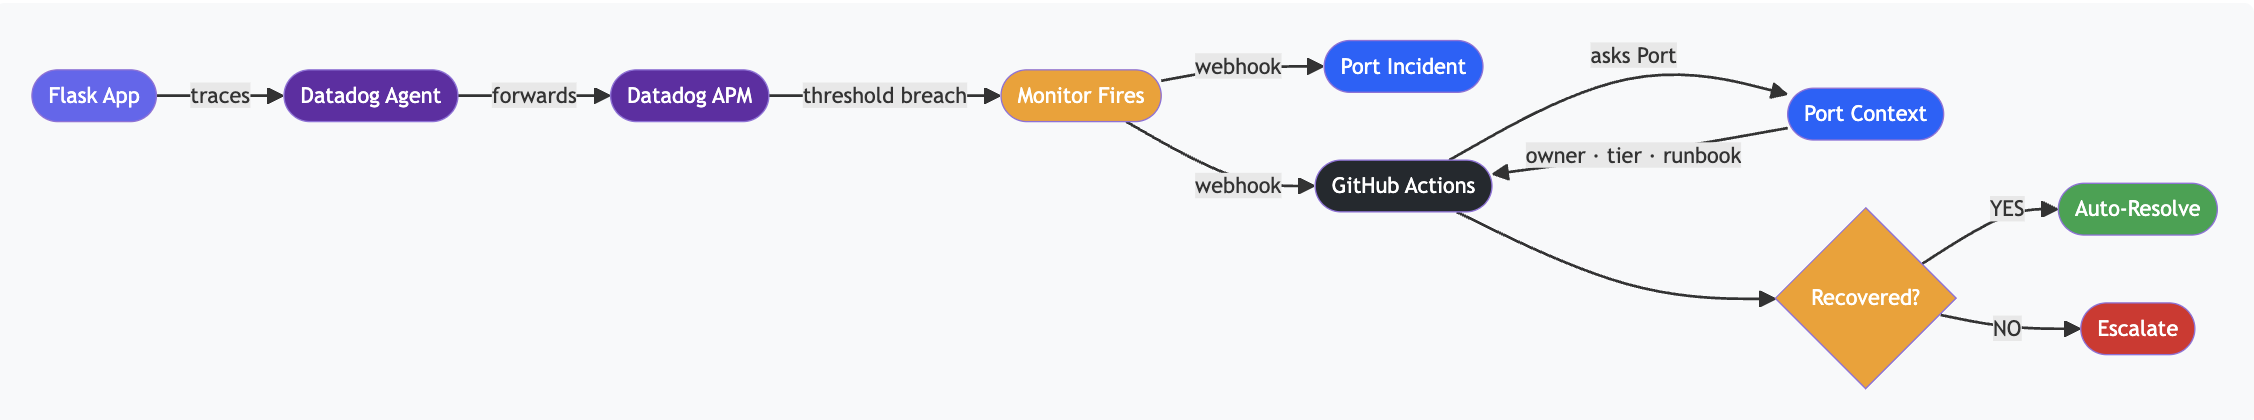
The architecture is simple enough to understand, but powerful enough to be useful. I used a small Flask application as the demo app. Then I connected Datadog Agent so it could collect telemetry from the app and forward traces and incident signals to Datadog APM. From there, I created monitors for specific services and error conditions.
When those monitors breach a threshold, the flow kicks off through automation. I wired that into Port and also used GitHub Actions as part of the response loop. So the chain looks like this:
- A service emits telemetry.
- Datadog detects abnormal behavior.
- A monitor fires when the threshold is breached.
- Port enriches the incident with organizational context.
- A workflow investigates and checks live signals.
- If the issue matches a known recovery path, it gets auto-resolved.
- If not, it gets escalated to the correct team with full context.
That is the loop I wanted. Not just alerting. Not just dashboards. A closed-loop incident handling system. This is a practical version of agentic engineering applied to observability and incident management.
The Ingredients in the Stack
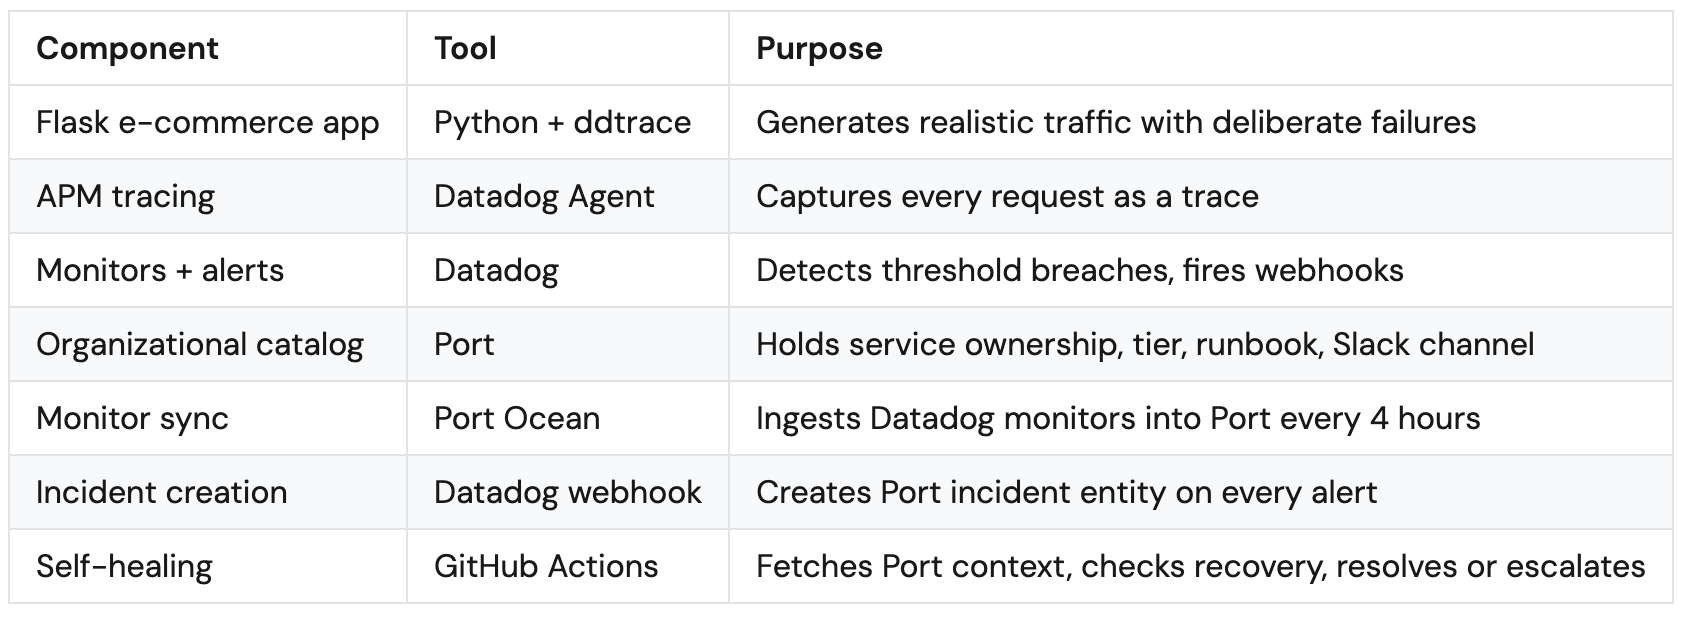
Here is what I used in the demo:
- Flask application to simulate a real service environment
- Datadog Agent for collecting telemetry
- Datadog APM and monitors for alerting and service visibility
- Port as the context and operations layer
- GitHub Actions for automated investigation and remediation steps
I also intentionally induced failures to create realistic incidents. That way, I could show the full path from alert to response, not just a static architecture slide.
What the Demo Application and Monitoring Setup Looked Like
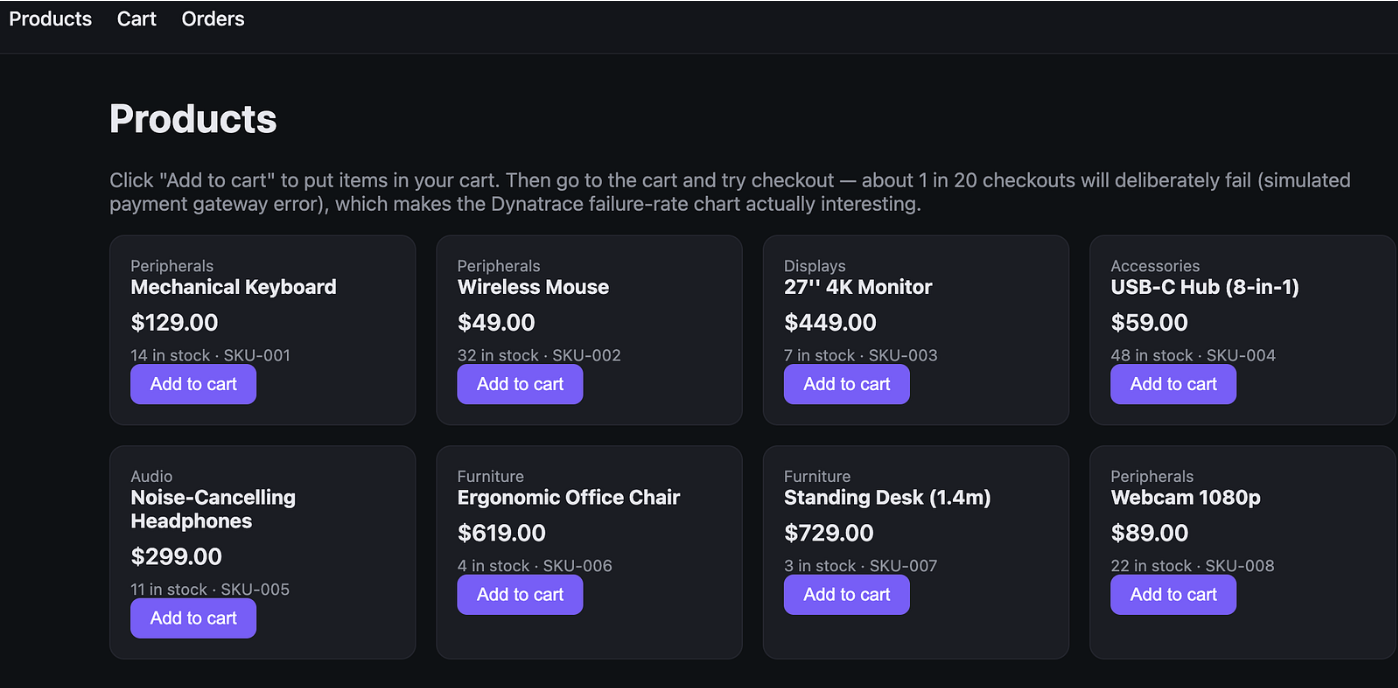
The app itself was a straightforward shop-style Flask app with a products page. Nothing fancy there. The important part was that failures were being created behind the scenes so Datadog would pick up real service issues. Once the Datadog agent was connected, infrastructure, logs, and services were visible inside the platform.
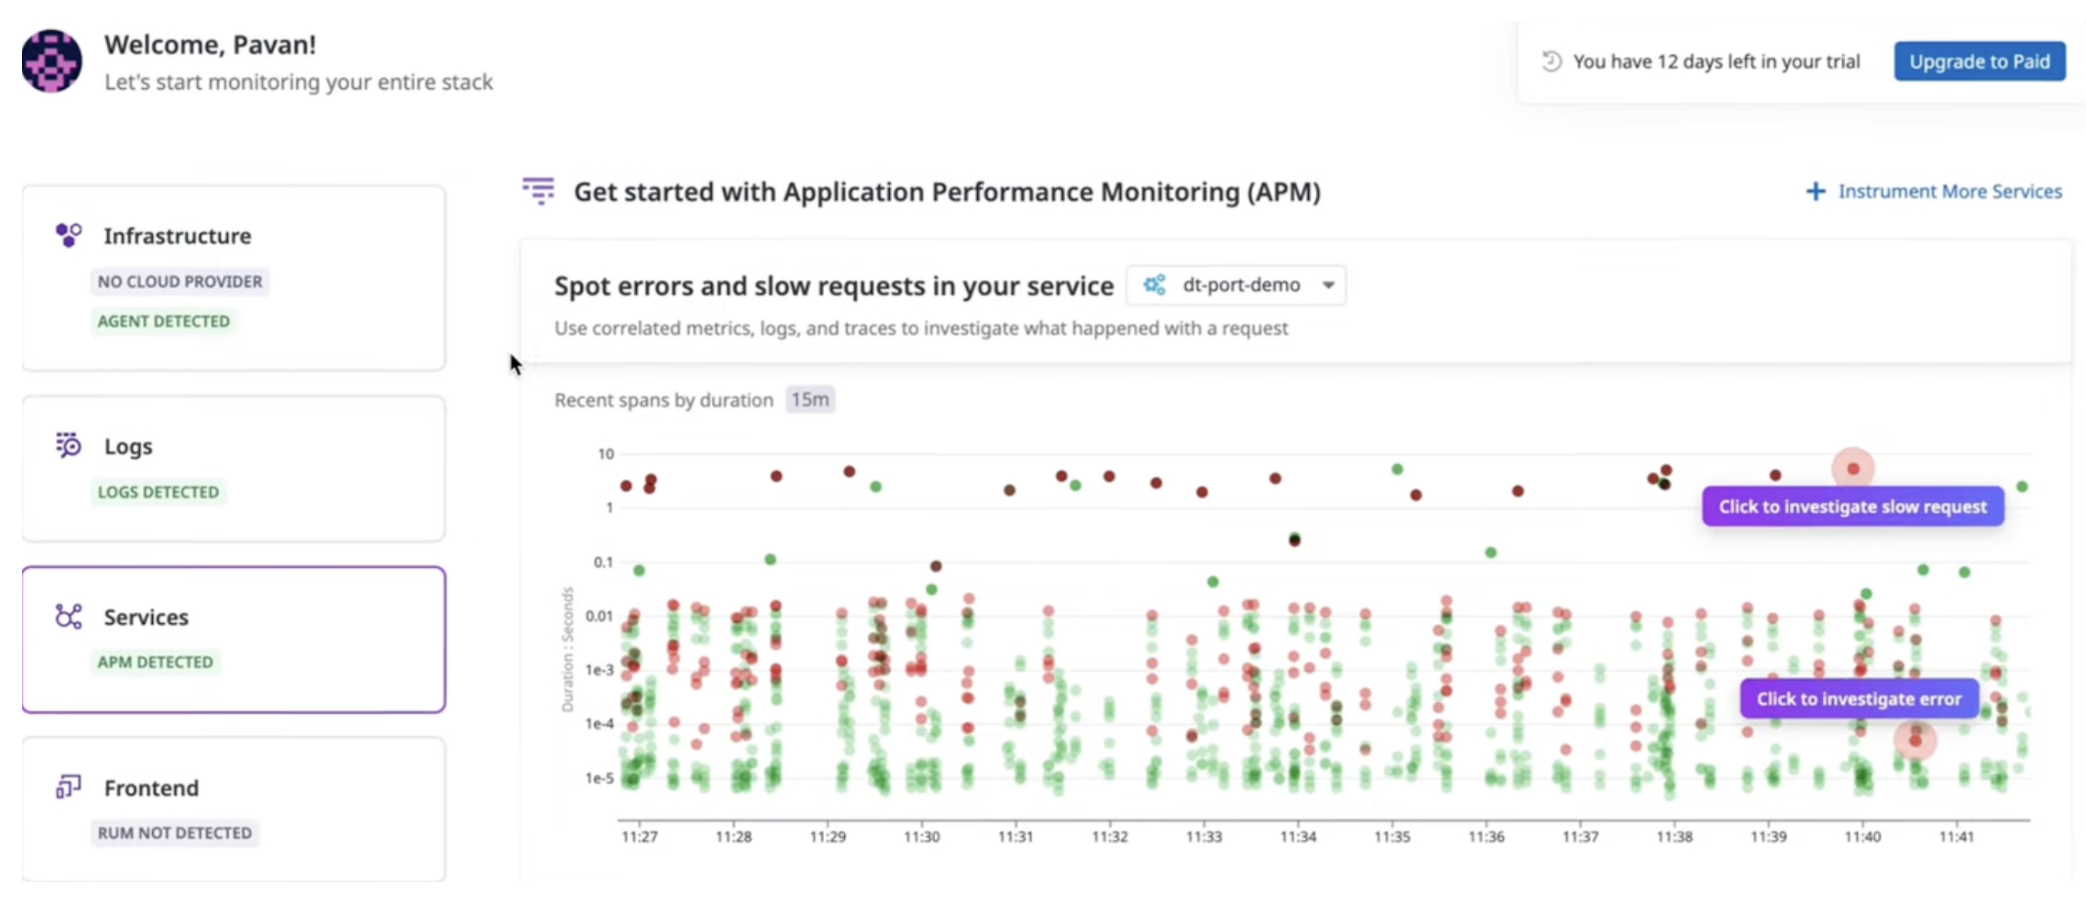
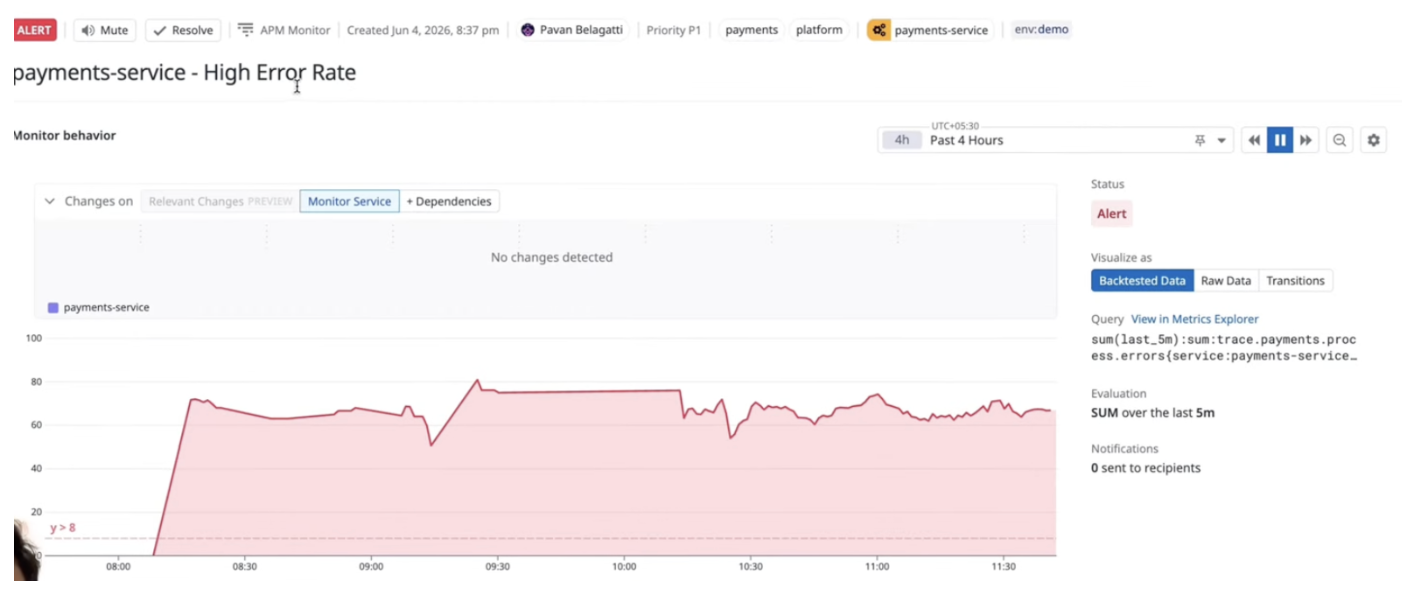
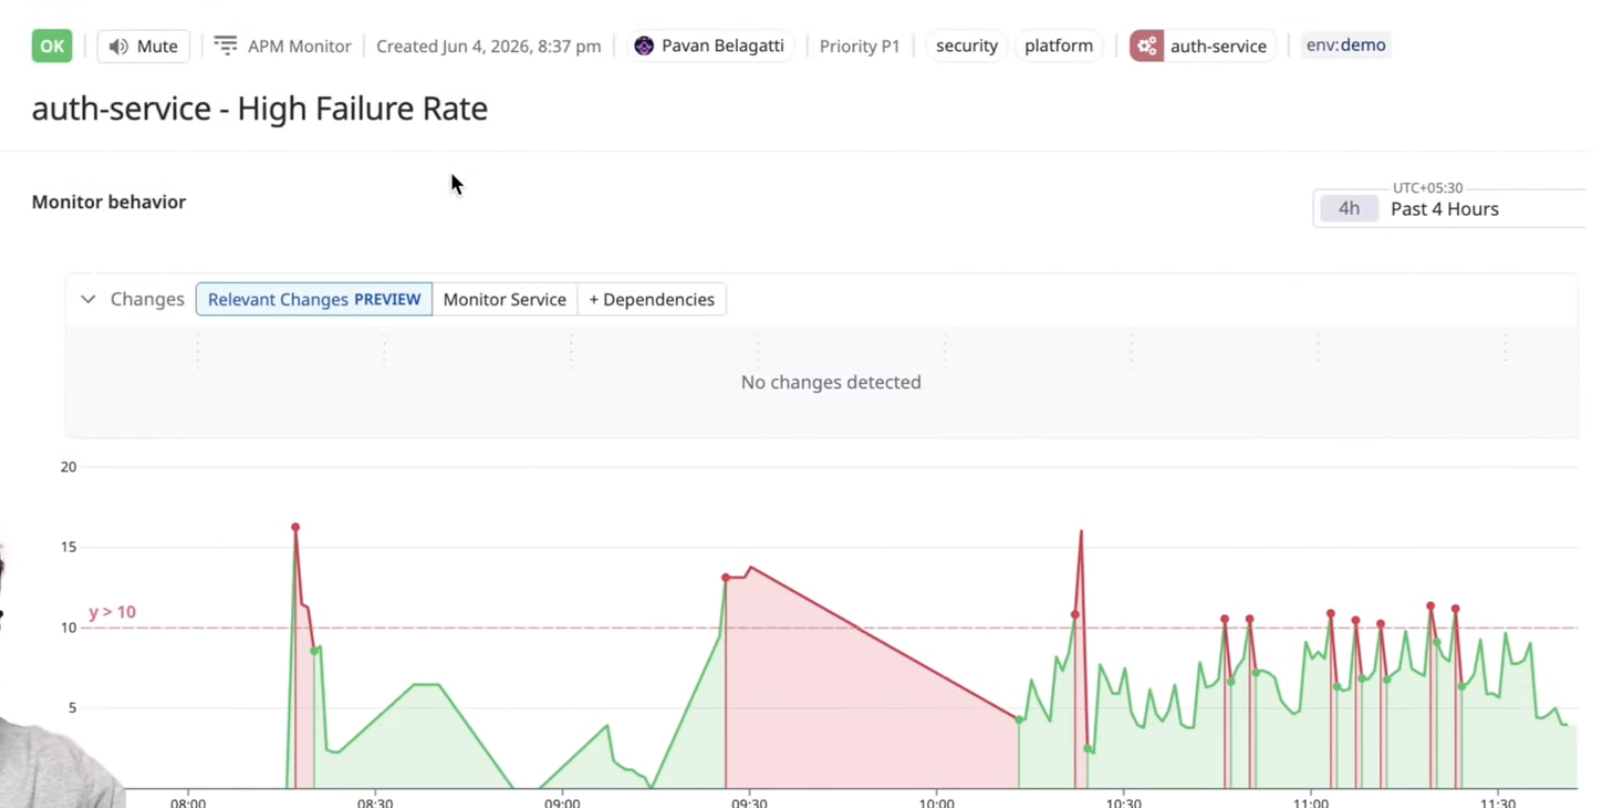
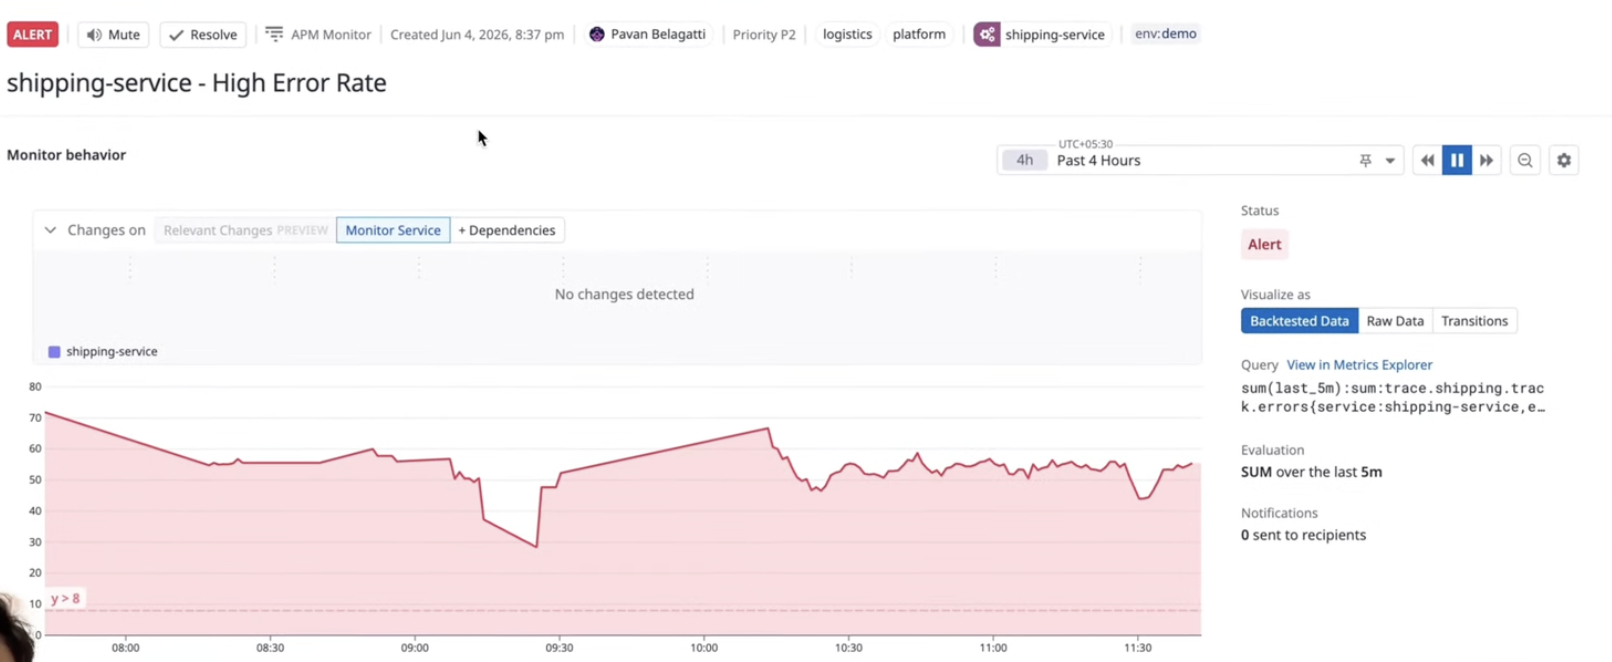
I created monitors for multiple services such as payment, auth, shipping, and the main app. Each monitor was configured around conditions like elevated error rate or failure rate. Some services were healthy at a given moment, while others stayed in alert because the recent signal history was still above the configured threshold.
This is one reason I like using Datadog here. It gives a solid visual understanding of service behavior, traces, and incidents. But again, that is only one half of agentic engineering. The second half is turning that telemetry into informed action.
Where GitHub Actions Fits Into Agentic Engineering
GitHub Actions became the execution layer for the response workflow. Every time an incident crossed the condition I had configured, the workflow ran. In the run logs, I could see the process authenticate with Port, fetch the entity data from Port, perform investigation steps, and then finish with either a resolution path or an escalation path.
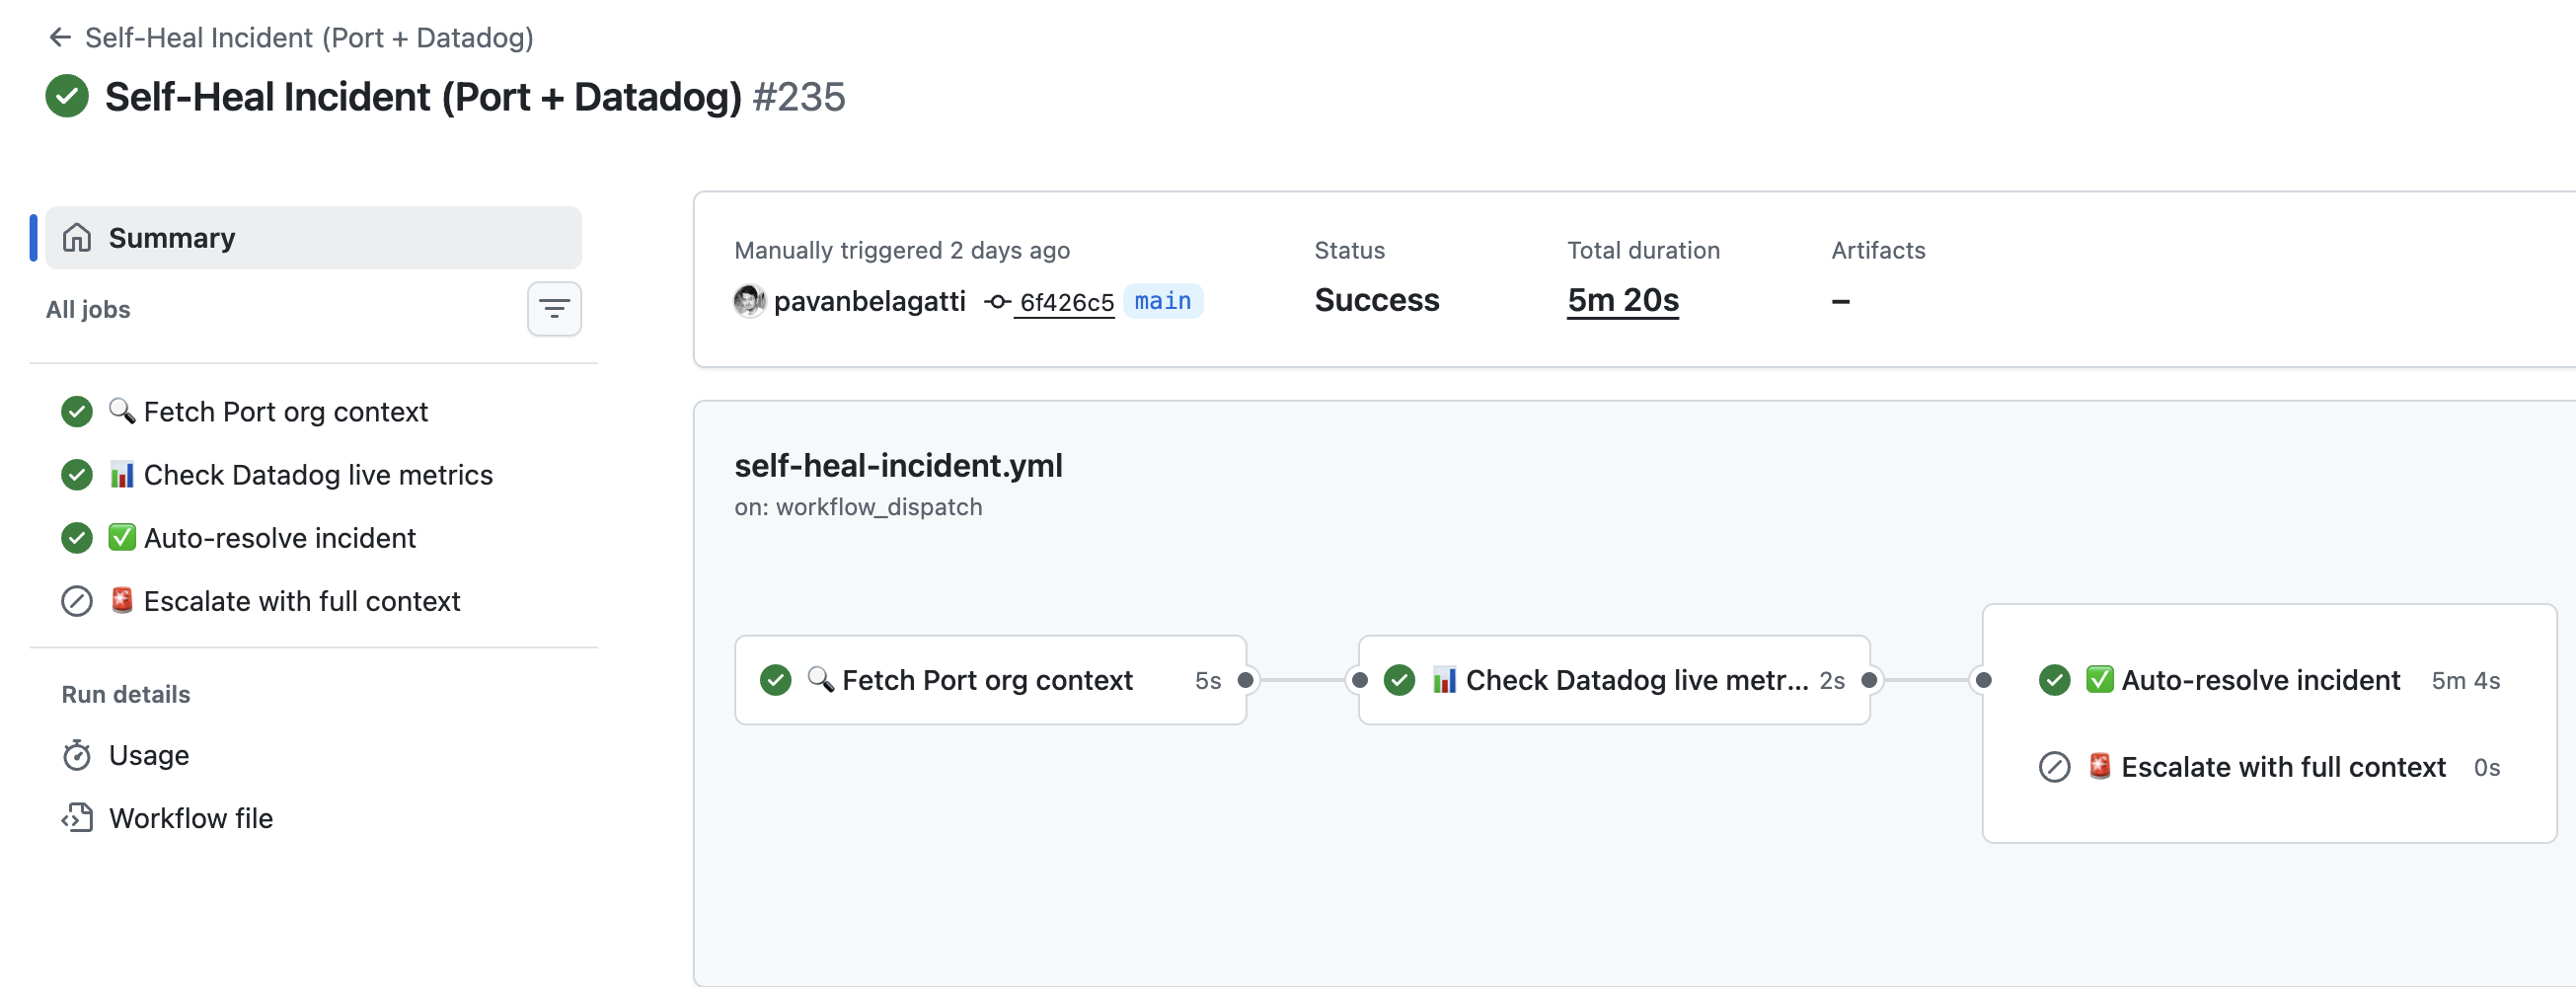
That detail is important. The workflow was not operating blindly. It first asked Port for context. Then it checked live metrics and determined whether remediation was appropriate. This is a clean example of agentic engineering because the automation is using context, reasoning steps, and current state before acting.
The workflow outcome had two possible endings:
- Auto-resolve if the incident was recoverable through a known safe action
- Escalate with full context if the issue needed human intervention
Even when escalation happened, it was still a big improvement. The receiving team did not get a vague alert. They got ownership, summary, severity, recommended action, and the relevant runbook context. That dramatically reduces triage time.
What Auto-Resolved Incidents Actually Mean
Auto-resolution is easy to oversell, so I prefer being specific. It does not mean every incident magically disappears. It means the system can detect a known scenario, apply a predefined runbook or remediation path, confirm the signals are back to normal, and then mark the incident resolved without involving a human.
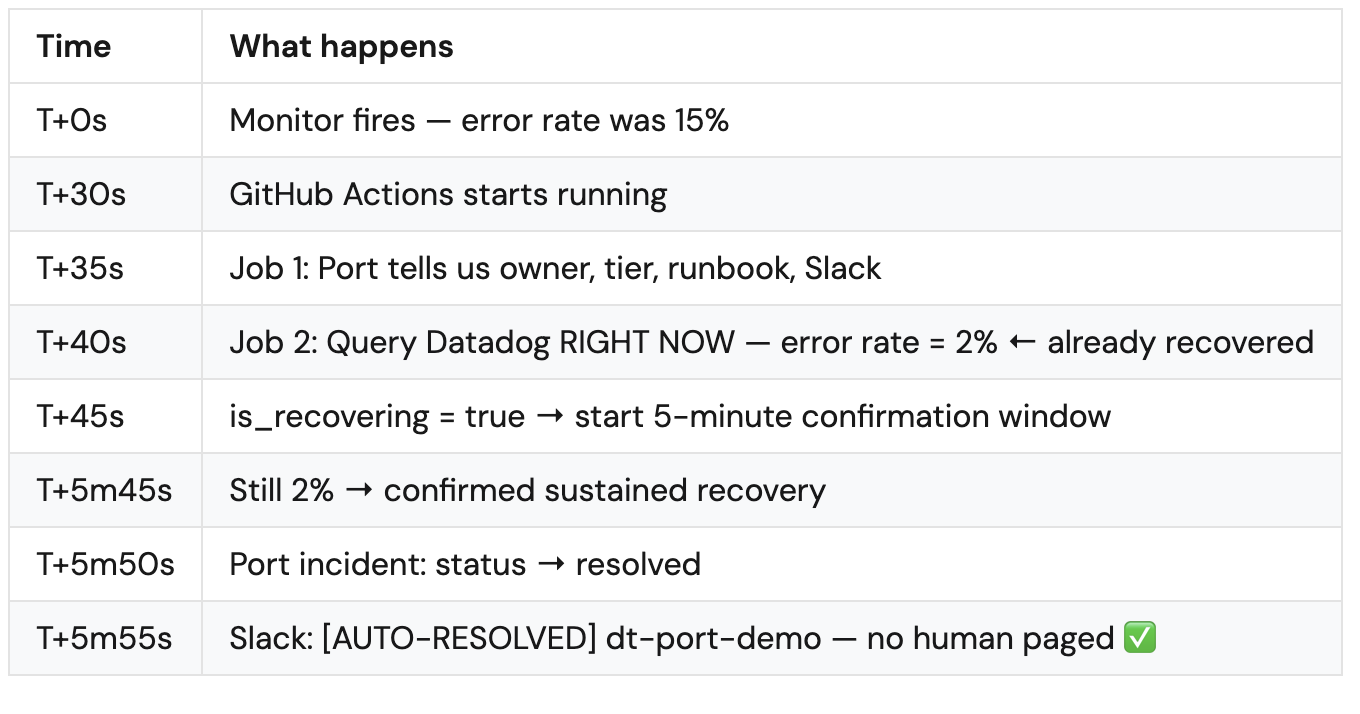
In the setup I showed, some incidents were auto-resolved, and others remained open or under investigation. That is exactly how it should work. A trustworthy agentic engineering system does not try to automate everything. It automates the safe, repeatable, low-ambiguity cases and escalates the rest.
In the incident dashboard, I could see:
- Total incidents
- Open incidents
- Datadog sourced incidents
- Auto-resolved incidents
- Severity breakdown
- Status breakdown
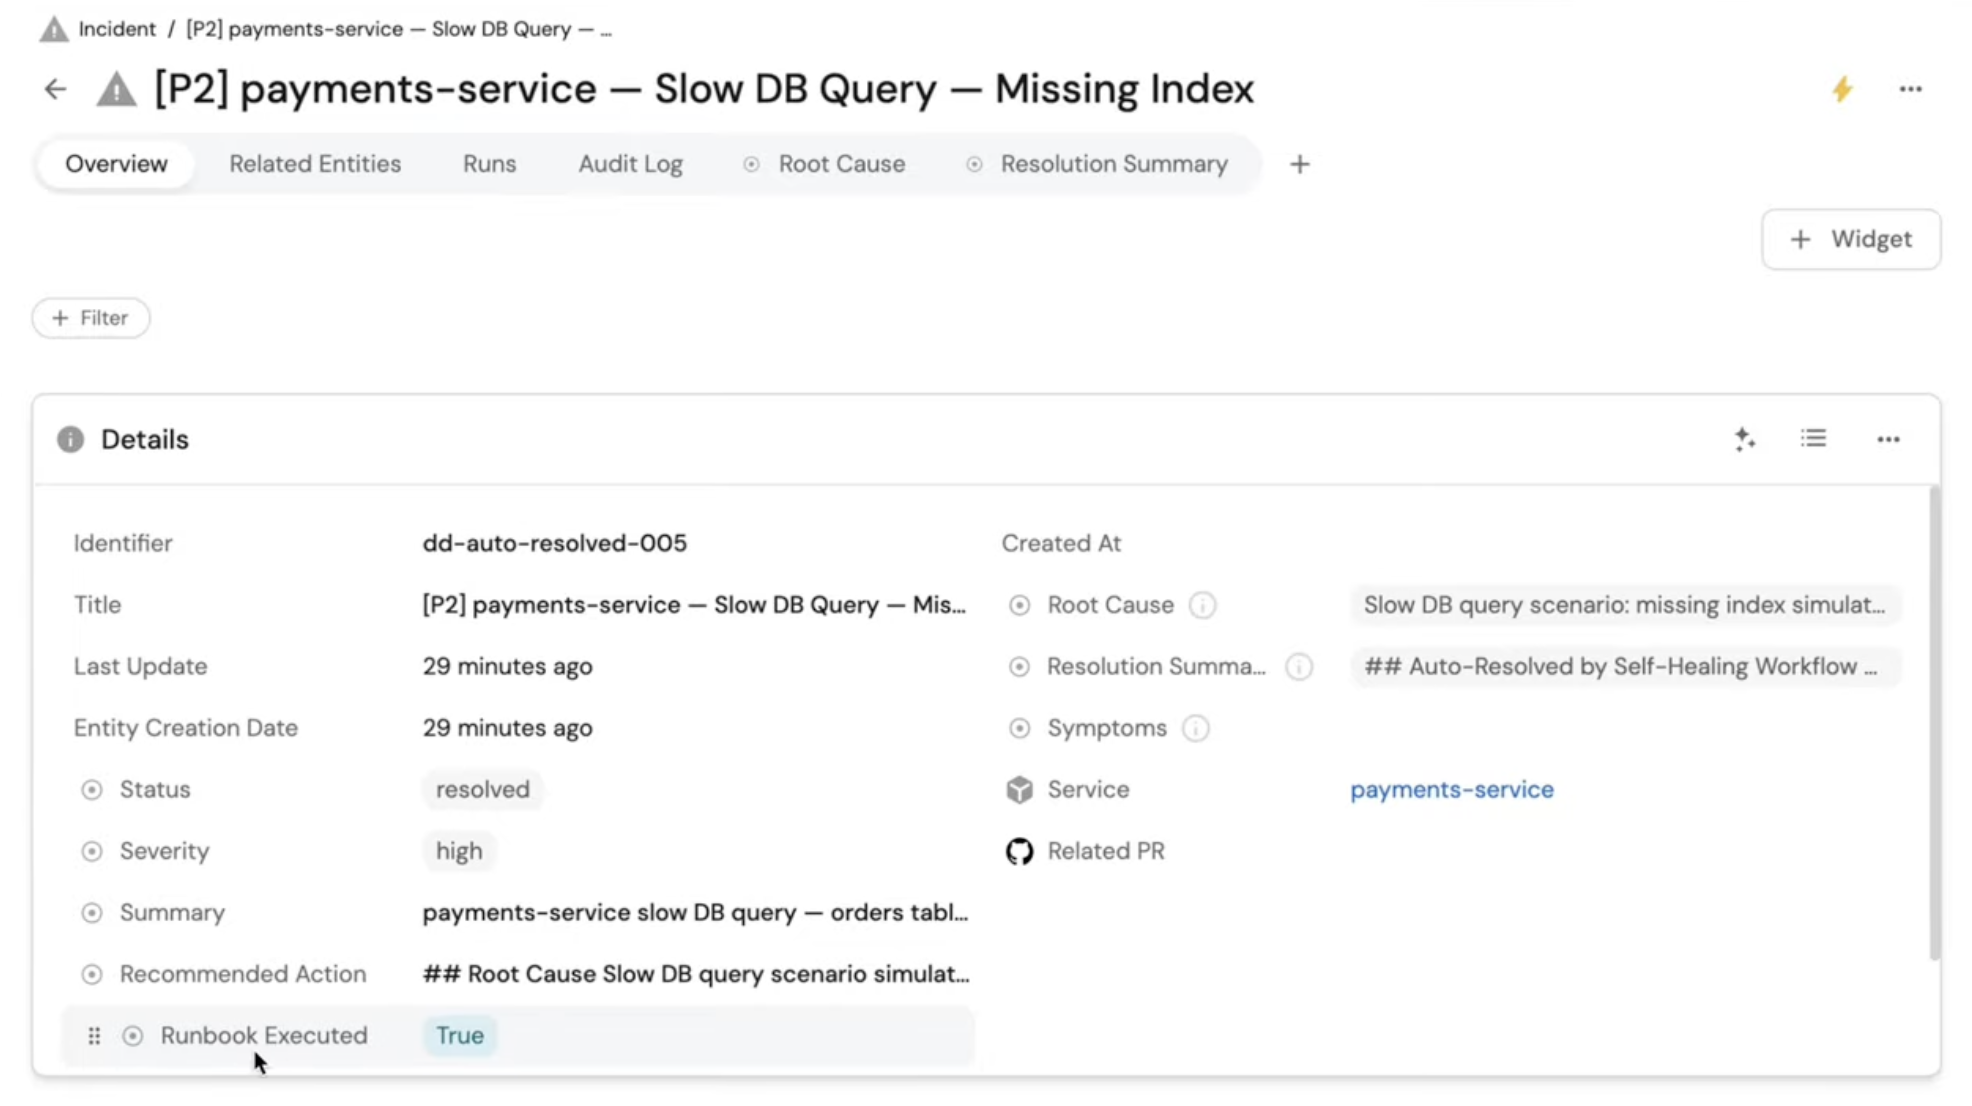
One example involved a payment service problem related to a slow database query caused by a missing index. The incident showed up with high severity, the runbook was executed, and the final status was resolved through the self-healing workflow. Other incidents stayed open because they required deeper investigation.
What I Could Inspect Inside Port Incidents
One thing I really liked in this setup was how clearly incidents could be represented inside Port. I could open a resolved incident and see the relevant details, such as severity, status, summary, and whether a runbook had already executed. I could also open an active incident and see that it was still being investigated, rather than pretending the system knew more than it did.
For unresolved issues, the incident records made it obvious that the system had preserved context for the next step. That is a big operational win. Instead of forcing the owning team to reconstruct the entire chain of events, the incident entity already captures what service is affected, what happened, what the likely area is, and what actions have already been attempted.
This is where agentic engineering becomes more than automation. It becomes operational memory.
Why This Reduces Time to Resolution
Better context shortens every stage of response:
- Detection stays with Datadog
- Context gathering comes from Port
- Execution runs through workflows
- Escalation goes to the correct team with less confusion
The result is less time spent asking basic questions and more time spent resolving the actual technical problem. That is the real productivity gain.
Agentic Observability Is a Practical Form of Agentic Engineering
I think a lot of people hear the word “agentic” and imagine something overly futuristic. But this is already a grounded, useful implementation. When I combine observability data, organizational context, and workflow execution, I get what I would call agentic observability or agentic incident response.
In other words, agentic engineering here is not about a chatbot replacing engineers. It is about giving the system enough structured knowledge and automation capability to do the boring, repetitive, high-confidence parts of operational work.
Port also supports integrations beyond Datadog. In the demo environment, I showed that I could connect various developer tools through Port data sources, including tools in the observability and alerting ecosystem such as Dynatrace, New Relic, and Sentry. That opens the door to broader engineering automation, not just incident workflows.
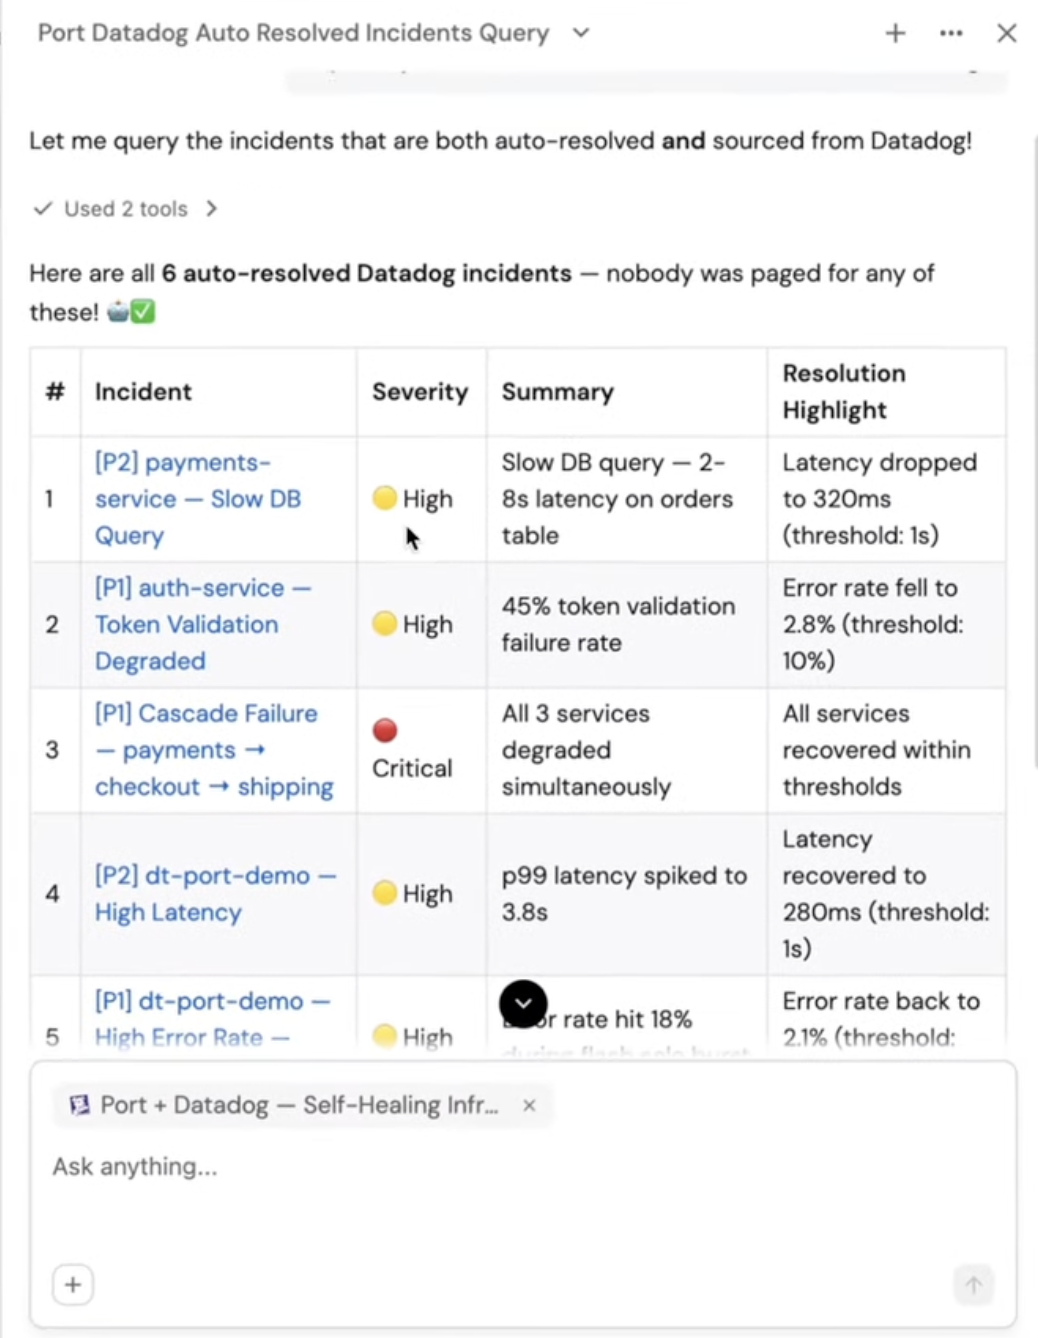
Using Port Chat as a Natural Language Layer
Another interesting piece was Port chat. Because the platform already had context from connected systems, I could ask a natural language question, such as requesting the auto-resolved incidents sourced from Datadog. The system then used the available tools and context to return a structured answer.
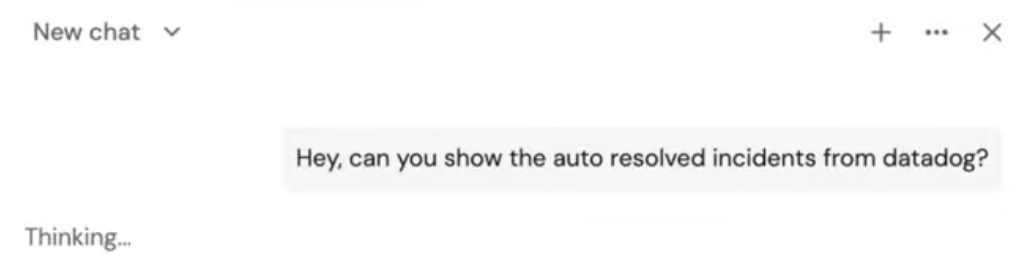
The result included the incidents that had been auto-resolved, along with useful details such as service name, severity, and resolution summary. The big takeaway was not that chat exists. Plenty of products have chat now. The useful part is that the chat interface sits on top of real engineering context.
That again is what makes it part of Agentic Engineering. The language layer is connected to data, workflows, and operational entities. It is not guessing. It is querying the same system of record used by the incident flow.
What This Setup Is Good For and What It Is Not
I would absolutely use this pattern for recurring operational issues where the remediation path is known and safe. Examples inside a real engineering organization might include restarting a component, rolling back a fresh deployment, running a validation step, or escalating with a complete context package. Those are ideal candidates for agentic engineering.
I would not treat it as a license to automate every production issue. High-risk actions still need guardrails. Unknown failure modes still need humans. Complex outages across multiple dependencies still need engineering judgment. The point is not to remove people from the process. The point is to remove waste from the process.
A healthy implementation usually follows this rule:
- Automate what is repetitive and reversible
- Enrich what is ambiguous
- Escalate what is risky or novel
If I stick to that, agentic engineering becomes reliable instead of reckless.
How I Think About the Value of This System
The biggest value is not that six incidents got auto-resolved in a demo. The bigger value is that the entire incident loop became structured. Datadog provided the signal. Port provided the meaning. Automation provided the action. That is the pattern I want to replicate across engineering systems.
Even when no incident is auto-resolved, the system still improves outcomes because it captures context and routes work intelligently. If an issue does get resolved automatically, even better. That means nobody has to be paged for a problem the system already knows how to fix safely.
That is the promise of agentic engineering when done properly. Not flashy demos for their own sake, but operational systems that reduce toil, improve response quality, and preserve engineering attention for harder problems.
Opinions expressed by DZone contributors are their own.
Comments