Formulating a Robust Strategy for Storage in Amazon Relational Database Service PostgreSQL Deployments
This article explores understanding the key components of RDS storage, optimizing these storage factors, and capping storage growth by utilizing retention periods.
Join the DZone community and get the full member experience.
Join For FreeIf you are using the AWS Relational Database Service (RDS) offered managed database services, you may wonder how to strategize database storage size. Strategizing database storage includes understanding the key components of RDS storage, optimizing these storage factors, and capping storage growth by using retention periods.
AWS RDS offers managed database services for Oracle, MySQL, PostgreSQL, and SQL Server. These managed services include automated backups, single-click upgrades, replication and high availability, and disaster recovery solutions. Under the hood, all these RDS databases use Amazon Elastic Block Store (EBS) volumes for storage. This post discusses the storage components, optimization steps for these storage components using automation, and utilizing various retention period mechanisms to control storage growth.
Components of RDS PostgreSQL Storage
AWS RDS PostgreSQL uses Amazon EBS volumes for storage. The limitations on the size and performance of these storage volumes are governed by AWS EBS limitations and characteristics. RDS PostgreSQL offers various configuration options for High Availability and Disaster Recovery purposes, including Multi-AZ and Multi-AZ clusters. For simplicity, we'll discuss Single-AZ RDS PostgreSQL EBS volumes.
Before jumping into the RDS PostgreSQL EBS contents, let's have a look at the community PostgreSQL storage components. Once we understand the community PostgreSQL data directory architecture, we can easily understand the RDS storage components. Looking at the PostgreSQL 15 $PGDATA directory, we find the following files and directories:
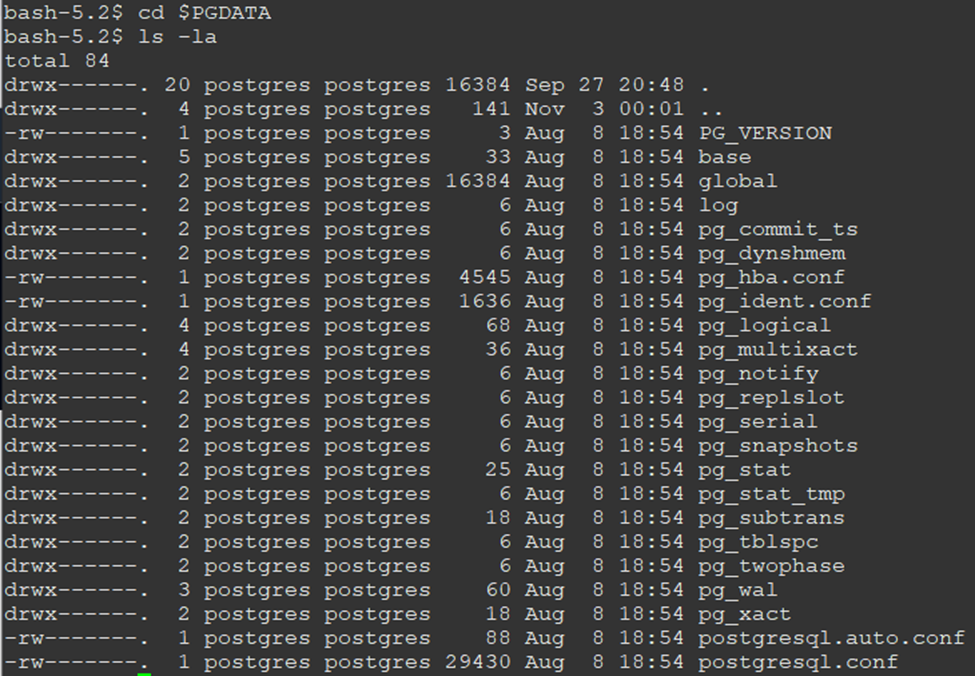
Most of the storage is consumed by the base, pg_wal, and log directories. The base directory contains all relational data, such as tables, indexes, and sequences. The pg_wal directory contains write-ahead log files. PostgreSQL records any modifications to data files in transactional logs called write-ahead log (WAL) files. The log directory contains database log files, which log database activities. The following diagram shows major directories with typical relative sizes in the PGDATA directory:

It's worth noting that in the community PostgreSQL, you can create tablespaces for hosting objects on different storage drives. This option is not supported in RDS PostgreSQL. All data is stored in EBS volumes. With that in mind, below are the major storage components of a Single-AZ RDS instance and strategies to manage storage growth. Managing storage includes understanding retention options, automating the purging of old data, and proactively monitoring storage growth.
Database Log Files
All database activities are logged in RDS PostgreSQL log files. A common use case for these log files is to identify issues with database workloads, query failures, login failures, deadlocks, and fatal server errors. The size of the log files is governed by some PostgreSQL logging parameters and the RDS log file retention setting.
Large log files can consume most of your RDS storage and cause production outages if the consumed storage reaches 100% of the provisioned storage. It's critical to review what you are logging and whether the logged information is needed for the business.
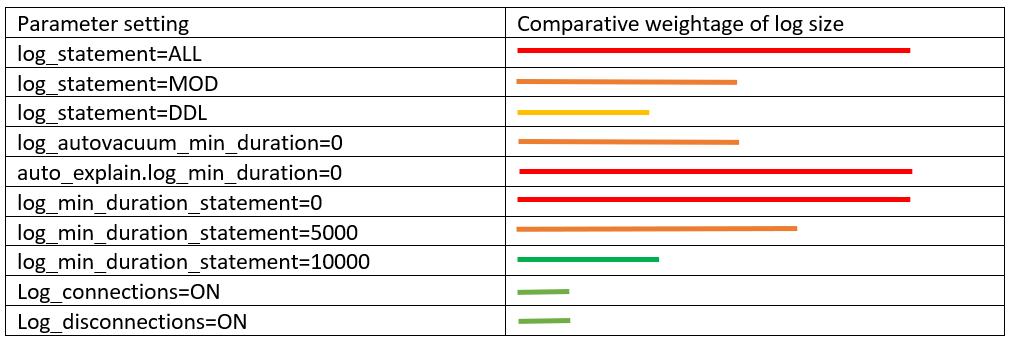
The most important parameters that dictate the size of log files are log_statements, log_min_duration_statement, log_connections, and log_disconnections. Most fintech companies, who are required to log all user and application activities, set the most verbose option log_statement=all. This is the easiest way to bloat the log files and invite storage issues if storage consumption is not monitored. Pg_audit can be a smarter way of logging user activities, where you can specify which class of activities you want to log, such as READ, WRITE, DDL, or FUNCTION.
Below is a diagram that shows the typical verbosity based on the logging parameter settings in PostgreSQL:
One of the good practices for controlling storage used by log files is setting log file retention. The RDS parameter rds.log_retention_period sets the retention period for log files.
For example, the default setting of 3 will purge log files after 3 days of their creation. Most users set it to a lower value, such as one day, and have an automated job, such as a Lambda function, configured to back up the log files to S3 as soon as they are created. Later, you can automate pgBadger to analyze these log files and send you reports at a set frequency. The following AWS CLI command can be used to find out the total size of log files in an RDS database:
aws rds describe-db-log-files --db-instance-identifier <rds_identifier> | grep "Size" | grep -o '[0-9]*' | awk '{n += $1}; END{print n}'
If the total size of log files is over 25% of the total RDS used storage, it's time to build a strategy for reviewing the logging parameters and retention settings.
Database Objects
Database objects include regular database relations such as tables, indexes, and sequences. Below are the top factors why PostgreSQL database sizes keep increasing in an uncontrolled manner:
Table Bloat
When PostgreSQL deletes a row, it keeps the old version of the tuple for MVCC (multi-version concurrency control) purposes. This way, writers don't interrupt readers, and readers don't interrupt writers. Cumulatively, these dead tuples are called bloat.
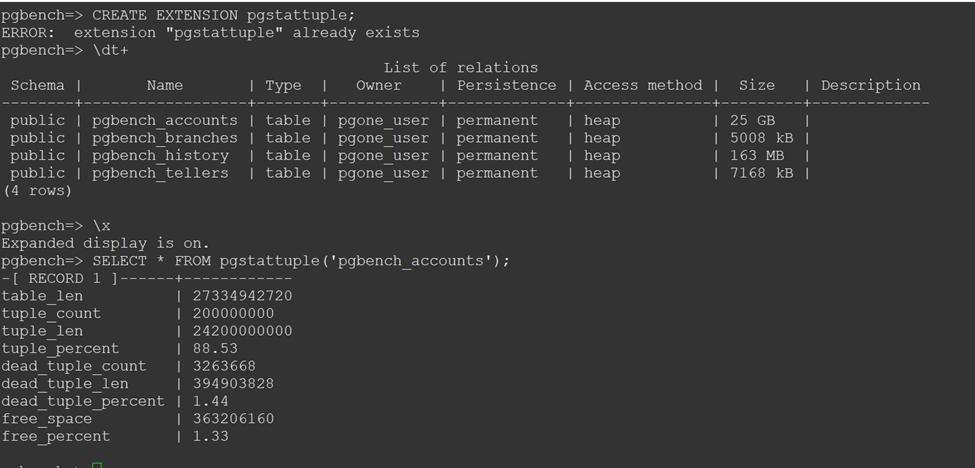
In PostgreSQL, an UPDATE is a combination of DELETE and INSERT. Thus, DELETE and UPDATE operations are responsible for bloat. Bloat can occur in tables or indexes. PostgreSQL hosts a native daemon process called autovacuum responsible for cleaning up this bloat and making the space available for subsequent inserts. There are some common reasons that prevent autovacuum from completing its cycle, and manual review of parameters is important. These reasons include the table being super active in use and exclusive locks blocking autovacuum jobs, long-running queries pausing autovacuum, and autovacuum_max_workers not set high enough to vacuum all bloated tables. The most optimal way to measure bloat in your database is by using the pgstattuple extension.
Alternatively, you can use the official query from the PostgreSQL wiki to find a loose estimation of table bloat. The image below shows how to use pgstattuple to find the number of dead tuples. In this example, the pgbench_accounts table has a total of 200,000,000 rows and 3,263,668 dead rows, i.e., 1.44% bloat. Anything over 10% should be diagnosed, and DBAs should find the reason for the excessive bloat. The 10% factor comes from the autovacuum_vacuum_scale_factor parameter's default value in RDS PostgreSQL, which suggests autovacuum to launch if bloat goes over this value.
Controlling bloat will not only control overall table size but also improve workload performance and save I/O operations.
Time Series Data
I have encountered many customers hosting time-series data in PostgreSQL databases. PostgreSQL offers great features for time-series data. It's important to purge old data and set the row retention period. PostgreSQL natively doesn't support TTL (Time to Live) for table rows.
However, this can be achieved by using a trigger and function. The most suitable approach for handling time-series data growth is table partitioning. Table partitioning not only makes purging data easier by dropping old partitions but also makes maintenance jobs such as autovacuum more effective on large tables. Pg_cron is a suitable extension to purge old partitions at a set frequency. The command below purges data older than 10 days every midnight:
SELECT cron.schedule('0 0 * * *', $$DELETE

    FROM cron.job_run_details

    WHERE end_time < now() - interval '10 days'$$);
Storing Unwanted Data
I have met with many customers storing database logs and application logs in relational databases. The following query can be used to find the least accessed tables — the last line of the code searches for tables with less than 10 scans.
SELECT

    relname,

    schemaname

FROM

    pg_stat_user_tables

WHERE

    (coalesce(idx_tup_fetch,0) + coalesce(seq_tup_read,0)) < 10;
The smarter approach could be storing application logs in cheaper storage options such as S3. Regular review is important to ensure you only store the working dataset in your relational database.
Temporary Files
Data resulting from large hash and sort operations that cannot fit in work_mem are stored in temporary files. Uncontrolled generation of sort and hash data can easily occupy most of the RDS PostgreSQL storage. The logging parameter log_temp_files should be enabled to log temporary file activities, and work_mem should be set to higher values. By looking at the logging details coming from the log_temp_files parameter, you can find the associated tables and queries causing most of the temporary data.
One of the best practices is to set work_mem at the session level. In the EXPLAIN plan, look for the pattern: "Sort Method: external merge Disk: 47224kB". This shows that the query will create around 50MB of temporary files. In the query session, use SET LOCAL work_mem = '55MB'; to optimize query performance and lower temporary data.
Conclusion
In this post, we explored some strategies for storage capacity management in Amazon Relational Database Service PostgreSQL deployments. Having a close eye on the top storage contributors helps optimize storage consumption, reduces overall operational costs, and increases application performance. If you have any questions or suggestions about this post, leave a comment.
Opinions expressed by DZone contributors are their own.
Comments