


Ampere PMU Profiler: A Guide to Microarchitecture Profiling
APP uses PMU metrics to pinpoint CPU stalls, cache misses, and other microarchitectural bottlenecks on Ampere processors
 ·
·
Executive Summary
The Ampere® PMU Profiler (APP) is a Python-based tool designed to provide deep insight into the microarchitectural behavior of applications running on Ampere CPUs (e.g., Ampere® Altra® and AmpereOne®). Unlike standard profilers that identify where time is spent (e.g., which functions consume CPU time), the PMU Profiler explains why time is being spent by measuring low-level hardware events associated with the CPU pipeline and execution behavior.
A key outcome of APP is that it enables performance engineers to move from coarse symptoms to actionable causes. For example, while application-level profiling can show an expensive code path, APP can help identify whether the expense stems from inefficient instruction fetching, data cache misses, or other microarchitectural factors that are difficult or impossible to isolate using application-level tools alone. The document outlines a top-down performance analysis methodology and positions APP as an essential final step for expert-level tuning, particularly on Ampere platforms, where you must understand hardware-level bottlenecks and then apply targeted code optimizations.
APP is intended to complement system-level analysis rather than replace it. System-level profilers are useful for identifying high-level bottlenecks such as resource saturation or contention, but APP is focused on microarchitecture-level analysis by collecting hardware events. This makes APP especially valuable after system bottlenecks have been eliminated or ruled out, leaving “microarchitecture inefficiency” as the remaining likely cause of slowdowns.
What Is the Ampere PMU Profiler?
The Ampere PMU Profiler uses Linux perf utility with validated PMUs and metrics on Ampere CPUs. Its purpose is to capture microarchitectural performance indicators through hardware event measurement. In practice, this means APP collects events measured by perf stat that relate to the CPU pipeline and execution mechanisms, allowing engineers to determine what is slow and the underlying microarchitectural reason.
A central distinction between APP and application profiling tools is the level of visibility. Tools that sample stack traces (or count function invocations) typically answer the question, “Which functions are active during the slow period?” APP answers a more hardware-specific question: “Which microarchitectural mechanisms are consuming cycles, and what stalls or inefficiencies are present?”
The APP workflow assumes that developers can form a hypothesis about where the bottleneck likely originates, such as a particular loop or data access pattern, and then rely on PMU event measurements to confirm or refute those hypotheses at the microarchitectural level.
Why Do We Need APP?
Performance problems are frequently multi-layered. Even after system-level bottlenecks are addressed (for example, ensuring that CPU is not idling due to I/O, ensuring there is sufficient memory, and verifying resource utilization), some workloads still perform poorly because the CPU spends cycles in inefficient pipeline states.
APP helps solve this class of problems by measuring hardware-level behavior. For example, APP can identify microarchitectural bottlenecks such as:
- Inefficient instruction fetching
- Data cache misses
- Branch-related pipeline effects
- Other pipeline-level stall sources that manifest as lost cycles
This capability is important because microarchitectural causes often do not map cleanly to application symptoms. Code can appear “hot” in a profiler, but the reason it is slow might be due to how it interacts with cache hierarchies, how it causes translation or fetch inefficiencies, or how the processor recovers from pipeline disruptions. Those details are what PMU-based measurement aims to expose.
APP also links investigation to “unlocking the full performance potential” of the hardware. By understanding CPU-level bottlenecks, engineers can choose targeted optimizations that application-level tools alone cannot determine with confidence. This ultimately leads to more efficient software and better utilization of Ampere hardware for competitive workloads.
When Do We Use the Ampere PMU Profiler?
Understanding the APEX Framework
Performance tuning is a process of systematic investigation, moving from a broad, system-wide view down to the specific interactions between code and hardware.
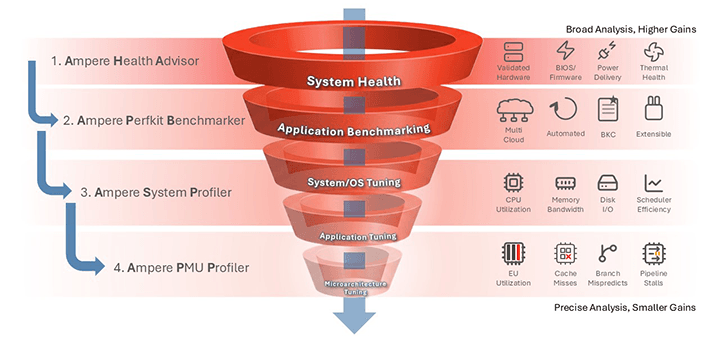
Performance optimization is as much art as it is science. The APEX (Adaptive Profiling and Execution) framework uses tools and methodologies to add structure and rigor to the process and can bridge the gap between creative intuition and empirical fact. We propose applying the APEX methodology to enable root cause analysis for solving performance problems. Follow the funnel above from top to bottom to effectively use the procedure.
The methodology recommends starting with assessing platform health as a first step to ensure that the platform used for performance analysis is set up well as an unhealthy platform may mislead the performance analysis.
Consider capturing initial performance metrics before tuning any system or application settings. This establishes a clear understanding of the current workload and identifies key scalability knobs. We recommend using Ampere’s PerfKit Benchmarker (APB), which supports many open-source applications, to create a reliable baseline for further analysis and tuning.
Next is to assess system performance and any hardware or system bottlenecks— this is where Ampere System Profiler (ASP) is useful to eliminate any system or resource bottlenecks. ASP can also be used to right-size the instance shape and ensure the compute resources are efficiently consumed by the workload.
One method that may be used is to leverage APB’s automated benchmarking framework to start and stop ASP’s collectors during the run phase of a given APB benchmark. This ensures that profile is collected while critical code paths are executed and a clear report profile is generated.
Once system and resource bottlenecks are eliminated, if the performance issue persists and points to CPU cycles not being used efficiently, we propose going to the next step in the pyramid and using the Ampere PMU Profiler to root-cause the issue further.
Finally, system benchmarking should be done after all bottlenecks are resolved or analyzed to effectively measure the system’s performance for the workload.
Following this systematic APEX methodology ensures that we eliminate possible issues as a part of a structured process to efficiently conduct root-cause analysis.
System-Level Analysis
At the microarchitecture level, performance is shaped by how the CPU pipeline handles instruction delivery, execution, and memory access. APP leverages PMU measurements to identify pipeline behavior and stall sources.
Memory Hierarchy and Performance Loss
APP emphasizes the performance significance of the memory hierarchy. As data access moves from registers to L1 cache, to L2 cache, to L3 cache, and finally to DRAM, access becomes exponentially slower. Because of this, cache misses are a primary cause of performance loss. This provides a conceptual foundation for many APP investigations: If a workload touches large working sets or accesses data in a non-contiguous pattern, it may trigger cache misses that increase effective latency and reduce throughput.
Microarchitectural Bottleneck Identification
APP can be used at the microarchitecture level to understand where stalls might be in the pipeline. The APP role is to collect hardware events related to pipeline stall behavior and to use those events to characterize the workload’s execution profile. This capability matters because pipeline stalls and inefficiencies can dominate runtime even when application-level profiling points to a “hot” function without explaining the root cause.
Key Questions
APP is structured around answering questions that cannot be fully resolved with application-level profiling alone. Based on the described APP workflow and report interpretation strategy, APP can help you answer:
- Where are cycles going at the microarchitectural level? The APP HTML report and TDA sunburst charts are used to broadly characterize whether time is dominated by categories such as instruction retirement behavior, front-end bound behavior, or back-end bound behavior.
- Which stall or inefficiency class is consistent with the hot code path? Once you hypothesize a bottleneck mechanism (e.g., cache misses from non-contiguous access), APP measurements can confirm whether the observed behavior aligns with that mechanism.
- What microarchitectural reason explains a hot function’s cost? APP’s purpose is explicitly to explain why time is spent by measuring hardware events. This allows developers to translate hot functions into hardware interactions that can be optimized.
- Is the workload limited by instruction delivery vs execution/memory? By inspecting broad characterization categories (front-end vs back-end bound) in the APP HTML report, engineers can determine which side of the pipeline is more likely to be limiting performance.
Example Usage and Output
The below example command attempts to collect:
- PMU profiling samples for 120s
- With a sampling interval of 1s
- Profiles on cores 1 and 2
- TopDown metrics and render TDA sunburst chart
- PMU profiles while running the workload affinitized to cores 1 and 2
app -n 120 -c 1,2 -i 1 –tda -o <folder> -j “taskset -c1,2 <workload>Metrics reported by APP:
| Metric Name | Description |
|---|---|
IPC |
Instructions retired per CPU cycle across user and kernel execution unless separated |
IPC_kernel |
Instructions retired per CPU cycle while executing in kernel/EL1 |
cpu_freq |
Average core frequency during the measurement interval, typically in GHz or MHz |
| Cycle Accounting Metrics | |
frontend_bound |
Share of cycles in which retirement is limited by front-end activity (e.g., fetch, branch prediction, decode, ICache, ITLB, queueing) |
backend_bound |
Share of cycles in which retirement is limited by back-end resources, cache or memory latency/bandwidth, or ROB/LSQ pressure |
| Branch Effectiveness Metrics | |
branch_mispredict% |
Percentage of retired branch instructions that were mispredicted |
branch_mpki |
Branch mispredictions per 1,000 retired instructions |
| DTLB Effectiveness Metrics | |
dtlb_mpki |
Data TLB misses per 1,000 retired instructions requiring translation refill or a walk beyond L1 DTLB |
dtlb_walk% |
Percentage of DTLB misses that trigger a page-table walk rather than being resolved by another TLB level |
l1d_tlb_miss% |
L1 DTLB miss rate relative to DTLB accesses |
l1d_tlb_mpki |
L1 DTLB misses per 1,000 retired instructions |
l2_tlb_miss% |
L2 or second-level DTLB miss rate relative to L2 TLB accesses |
l2_tlb_mpki |
L2 or second-level DTLB misses per 1,000 retired instructions |
| ITLB Effectiveness Metrics | |
itlb_mpki |
Instruction TLB misses per 1,000 retired instructions |
itlb_walk% |
Percentage of ITLB misses that trigger a page-table walk instead of hitting in a next-level TLB |
l1i_tlb_miss% |
L1 ITLB miss rate relative to ITLB accesses |
l1i_tlb_mpki |
L1 ITLB misses per 1,000 retired instructions |
| L1 Cache Effectiveness Metrics | |
l1i_mpki |
L1 instruction-cache misses per 1,000 retired instructions |
l1d_mpki |
L1 data-cache misses per 1,000 retired instructions |
l1i_miss% |
L1 instruction-cache miss rate |
l1d_miss% |
L1 data-cache miss rate |
| L2 Cache Effectiveness Metrics | |
l2_mpki |
L2 cache misses per 1,000 retired instructions; exact scope depends on event mapping |
l2_miss% |
L2 cache miss rate relative to L2 accesses |
l2d_inv_pki |
L2 data-cache invalidations per 1,000 instructions |
l2_snoops_pki |
L2 snoop transactions per 1,000 instructions |
l2d_inv_per_snoop |
Average number of invalidations generated per snoop |
| Operation Mix Metrics | |
branch_percentage |
Percentage of retired instructions that are branch instructions |
crypto_percentage |
Percentage of retired instructions that are crypto, CRC, or hash-class instructions |
integer_dp_percentage |
Percentage of retired instructions that are integer data-processing operations |
load_percentage |
Percentage of retired instructions that are loads |
store_percentage |
Percentage of retired instructions that are stores |
scalar_fp_percentage |
Percentage of retired instructions that are scalar floating-point operations |
simd_percentage |
Percentage of retired instructions that are SIMD/NEON vector operations |
| Pipeline Stall Frontend | |
stall_frontend_cache_rate |
Share of cycles stalled because of instruction-side cache or fetch-delivery issues |
stall_frontend_tlb_rate |
Share of cycles stalled because of ITLB or translation-related front-end issues |
stall_recovery_rate |
Share of cycles spent recovering from pipeline flushes (e.g., branch-misprediction recovery) |
stall_fronetend_bob_rate |
Share of cycles stalled because the front-end buffer or queue is full or blocked |
| Pipeline Stall Backend | |
stall_backend_cache_rate |
Share of cycles stalled because of data-side cache-hierarchy latency |
stall_backend_tlb_rate |
Share of cycles stalled because DTLB misses or page walks delay loads and stores |
stall_backend_mem_rate |
Share of cycles stalled because of main-memory/DRAM latency or bandwidth limits |
stall_backend_core_rate |
Share of cycles stalled because of core execution limits (e.g., dependency chains, execution-unit throughput) |
stall_backend_resource_rate |
Share of cycles stalled because of internal resource pressure (e.g., queues, buffers, credits) |
stall_rob_id_rate |
Share of cycles in which progress is limited by reorder-buffer or in-flight instruction capacity |
stall_ixu_sched_rate |
Share of cycles stalled because of integer execution scheduler or issue-queue pressure |
stall_fsu_sched_rate |
Share of cycles stalled because of FP/SIMD execution scheduler or issue-queue pressure |
stall_lob_id_rate |
Share of cycles stalled because the load buffer or queue is full or blocked |
stall_sob_id_rate |
Share of cycles stalled because the store buffer or queue is full or blocked |
| Uncore Metrics | |
slc_miss% |
System-level cache (SLC/LLC) miss rate for requests reaching the SLC |
mc_retry_rate% |
Percentage of memory-controller transactions that are retried, indicating fabric or memory-controller pressure |
memrd_bw_GBps |
Estimated DRAM read bandwidth consumed in GB/s |
memwr_bw_GBps |
Estimated DRAM write bandwidth consumed in GB/s |
ccix_in_bw_MBps |
CCIX coherent-interconnect inbound bandwidth to the socket/system in MB/s |
ccix_out_bw_MBps |
CCIX coherent-interconnect outbound bandwidth from the socket/system in MB/s |
Refer to a detailed tuning guide here.
Conclusion
The APP enables PMU hardware event measurement to provide microarchitecture-level performance insight on Ampere CPUs. It is designed to answer the “why” behind performance problems by identifying microarchitectural causes such as inefficient instruction fetching and data cache misses, which are difficult to detect through application-level profiling alone.
The APP workflow is top-down and hypothesis-driven: Form a hypothesis from the hot function, measure with APP profiles, and then analyze using the APP HTML report with TDA sunburst charts to characterize where cycles are being spent (instruction retirement, front-end bound, back-end bound). APP is most valuable when system-level bottlenecks have been characterized or ruled out and microarchitecture-level explanation is required for expert tuning.
Check out the full Ampere article collection here.
Comments