AWS Managed Database Observability: Monitoring DynamoDB, ElastiCache, and Redshift Beyond CloudWatch
Three AWS managed databases, three dashboards, and one cascade you can only trace by hand. This guide fills the gap CloudWatch leaves open.
A DynamoDB throttle alarm fires at 2 am. You confirm the spike in CloudWatch, then check ElastiCache in a second dashboard, then Redshift in a third. Cache hit rate dropped, which hammered DynamoDB, which stalled the zero-ETL export. Three services, three dashboards, one cascade you can only trace by hand.
This guide maps the specific metrics, alarm thresholds, and configuration steps for each service, and then addresses the observability delta that CloudWatch leaves unresolved: cross-service correlation, root-cause traceability, and the capacity-planning intelligence that prevents cascades in the first place.
What CloudWatch Gives You Across DynamoDB, ElastiCache, and Redshift
Prerequisites: The CLI examples and alarm configurations in this guide assume AWS CLI v2, an IAM principal with cloudwatch:GetMetricData, cloudwatch:PutMetricAlarm, and dynamodb:UpdateContributorInsights permissions, and active DynamoDB tables, ElastiCache clusters, or Redshift clusters in your account.
CloudWatch publishes metrics for all three services under service-specific namespaces. Per the AWS CloudWatch documentation, metric retention runs in three tiers: 1-minute data points retained for 15 days, 5-minute data points for 63 days, and 1-hour data points for 455 days.
| Namespace | Category | Key Metrics |
|---|---|---|
| AWS/DynamoDB | Capacity | ConsumedReadCapacityUnits, ConsumedWriteCapacityUnits, ThrottledRequests |
| AWS/DynamoDB | Latency | SuccessfulRequestLatency (p50, p99) |
| AWS/DynamoDB | Health | SystemErrors |
| AWS/ElastiCache | Efficiency | CacheHitRate, Evictions |
| AWS/ElastiCache | Memory | DatabaseMemoryUsagePercentage |
| AWS/ElastiCache | Connections | CurrConnections, ReplicationLag |
| AWS/Redshift | Performance | QueryDuration, QueryQueueTime |
| AWS/Redshift | Workload | WLMQueueLength (per queue) |
| AWS/Redshift | Resources | CPUUtilization, ReadIOPS, WriteIOPS |
For most post-incident investigations, you’ll hit the granularity boundary within two weeks. A throttle spike that lasted 4 minutes on day 17 shows up as a single 5-minute average data point, frequently indistinguishable from normal traffic variation. The per-custom-metric cost also compounds at scale: an account running 40 DynamoDB tables, 6 ElastiCache clusters, and 3 Redshift clusters with per-resource custom alarms can accumulate hundreds of CloudWatch metrics across namespaces, each costing $0.30/month to store and $0.10/alarm/month to evaluate.
Each namespace provides enough signal to diagnose its own service, but CloudWatch publishes no native cross-service correlation mechanism. A ThrottledRequests spike in AWS/DynamoDB and a CacheHitRate collapse in AWS/ElastiCache at the same timestamp are both visible, but connecting them as cause and effect requires a human to match timestamps across dashboards.
DynamoDB: Throttling Detection, Partition Health, and Capacity Mode Decisions
DynamoDB throttling is rarely a single-metric problem. A throttle alarm tells you capacity was exceeded, but not whether the cause is a hot partition, an undersized provisioned table, or a traffic pattern that outgrew your capacity mode. The subsections below work through that diagnostic sequence: the metrics that surface the symptom, the tooling that pinpoints the partition, and the capacity decision that prevents recurrence.
Core Metrics and Alarm Thresholds
The DynamoDB CloudWatch metric namespace publishes table-level aggregates. For provisioned-capacity tables, these five metrics drive operational decisions:
| Metric | Unit | Recommended Alarm Threshold | Notes |
|---|---|---|---|
| ThrottledRequests | Count | > 0 (provisioned mode) | Any throttling on a provisioned table means capacity is misconfigured or a hot partition is concentrating load |
| SuccessfulRequestLatency p99 | Milliseconds | > 10ms (read-heavy workloads); > 20ms (mixed) | p99 > 10ms on reads is a practitioner-recommended leading indicator of partition pressure before throttles appear |
| ConsumedReadCapacityUnits | Count/second | > 80% of provisioned RCUs | Signals you’re approaching throttle territory |
| ConsumedWriteCapacityUnits | Count/second | > 80% of provisioned WCUs | Same logic for write-heavy workloads |
| SystemErrors | Count | > 0 | Indicates DynamoDB service-side failures, distinct from capacity limits |
Practitioner-recommended starting points. Tune to your workload characteristics.
ThrottledRequests at table level confirms that throttling happened, but tells you nothing about which partition caused it. On a table with millions of items, a single access pattern (a user ID acting as a partition key hot spot, for instance) can drive 95% of throttles while aggregate consumed capacity looks healthy. DynamoDB Contributor Insights resolves this.
Contributor Insights for Hot Partition Detection
DynamoDB Contributor Insights surfaces the top-N most-accessed partition keys and sort keys in real time. It identifies the specific items driving throttling or high latency that pure CloudWatch metric aggregation can’t surface. Enabling it on a production table with significant traffic incurs cost (priced per request evaluated), but during a throttle incident, Contributor Insights gives you the specific key value generating excess load rather than an aggregate curve.
Enable it from the DynamoDB console under the table’s “Monitor” tab, or via CLI (requires AWS CLI v2+):
aws dynamodb update-contributor-insights \
  --table-name YOUR_TABLE_NAME \
  --contributor-insights-action ENABLE
Once active, CloudWatch Logs Insights receives partition-level data within minutes. Query the top-10 most-accessed partition keys over the past hour to confirm whether a hot key is generating the throttle alarm:
filter @message like /ContributorInsights/
| stats count(*) as accessCount by partitionKey
| sort accessCount desc
| limit 10
Capacity Mode Decision Logic
The decision between provisioned and on-demand capacity modes depends on traffic predictability. Use a 7-day ConsumedCapacityUnits trend as your input signal:
- If consumed capacity stays below 80% of provisioned capacity and follows a consistent daily pattern, stay on provisioned. Set auto-scaling target utilization at 70% of provisioned capacity to leave headroom for traffic spikes before throttling begins.
- If consumed capacity regularly exceeds 80% of provisioned, or if usage patterns show irregular spikes with no predictable shape, on-demand mode eliminates throttling risk at a higher per-request cost.
Teams running the DynamoDB zero-ETL integration with Redshift (GA October 2024) face a different monitoring angle from streaming replication. The integration operates via periodic incremental exports every 15 to 30 minutes, so source table latency doesn’t affect export timing. The primary constraint on analytics data freshness is export completion status, visible in the Redshift console under the integration view. Export failures are the leading indicator of stale analytics data.
ElastiCache: Cache Efficiency, Memory Pressure, and the Valkey 8.0 Observability Upgrade
When cache hit rate drops, the blast radius extends beyond ElastiCache. Every cache miss becomes a direct read against your origin datastore, and if that origin is a DynamoDB table already running near provisioned capacity, you get the throttle cascade from the introduction. The metrics below separate cache-level symptoms from the memory and replication signals that predict them, followed by the observability improvements Valkey 8.0 brings.
Redis and Valkey Metrics
Per the ElastiCache CloudWatch documentation, the metrics that drive operational decisions for Redis and Valkey deployments are:
| Metric | Target | Alert Threshold | Action |
|---|---|---|---|
| CacheHitRate | >= 0.95 | < 0.90 | Investigate at < 0.90; below 0.80 indicates a significant access pattern change or deployment that altered cache key patterns |
| Evictions | ~0 (steady state) | > 100/min sustained | Sustained evictions mean maxmemory-policy is evicting live data under memory pressure |
| DatabaseMemoryUsagePercentage | < 70% | Alert at > 75%; scale-out at > 85% | Alert at 75% gives runway to analyze dataset growth; above 85% triggers automatic evictions under most policies |
| ReplicationLag | < 100ms | > 500ms | Replica lag at this level affects read scaling reliability |
| CurrConnections | Workload-specific | > 80% of max allowed | Persistent near-limit connections indicate a connection pool misconfiguration or application-side leak |
Practitioner-recommended starting points based on operational experience.
Memcached deployments within ElastiCache expose a different metric set through the same AWS/ElastiCache namespace: get_hits and get_misses (from which you derive hit rate), evictions, and bytes_used vs. limit_maxbytes. Valkey and Redis are cluster-based architectures with native replication, while Memcached is a horizontally partitioned cache with no native replication. Applying Redis/Valkey thresholds to Memcached deployments produces misleading alarms.
Valkey 8.0 Observability Additions
The open-source Valkey 8.0 release shipped from the Linux Foundation on September 16, 2024. Amazon ElastiCache 8.0 for Valkey launched on November 21, 2024, bringing four observability primitives that prior Redis OSS metrics on ElastiCache didn’t expose.
Per-slot metrics let you identify which hash slots carry disproportionate traffic across a cluster. Before Valkey 8.0, CloudWatch surfaced per-node and per-cluster aggregates only. A slot-level throughput imbalance (common after a key pattern change in the application layer) was invisible until it produced node-level CPU or memory pressure. With per-slot metrics, you detect the asymmetry before it cascades to node-level saturation.
Per-client event loop latency tracks how long each client connection waits in the event loop queue. This directly diagnoses client-specific throughput asymmetries. If one application service has a misconfigured connection pool producing tail latency that appears as a CacheHitRate degradation from another service’s perspective, per-client event loop latency identifies the offending client specifically rather than surfacing a cluster-level aggregate that implicates everything.
Rehash memory tracking quantifies the temporary memory overhead during cluster rescaling. When you add nodes to an ElastiCache Valkey cluster, the rehashing process requires holding two copies of some hash-slot data in memory simultaneously. Before this metric, a DatabaseMemoryUsagePercentage spike during a scale-out event was ambiguous. With rehash memory tracking, you can confirm the spike is transient rehash overhead and dismiss the alarm as expected behavior rather than a capacity problem.
Traffic breakdowns split read, write, and key expiry operations at the slot and node level. This replaces the single-dimensional throughput view that prior ElastiCache Redis metrics provided and enables you to identify whether a throughput increase is driven by reads, writes, or expiry churn without writing custom instrumentation.
Valkey 8.1, released April 2, 2025, adds further observability improvements. Verify ElastiCache 8.1 availability in your region at the time of deployment, as managed service version availability can trail the open-source release by several weeks.
Redshift: Query Performance, WLM Configuration, and Enhanced Monitoring
Redshift performance problems tend to look identical from the outside: queries slow down. Whether the cause is CPU saturation, WLM slot exhaustion, or a bad query plan requires different metrics and different responses. The thresholds below separate those conditions, followed by the Enhanced Query Monitoring tooling that replaced the manual system-table workflow for root-cause diagnosis.
Key CloudWatch Metrics and WLM Thresholds
| Metric | Recommended Threshold | Action |
|---|---|---|
CPUUtilization |
Alert at > 80% | Investigate active query plans if sustained; evaluate concurrency scaling if combined with queue depth |
| WLMQueueLength (per queue) | Alert at > 3; escalate at > 5 sustained for 60 seconds | WLMQueueLength > 5 sustained over 60 seconds combined with CPUUtilization > 85% is a practitioner-recommended trigger for enabling a Redshift concurrency scaling cluster |
QueryQueueTime |
> 30 seconds | Queries waiting over 30 seconds indicate WLM queue saturation or slot misconfiguration |
QueryDuration |
2x the 7-day p95 baseline for that WLM queue | Baseline drift detection for workload-specific thresholds |
ReadIOPS |
Cluster baseline | Sharp ReadIOPS spikes without a corresponding query load increase can indicate full-table scans or missing sort key filters |
The WLMQueueLength threshold requires context to interpret correctly. A WLMQueueLength of 5 on a queue allocated 5 concurrency slots means every slot is occupied and the queue is at capacity. Combined with CPUUtilization above 85%, adding concurrency scaling capacity is the right response. WLMQueueLength of 5 with CPUUtilization at 40% points to a slot allocation problem: queries are queuing behind slot limits rather than behind compute saturation, and the fix is WLM reconfiguration, not additional nodes.
Historically, diagnosing slow Redshift queries required direct access to system tables. A typical workflow queried STL_QUERY for execution times, joined to SVL_QUERY_METRICS for resource usage per execution step, and cross-referenced SVL_QUERY_SUMMARY for operator-level plan details. This three-step workflow required SQL client access, familiarity with the Redshift internal catalog schema, and significant manual correlation work.
Redshift Enhanced Query Monitoring
Redshift Enhanced Query Monitoring went GA on January 29, 2025, available for both Serverless and provisioned deployments. It surfaces query bottlenecks, execution plan anomalies, and resource contention at the query level through the Redshift console, removing the need for SQL-level diagnostic work against system tables.
When WLMQueueLength spikes, you can go directly to a ranked list of the queries causing saturation, see their execution plan highlights, and identify whether the bottleneck is a sort key miss, a cross-join, or a network shuffle between nodes, all without writing a single STL_QUERY lookup. Redshift troubleshooting previously required a senior engineer with DBA-level knowledge of the system catalog. This change shifts basic performance diagnosis to any SRE comfortable with the console.
AI-Driven Scaling and Its Monitoring Implications
AWS previewed Redshift Serverless AI-driven scaling at re:Invent 2023, and it went GA in October 2024. Verify current GA status in the AWS documentation for your region before production adoption, as the preview-to-GA timeline varies by feature and region.
AI-driven scaling automates RPU (Redshift Processing Unit) allocation by observing query patterns over time and adjusting base and max RPU settings to balance cost against performance. WLM queue priority, query monitoring rule configuration, and workload classification for mixed BI and ETL environments require manual configuration even on Serverless clusters running AI-driven scaling. A Redshift Serverless cluster with AI-driven scaling still requires you to define how ETL jobs and ad hoc analyst queries share resources, and which queue takes priority when both arrive simultaneously. Those decisions drive WLMQueueLength behavior regardless of how accurately the scaler provisions RPUs.
Capacity Planning: Using Monitoring Data to Drive Scaling and Cost Decisions
The cross-service capacity heuristic worth building into your runbooks: simultaneous DynamoDB p99 latency increase combined with ElastiCache CacheHitRate dropping below 0.90 can indicate several different conditions. Potential causes include a fan-out query change at the application layer, a cache node failure, a network event between services, or a deployment that altered cache key patterns. This symptom combination warrants application-layer investigation to confirm the root cause before deciding which service to scale. Scaling either service without confirming the shared trigger wastes capacity and can mask the actual issue.
DynamoDB
Build a 7-day ConsumedCapacityUnits average as your baseline, then set auto-scaling target utilization at 70% of provisioned capacity. This gives your table headroom to absorb a 30% traffic increase before auto-scaling triggers, with a further buffer before you hit throttles at 100% consumed capacity.
When evaluating reserved capacity, AWS Cost Explorer surfaces DynamoDB reserved capacity recommendations with projected savings. At a 3-year term commitment, reserved capacity can save up to 77% versus provisioned capacity hourly rates. Reserved capacity makes financial sense for tables that have run in provisioned mode for at least 90 days with predictable consumption patterns. For tables with volatile or seasonal traffic, on-demand mode avoids the risk of underutilization that makes reserved capacity economically counterproductive.
ElastiCache
Trend DatabaseMemoryUsagePercentage over a 72-hour window. If it trends upward at a rate disconnected from traffic growth (the cache dataset is growing while the request rate stays flat), that signals cache dataset expansion rather than increased load. The operational response is node scaling before you cross the 75% alert threshold, as memory pressure at that level narrows your runway to eviction-level problems.
For ElastiCache Serverless using Valkey, monitor ElastiCacheProcessingUnits (ECPUs) as the scaling proxy. ECPU consumption scales with operation complexity and data volume, making it the primary cost and capacity signal for Serverless deployments where node count decisions don’t apply.
Redshift
Correlate CPUUtilization with QueryQueueTime over a 1-week window. The CPU-vs-queue diagnostic from the Redshift metrics section applies here as your scaling decision input: high CPU points to node scaling, while high queue time with moderate CPU points to WLM slot reconfiguration.
Where CloudWatch’s Coverage Falls Short
The per-service metrics and tooling above give you solid visibility within each namespace. The gaps show up when you need to work across them: correlating alarms from different services, connecting logs to metrics, and suppressing the noise when a single event triggers alerts everywhere at once.
No Native Cross-Service Correlation
You can build a CloudWatch dashboard that co-locates DynamoDB ThrottledRequests, ElastiCache Evictions, and Redshift WLMQueueLength on a shared timeline, but it’s manual widget assembly with no causal linking between the graphs. The assembly is also fragile: every new table, cluster, or queue requires manual dashboard updates to keep the view current.
Log-to-Metric Correlation Is Manual
Connecting a slow Redshift query logged in STL_QUERY to a spike in DynamoDB SuccessfulRequestLatency at the same timestamp requires opening CloudWatch Logs Insights for Redshift audit logs, querying by timestamp range, then manually comparing results against the DynamoDB metric timeline. The Enhanced Query Monitoring GA from January 2025 reduces this friction for Redshift-internal diagnosis, but the cross-service correlation step remains a human task.
Cross-Account Visibility
CloudWatch Database Insights added cross-account and cross-region support for database fleet monitoring on November 21, 2025. Verify the current scope of service coverage at the time of your deployment, as the announcement references database fleet monitoring broadly, and the specific inclusion of ElastiCache and Redshift alongside RDS and Aurora should be confirmed against current documentation.
Alert Fatigue Across Three Namespaces
Each service generates its own alarm stream with no dependency-aware suppression between services. When a single network event causes DynamoDB latency to rise, ElastiCache hit rate to drop, and Redshift WLM queue depth to increase, CloudWatch fires alarms across three separate notification channels simultaneously. The on-call engineer receives three alerts for a single root cause event, with no automated path from any alarm to the triggering condition.
ManageEngine OpManager Nexus addresses these gaps directly: it auto-discovers DynamoDB tables, ElastiCache clusters, and Redshift clusters within your AWS account, builds correlated dashboards that connect metrics across all three services on a shared timeline without manual widget assembly, and applies dependency-aware alarm suppression that treats downstream symptoms of a single event as a grouped incident. For teams running two or more of these managed database services, the operational delta between nine isolated CloudWatch alarms and a correlated, root-cause-linked view determines where monitoring hours get spent or recovered.
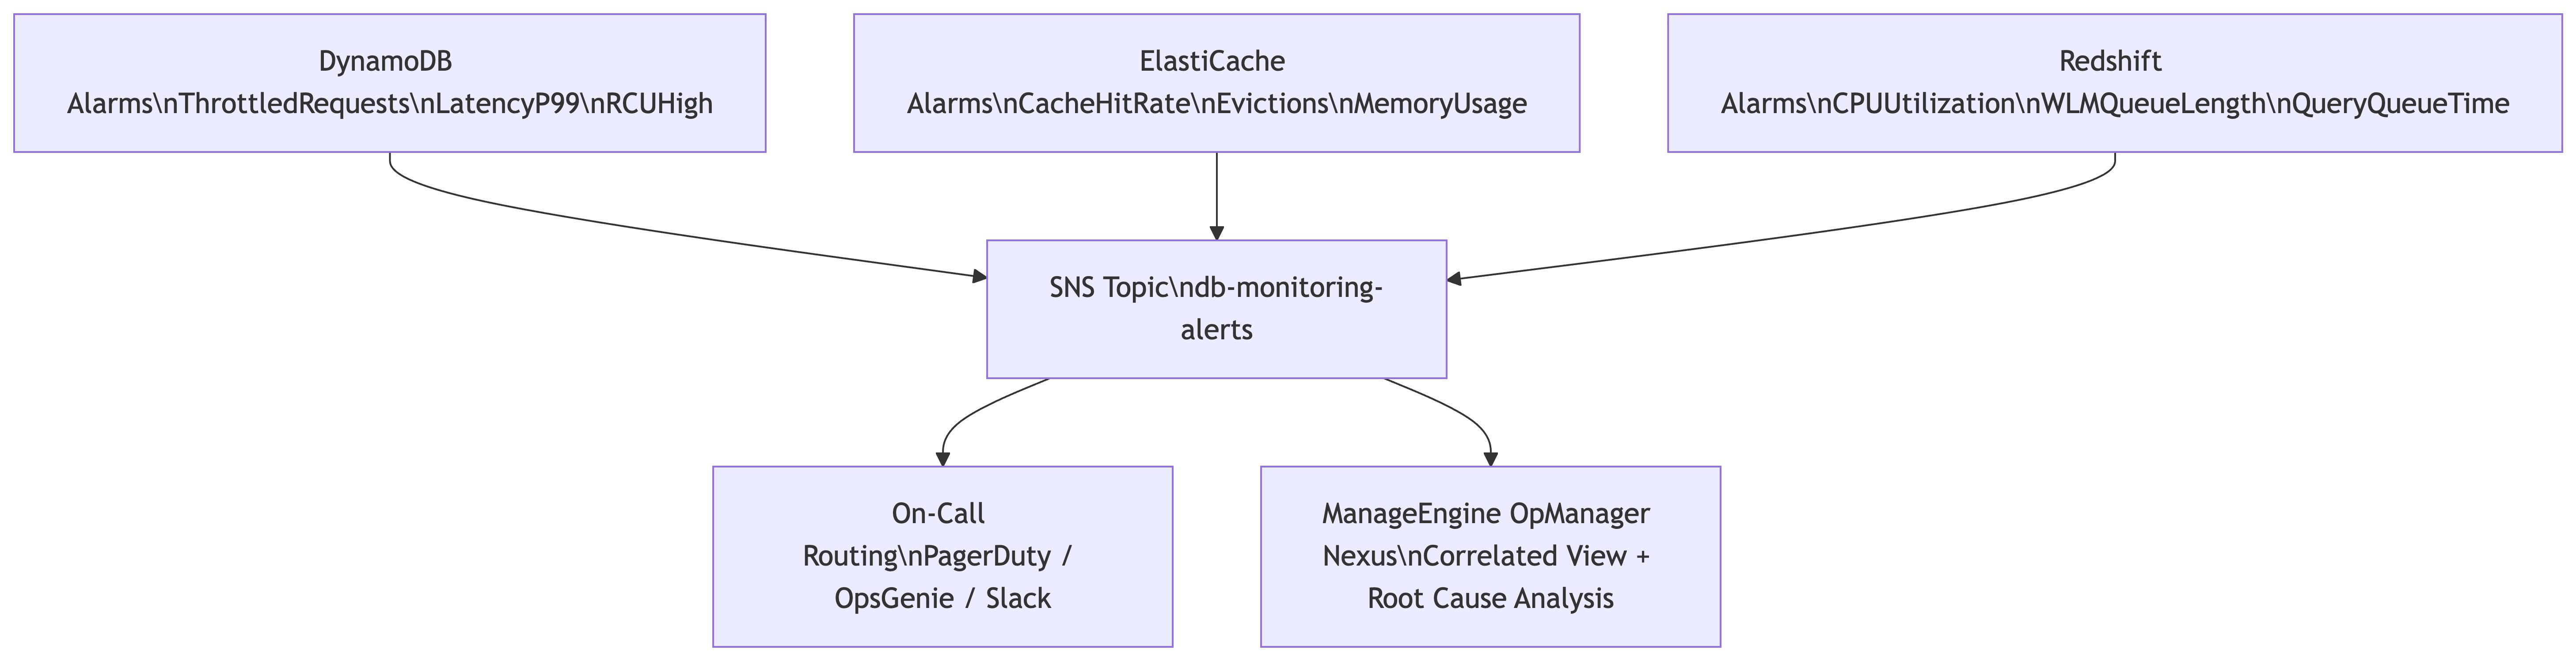
Your Monitoring Baseline: Nine Alarms and a Unified View
The minimum viable monitoring baseline for all three services is nine CloudWatch alarms routed to a single SNS topic. These are practitioner-recommended starting points. Tune each threshold to your observed workload behavior.
DynamoDB Alarms
| Alarm Name | Metric | Threshold | Evaluation Period |
|---|---|---|---|
| DynamoDB-Throttles | ThrottledRequests | > 0 | 1 minute |
| DynamoDB-LatencyP99 | SuccessfulRequestLatency (p99) | > 20ms | 5 minutes |
| DynamoDB-RCUHigh | ConsumedReadCapacityUnits | > 80% of provisioned | 5 minutes |
Metric definitions: DynamoDB CloudWatch metrics reference.
ElastiCache Alarms
| Alarm Name | Metric | Threshold | Evaluation Period |
|---|---|---|---|
| Cache-HitRateLow | CacheHitRate | < 0.90 | 5 minutes |
| Cache-EvictionsHigh | Evictions | > 100 per minute | 1 minute |
| Cache-MemoryHigh | DatabaseMemoryUsagePercentage | > 75% | 5 minutes |
Metric definitions: ElastiCache CloudWatch metrics reference.
Redshift Alarms
| Alarm Name | Metric | Threshold | Evaluation Period |
|---|---|---|---|
| Redshift-CPUHigh | CPUUtilization | > 80% | 5 minutes |
| Redshift-QueueDepth | WLMQueueLength | > 3 | 5 minutes |
| Redshift-QueueWait | QueryQueueTime | > 30 seconds | 5 minutes |
Metric definitions: Redshift CloudWatch metrics reference.
Route all nine alarms to a single SNS topic. Tag each alarm with a Service dimension (values: DynamoDB, ElastiCache, Redshift) so your incident management tooling can filter and group by service. This configuration puts all three alarm streams in one place and makes it detectable when multiple service alarms fire within a short time window, which is the observable signature of a cross-service cascade.
Run these nine alarms for a week or two. You’ll see the pattern: multiple alarms firing within the same minute window for what turns out to be a single root cause, with no automated way to connect them. That delta is what a correlated observability layer closes. ManageEngine OpManager Nexus provides that layer for AWS database services, with auto-discovery, cross-service dashboards, and dependency-aware alarm suppression out of the box.
What’s your current setup for correlating alarms across managed AWS services? If you’re running DynamoDB, ElastiCache, or Redshift and have found thresholds or approaches that work well for your team, share them in the comments.
Comments