

How to Build a Brand Monitoring Dashboard With SerpApi and Python
Track your brand across Google News, YouTube, and online discussions in a single Python dashboard with data from SerpApi.
Knowing what people say about your product usually means checking Google News, scrolling through YouTube, and digging into different social media threads. That's three tabs, three interfaces, and no way to compare what you find. This tutorial builds a single dashboard that pulls brand mentions from all three sources using Python and SerpApi.
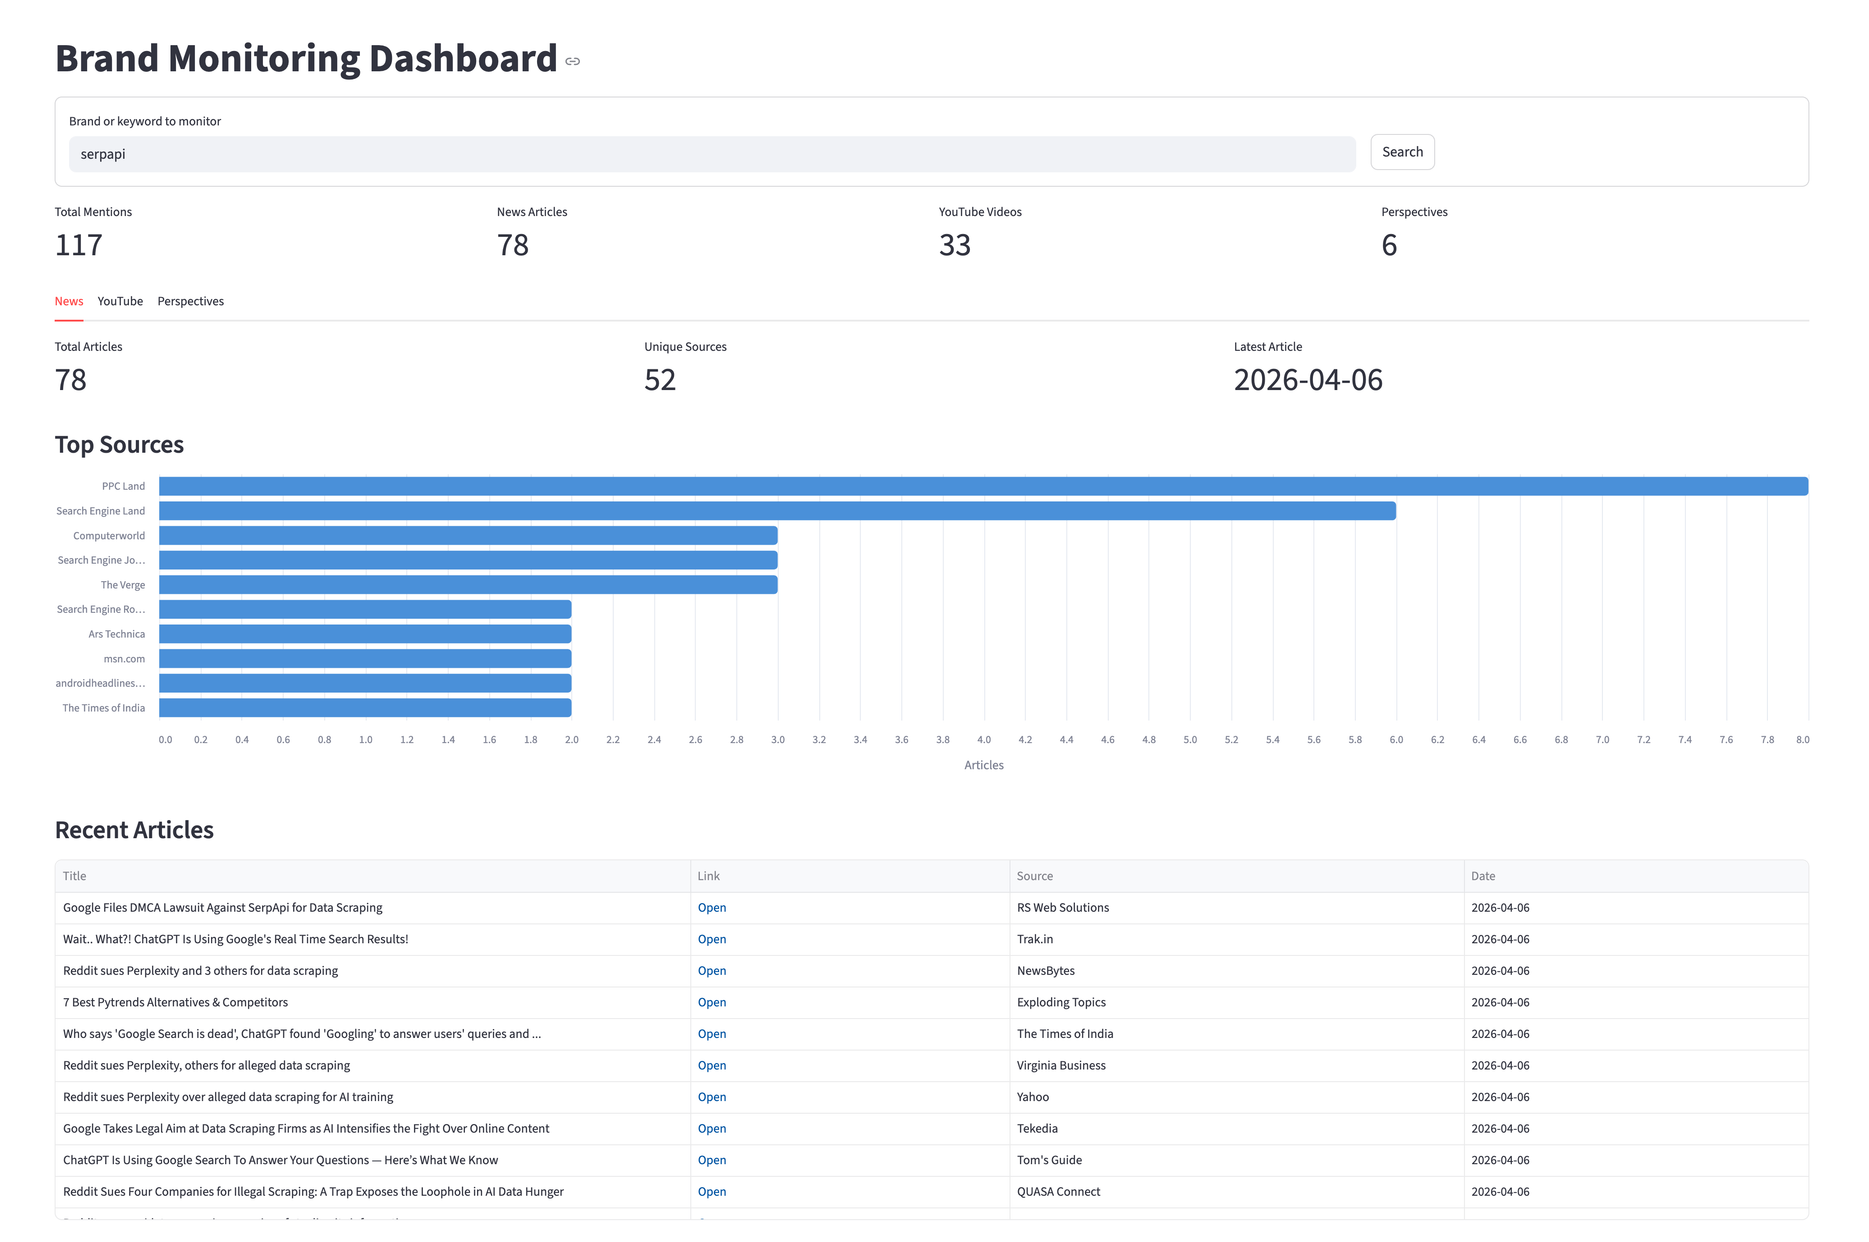
By the end, you'll have a Streamlit app with three tabs, one for news articles, one for YouTube videos, and one for social media and forum discussions. We'll use "serpapi" as the search query, but you can swap the brand or product name.
Set Up Your Environment
Requirements:
- Python 3.8+
- SerpApi API Key (the free plan includes 250+ searches/month)
- Dependencies (
serpapi,pandas,streamlit,altair)
The serpapi package is the official Python SDK. It handles request signing, retries, and response parsing.
The complete code, including a Jupyter notebook version, is available in the SerpApi tutorials repository.
The Pipeline
The app follows the same three-step pattern from the GitHub Issues dashboard: fetch raw data, transform it, and display the analysis.
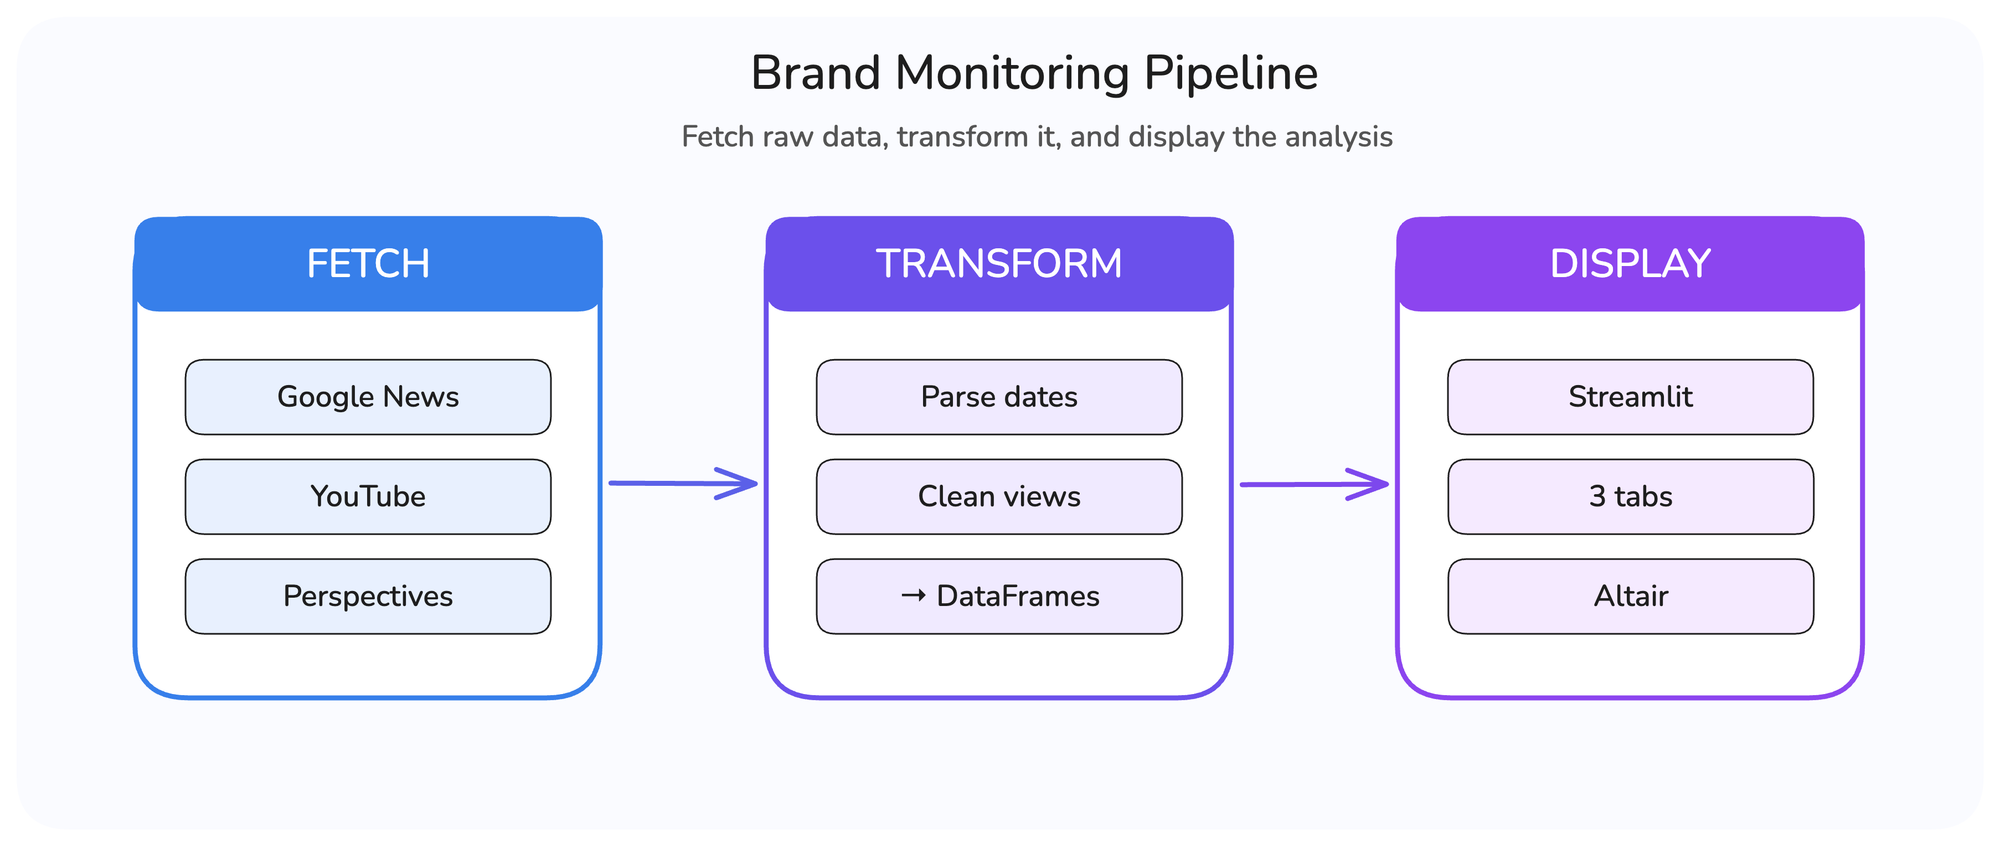
The difference this time is three separate engines running in parallel. Each returns a different response structure, so the transform step normalizes everything into DataFrames before the dashboard consumes it.
Fetch the Data
A single SerpApi client instance works for all three engines:
import serpapi
import os

SERPAPI_KEY = os.environ.get("SERPAPI_KEY", "")
client = serpapi.Client(api_key=SERPAPI_KEY)
Google News
The Google News API returns articles through the news_results key. Each result includes title, link, source (a dict with name and icon), date, and snippet.
def fetch_news(client, brand):
    """Fetch news articles mentioning the brand via Google News."""
    results = client.search({
        "engine": "google_news",
        "q": brand,
        "gl": "us",
        "hl": "en",
    })
    return results.get("news_results", [])
For more use cases with this engine, refer to the news monitoring.
YouTube
The YouTube Search API uses search_query instead of q, and the sp parameter controls time filters. The values EgIIAw%3D%3D (this week) and EgIIBA%3D%3D (this month) are YouTube's internal encoding for upload date filters. You can grab these from YouTube's URL bar after applying a filter manually.
We run both filters and deduplicate by link, since the month results include everything from the week:
YT_FILTER_WEEK = "EgIIAw%3D%3D"
YT_FILTER_MONTH = "EgIIBA%3D%3D"

def fetch_youtube(client, brand):
    """Fetch YouTube videos, combining week and month filters."""
    seen = set()
    videos = []

    for sp_filter in (YT_FILTER_WEEK, YT_FILTER_MONTH):
        results = client.search({
            "engine": "youtube",
            "search_query": brand,
            "sp": sp_filter,
        })
        for video in results.get("video_results", []):
            link = video.get("link", "")
            if link and link not in seen:
                seen.add(link)
                videos.append(video)

    return videos
For more examples using the YouTube API, refer to this link.
Google Perspectives
Google Perspectives API surfaces user-generated content from LinkedIn, Reddit, Quora, and blogs. It uses the standard Google engine, and the results appear under the perspectives key:
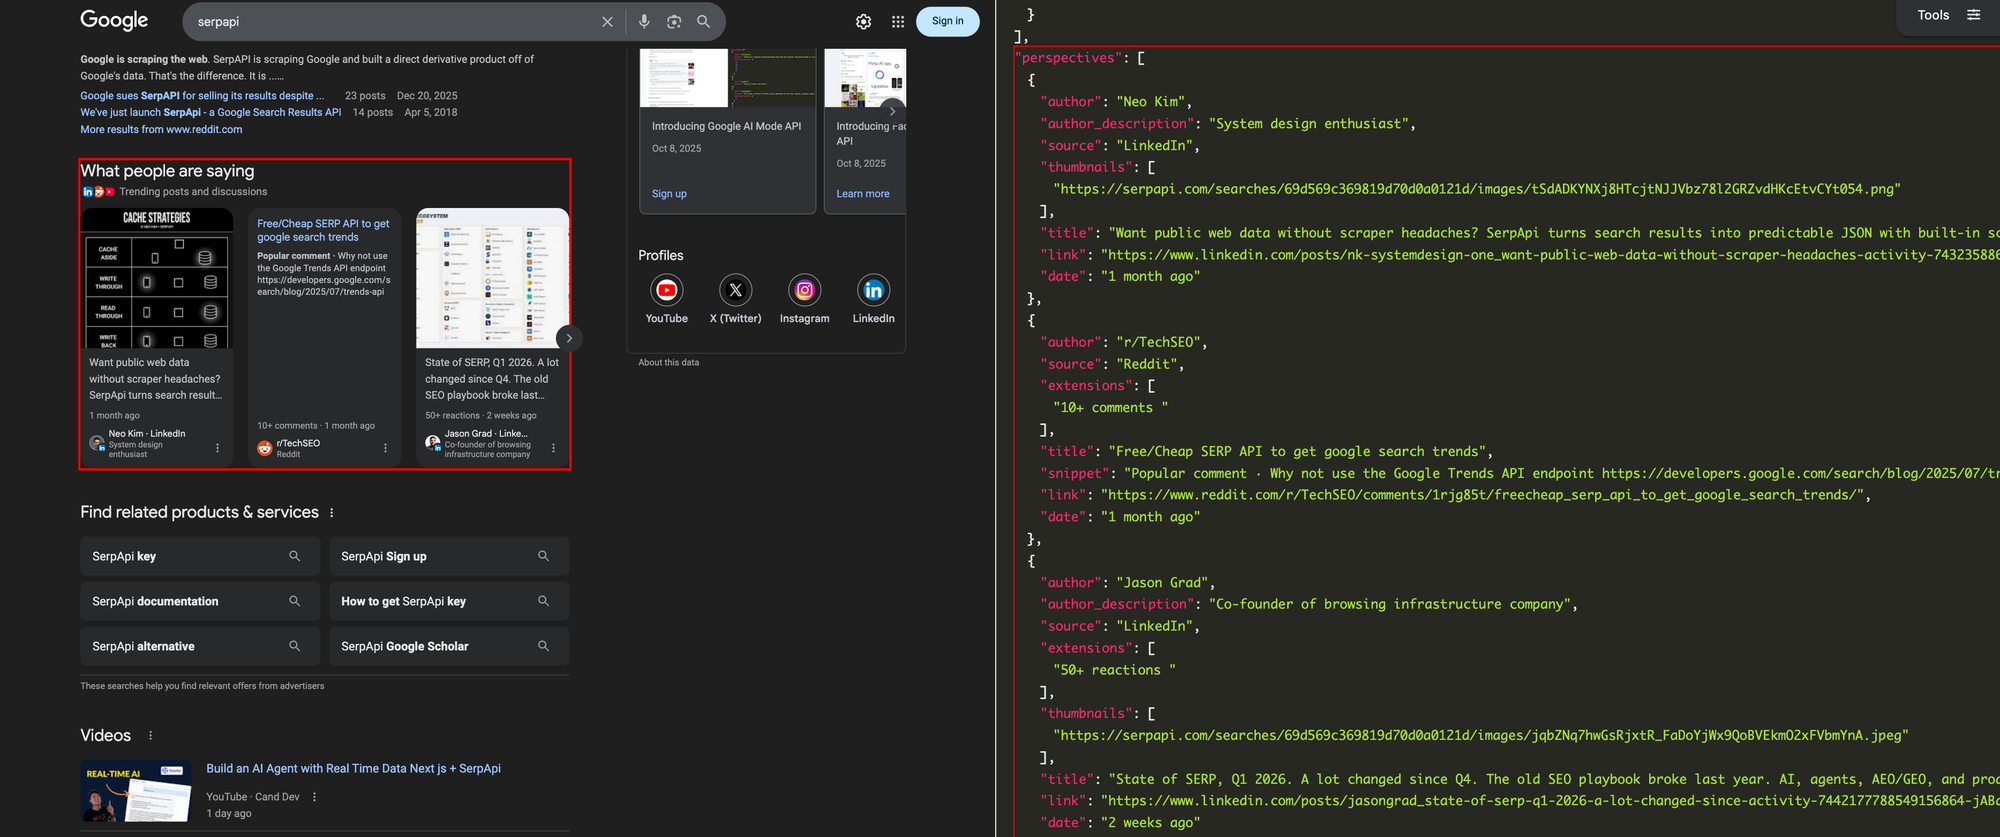
def fetch_perspectives(client, brand):
    """Fetch user-generated content (Reddit, LinkedIn, Quora)."""
    results = client.search({
        "engine": "google",
        "q": brand,
        "google_domain": "google.com",
    })
    return results.get("perspectives", [])
Fetch in Parallel
Three sequential API calls take roughly three seconds. Running them in parallel with Python ThreadPoolExecutor brings that down to about one second. Each call runs in its own thread while the others wait for their response:
from concurrent.futures import ThreadPoolExecutor

@st.cache_data(ttl=300)
def fetch_all_mentions(brand):
    """Fetch all brand mentions from three engines in parallel."""
    client = serpapi.Client(api_key=SERPAPI_KEY)

    with ThreadPoolExecutor(max_workers=3) as pool:
        news_future = pool.submit(fetch_news, client, brand)
        yt_future = pool.submit(fetch_youtube, client, brand)
        persp_future = pool.submit(fetch_perspectives, client, brand)
        return news_future.result(), yt_future.result(), persp_future.result()
SerpApi also offers a server-side async parameter for large-scale batch processing, where you submit searches and retrieve results later. For our three concurrent calls, client-side threading is simpler and equally effective.
The @st.cache_data(ttl=300) decorator caches results for 5 minutes. Without it, every Streamlit interaction would re-trigger the API calls. This works alongside SerpApi's own 1-hour result cache, which serves identical queries from the cache at no extra search cost unless you explicitly pass no_cache=true. Together, these two layers minimize redundant API calls during development and testing.
For more optimization techniques when working with SerpApi at scale, refer to this blog.
Transform the Data
All three engines return dates as relative strings ("3 hours ago", "2 days ago"). We need a shared parser to convert them into datetime objects for sorting.
Parse Relative Dates
Two details worth noting. The regex is compiled once and reused since this function runs for every result in all three engines. And the fallback returns datetime.now(timezone.utc) instead of None, so results without a parseable date sort to the top rather than breaking pandas operations.
import re
from datetime import datetime, timedelta, timezone

RELATIVE_DATE_RE = re.compile(
    r"(\d+)\s+(second|minute|hour|day|week|month|year)s?\s+ago", re.IGNORECASE
)

UNIT_TO_TIMEDELTA = {
    "second": lambda n: timedelta(seconds=n),
    "minute": lambda n: timedelta(minutes=n),
    "hour":   lambda n: timedelta(hours=n),
    "day":    lambda n: timedelta(days=n),
    "week":   lambda n: timedelta(weeks=n),
    "month":  lambda n: timedelta(days=n * 30),
    "year":   lambda n: timedelta(days=n * 365),
}

def parse_relative_date(text):
    """Convert '3 hours ago' into a datetime object."""
    if not text:
        return datetime.now(timezone.utc)

    match = RELATIVE_DATE_RE.search(str(text))
    if not match:
        return datetime.now(timezone.utc)

    amount = int(match.group(1))
    unit = match.group(2).lower()
    delta = UNIT_TO_TIMEDELTA.get(unit, lambda n: timedelta())(amount)
    return datetime.now(timezone.utc) - delta
Build DataFrames
Each engine gets into its own transformer. Here's the news version:
def transform_news(results):
    """Convert raw Google News results into structured records."""
    records = []
    for item in results:
        source = item.get("source") or {}
        source_name = source.get("name", "Unknown") if isinstance(source, dict) else str(source)

        records.append({
            "title": item.get("title", ""),
            "link": item.get("link", ""),
            "source": source_name,
            "date": parse_relative_date(item.get("date", "")),
            "snippet": item.get("snippet", ""),
        })
    return records
The source field can be a dict or a plain string depending on the result, so the isinstace check handles both. YouTube and Perspectives follow the same pattern, with two differences worth highlighting.
YouTube views come back as strings like "1,234 views", so we strip non-numeric characters before converting:
views = item.get("views") or 0
if isinstance(views, str):
    views = int(re.sub(r"[^\d]", "", views) or 0)
Build the Dashboard
The Streamlit interface starts with a form for the brand query and a row of summary metrics across all three sources:
st.set_page_config(page_title="Brand Monitoring Dashboard", layout="wide")
st.title("Brand Monitoring Dashboard")

with st.form("brand_form"):
    brand = st.text_input("Brand or keyword to monitor", value="serpapi")
    submitted = st.form_submit_button("Search")
col1, col2, col3, col4 = st.columns(4)
col1.metric("Total Mentions", total_mentions)
col2.metric("News Articles", len(news_records))
col3.metric("YouTube Videos", len(yt_records))
col4.metric("Perspectives", len(persp_records))
News Tab
The News tab pairs an Altair bar chart of top sources with a sortable table. Altair ships with Streamlit, so there's nothing extra to install. We use it instead of st.bar_chart because it gives control over orientation, tooltips, and styling.
source_df = news_df["source"].value_counts().head(10).reset_index()
source_df.columns = ["source", "count"]

source_chart = alt.Chart(source_df).mark_bar(
    cornerRadiusTopRight=4, cornerRadiusBottomRight=4
).encode(
    x=alt.X("count:Q", title="Articles"),
    y=alt.Y("source:N", sort="-x", title=""),
    color=alt.value("#4A90D9"),
    tooltip=["source:N", "count:Q"],
).properties(height=350)
st.altair_chart(source_chart, use_container_width=True)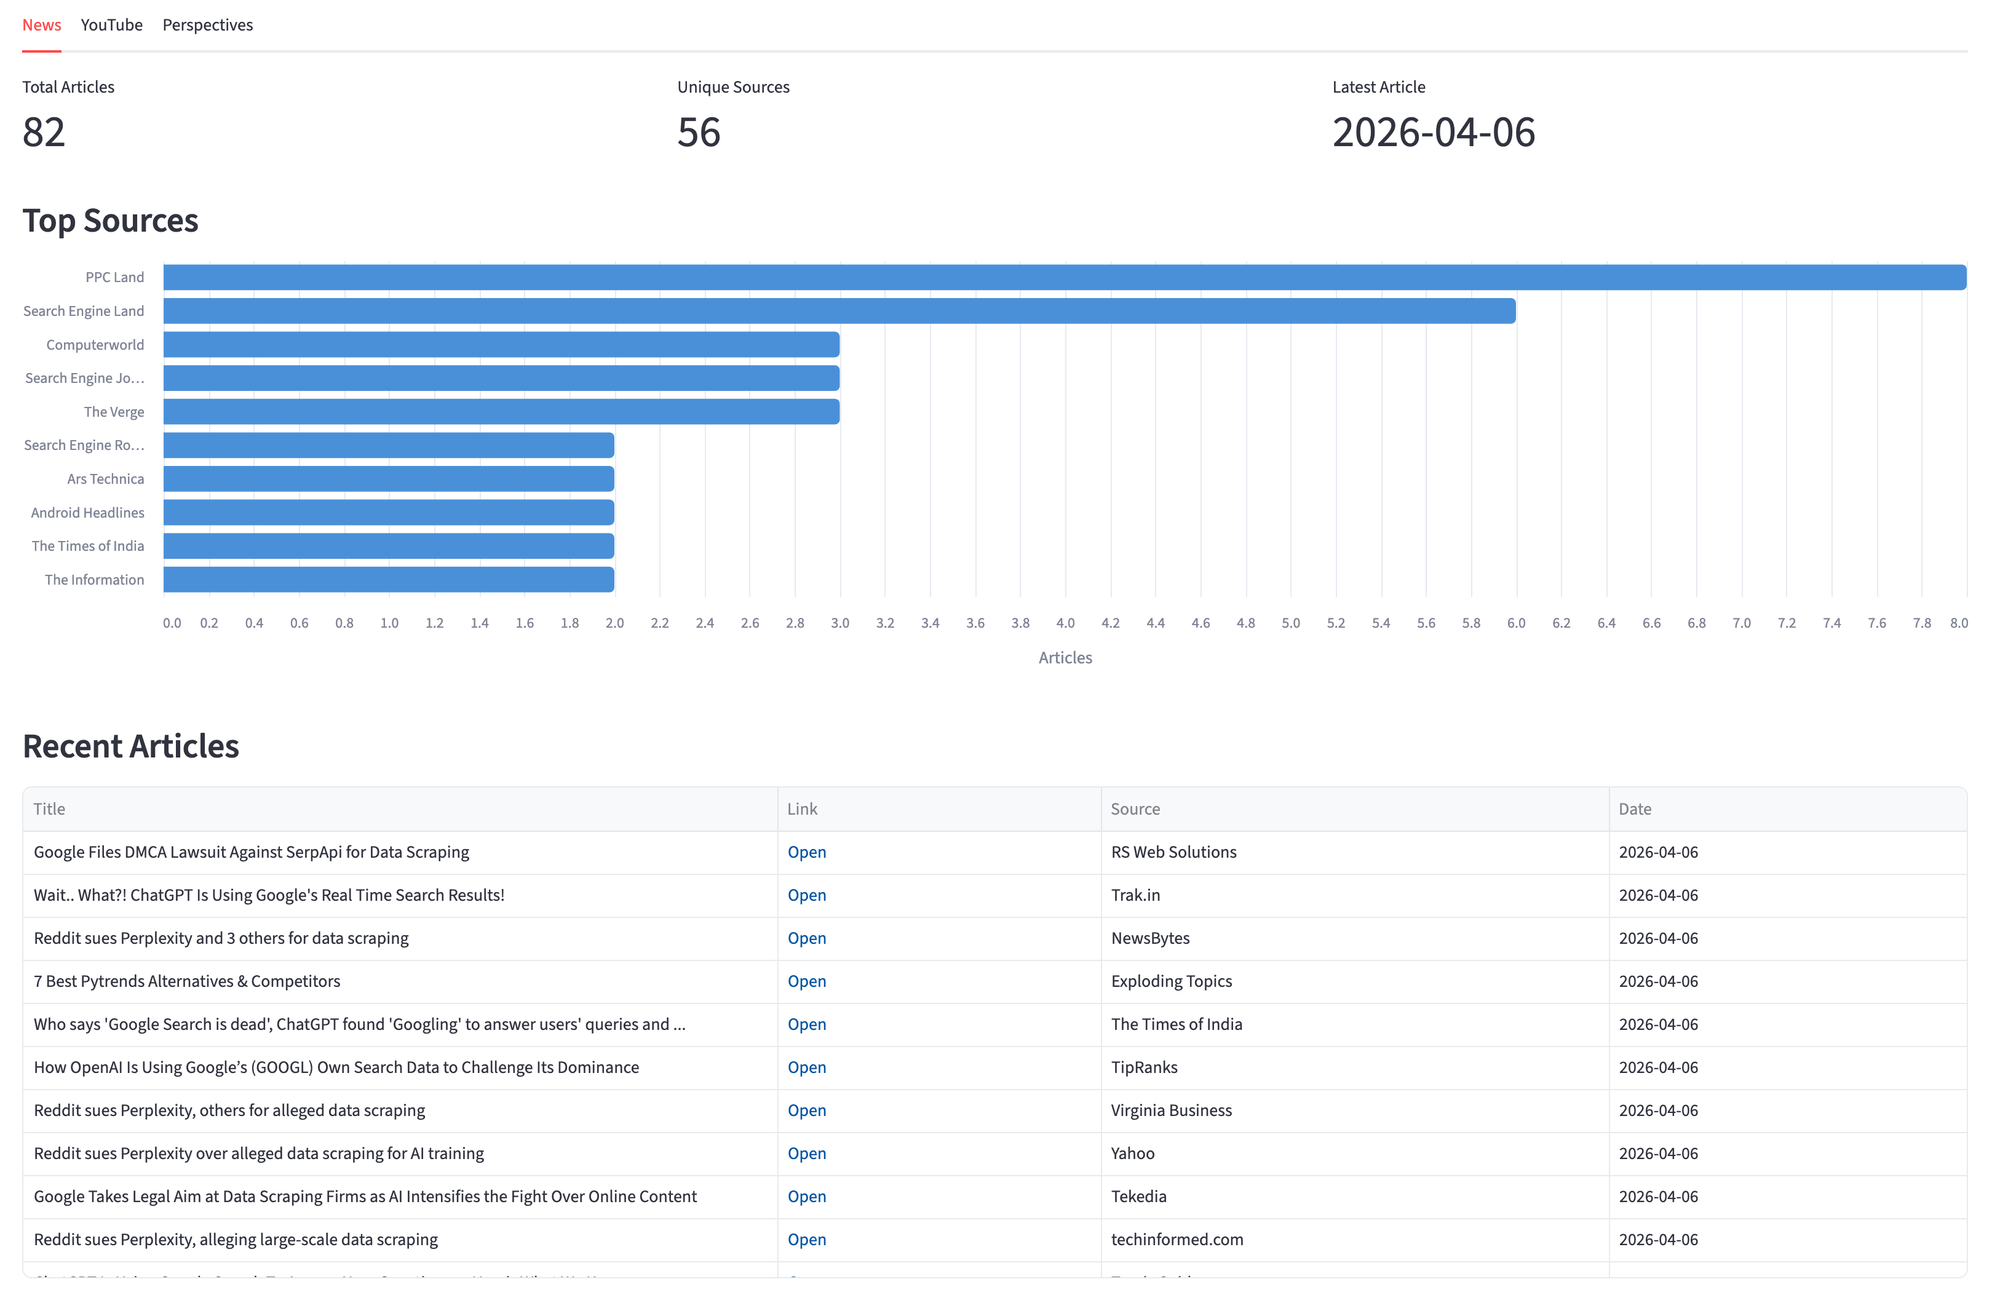
st.column_config.LinkColumn so each article title links directly to its source.
YouTube Tab
The YouTube tab shows views by channel and a sorted video table. The chart groups views by channel to surface which creators talk about the brand the most.
channel_df = yt_df.groupby("channel")["views"].sum().reset_index()
channel_df = channel_df.sort_values("views", ascending=False).head(10)

channel_chart = alt.Chart(channel_df).mark_bar(
    cornerRadiusTopRight=4, cornerRadiusBottomRight=4
).encode(
    x=alt.X("views:Q", title="Views", axis=alt.Axis(format="~s")),
    y=alt.Y("channel:N", sort="-x", title=""),
    color=alt.value("#4A90D9"),
    tooltip=["channel:N", alt.Tooltip("views:Q", format=",")],
).properties(height=350)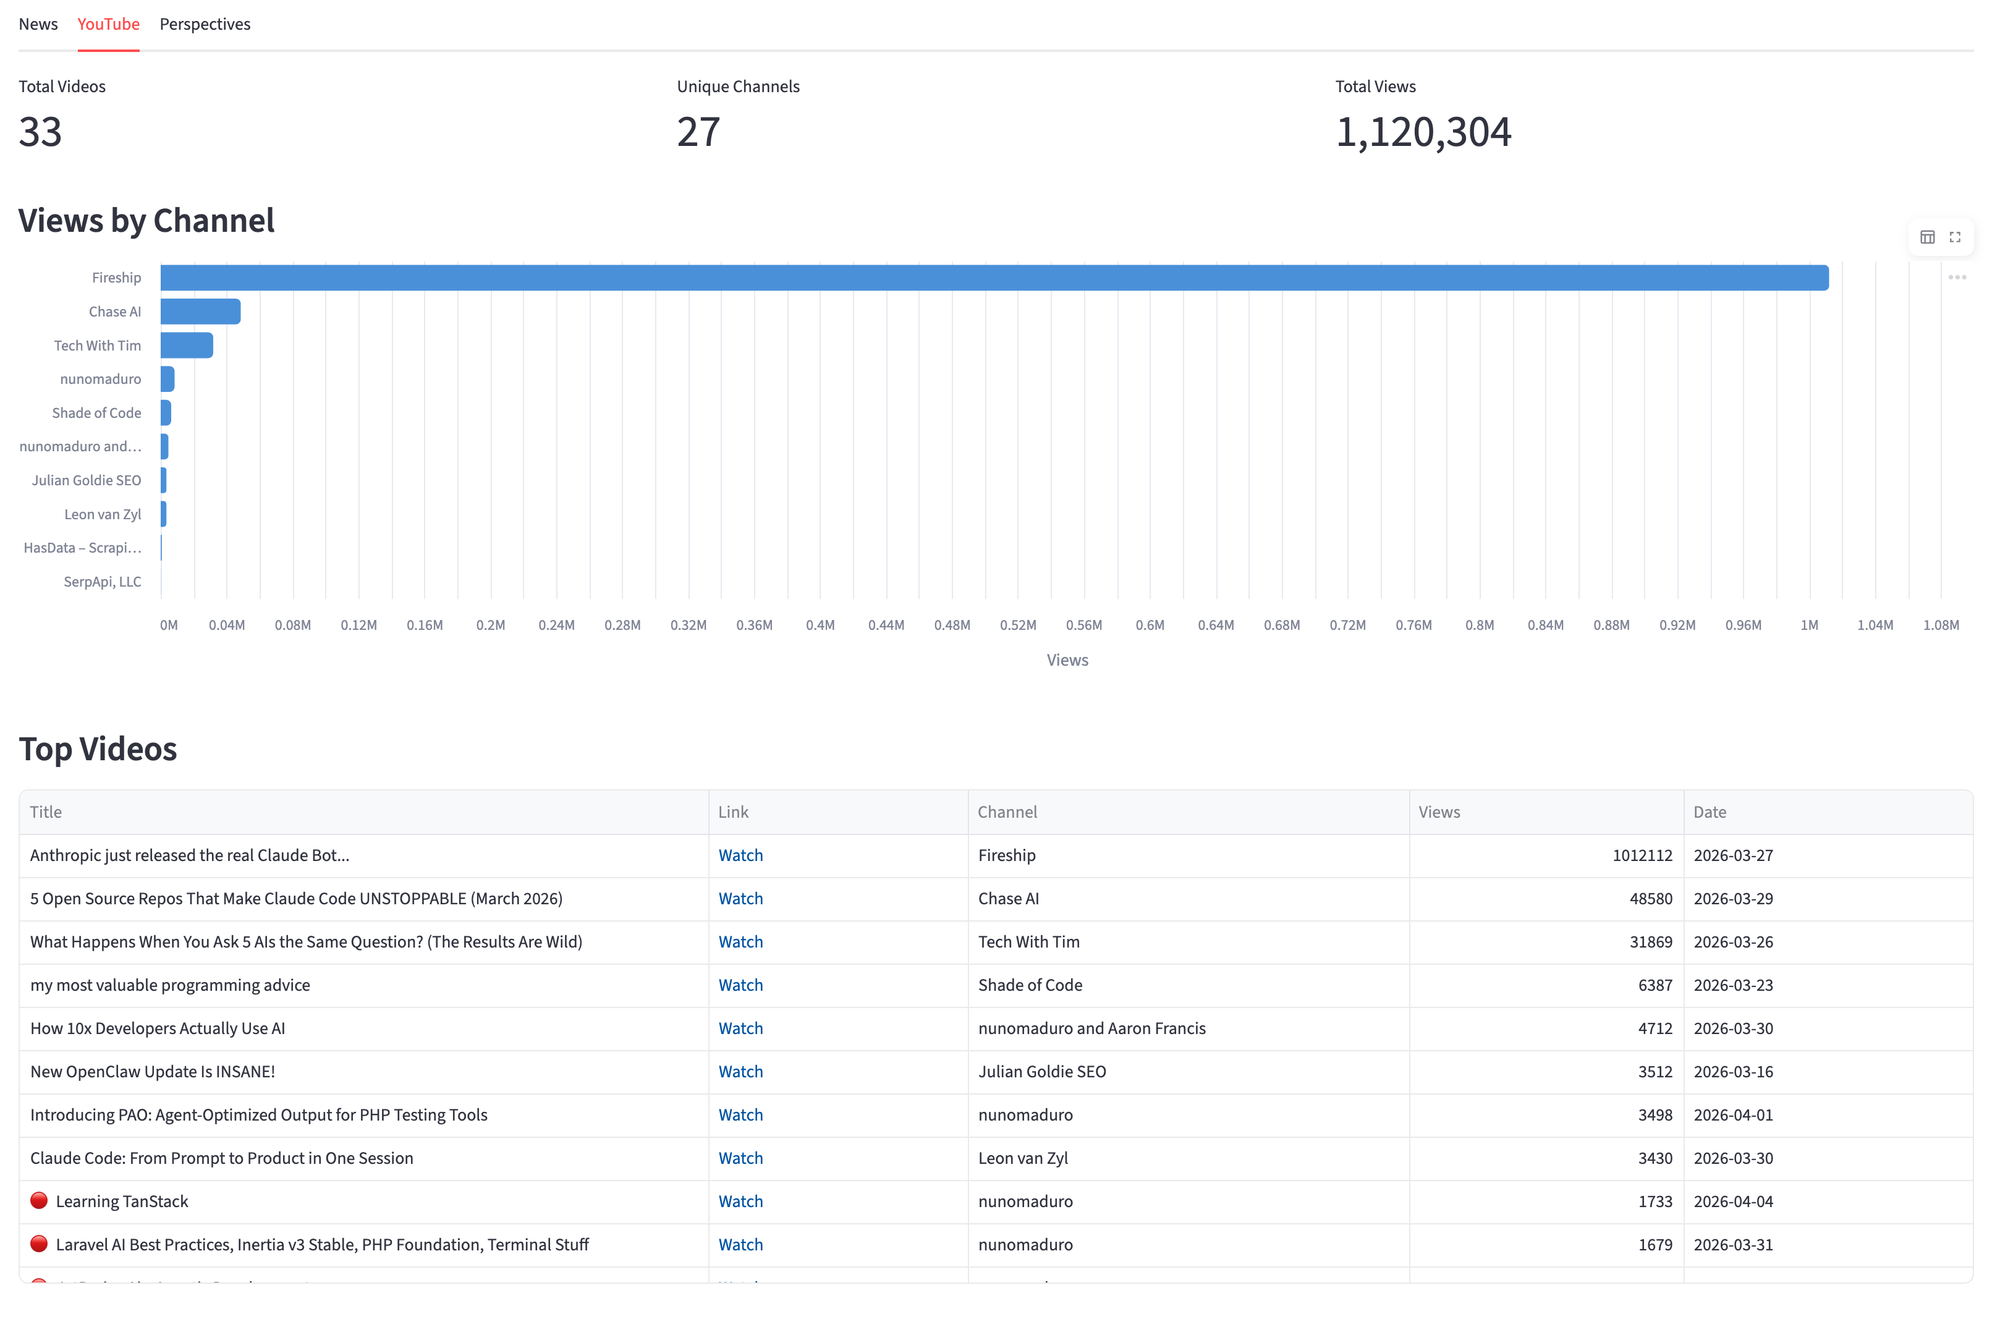
Perspectives Tab
The Perspectives tab splits the layout between a discussion table on the left, and a donut chart of mentions by platform on the right. The donut chart makes it easy to see where conversations happen, whether it's LinkedIn, Reddit, X, etc.
platform_chart = alt.Chart(platform_df).mark_arc(
    innerRadius=60, outerRadius=120
).encode(
    theta=alt.Theta("count:Q"),
    color=alt.Color("source:N", legend=alt.Legend(title="Platform")),
    tooltip=["source:N", "count:Q"],
).properties(height=350)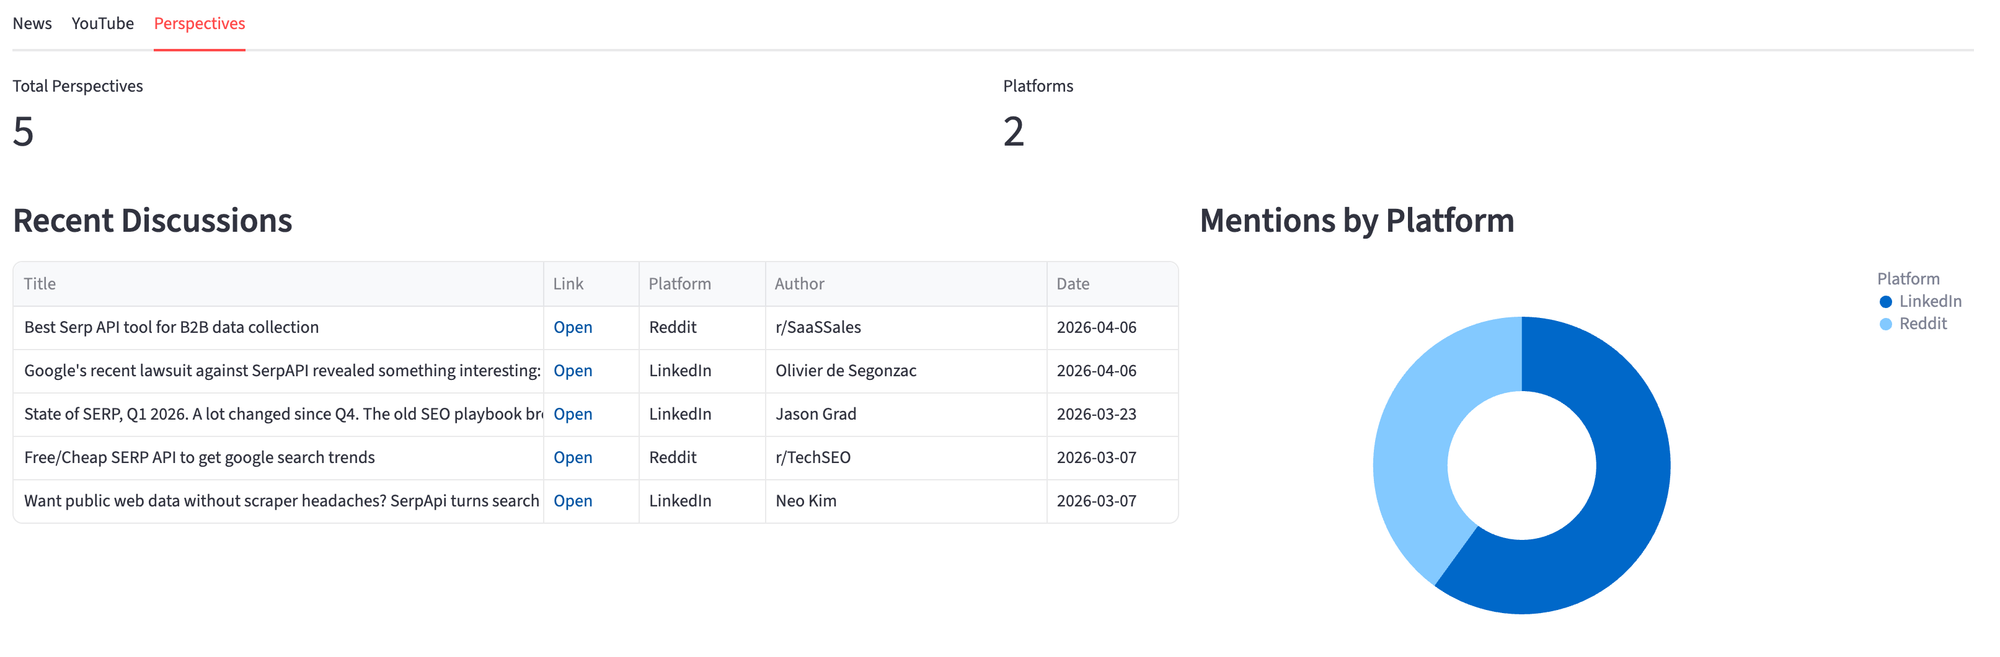
When to Use This Approach
Ideal for:
- Tracking brand mentions across news, video, and social in one view
- Monitoring product launches, PR campaigns, or competitor names
- Building internal dashboard for marketing or DevRel teams
Not recommended for:
- Real-time alerting. The API returns a snapshot, not a stream. For notifications, schedule the script on an interval and compare results.
- Historical analysis. Each engine returns recent results, not a complete archive.
If you want to explore the API response before writing code, the SerpApi Playground lets you test any engine interactively. And if you only need news coverage, the Google News API alone handles most brand monitoring use cases.
Where to Go from Here
This dashboard gives you a live snapshot. The natural next step is turning it into a historical record. Store each fetch in a database (SQLite, PostgreSQL, or even a CSV), and you can compare mention volume week over week, track which sources cover your brand consistently, and spot trends that a single snapshot can't show.
With historical data in place, you can layer on more analysis. Identify content gaps by looking at what topics competitors get covered on, but you don't. Track which YouTube channels mention your product and how their view counts trend over time. Flag new platforms or authors that start discussing your brand.
The data is yours to work with however fits your needs. The three engines give you the raw material; what you build on top depends on the questions you're trying to answer.
Conclusion
The full application is about 350 lines in a single Python file. Three API calls, three DataFrames, three tabs. The query input at the top lets you switch brands without changing the code.
What started as a way to check where "serpapi" shows up on the web became a tool that surfaces patterns you miss manually. The Perspectives tab pulls in LinkedIn posts, Reddit threads, and Quora answers that don't appear in regular news or video searches, and combining them in one view gives you the full picture.
Check out the full SerpAPI article collection here.
Comments