Build a Real-time Analytics Application With TiDB Cloud
This tutorial will teach you how to build a prototype real-time analytics dashboard that runs on a TiDB Cloud PoC cluster.
Join the DZone community and get the full member experience.
Join For FreeDisclaimer:
- PingExpress_DemoCorp is a dummy company. It does NOT reflect or imply any real company.
- This tutorial is for demonstration purposes only. Do NOT use any material (including but not limited to code and commands) from this tutorial in production environments.
PingExpress_DemoCorp is a supply chain management company in the United States. With more people shopping online due to the pandemic, PingExpress_DemoCorp’s business has scaled rapidly. They’re delivering tens of billions of packages a year.
With so many deliveries, a key part of their success is accurate and efficient package tracking. Business managers need to know where packages are so they can identify potential traffic blocks and rearrange delivery routes. Customers need accurate delivery dates so they can plan ahead. Therefore, real-time tracking, status updates, and a detailed dashboard are very important to PingExpress_DemoCorp.
In this tutorial, you will build a prototype for PingExpress_DemoCorp’s real-time analytics dashboard that runs on a TiDB Cloud Proof-of-Concept (PoC) cluster.
PingExpress_DemoCorp divides a package’s lifecycle into four stages:
- “1_pkg_in”: The package is collected by the company.
- “2_ori”: The package arrives at the processing center of the origin state.
- “3_des”: The package reaches the processing center of the destination state.
- “4_pkg_out”: The package is delivered to the end user.
Before You Begin
You should have the following software and packages installed:
Note: It is recommended to use pip3 to install packages, such as SQLAlchemy. We also suggest NOT to use the Mac application version for Metabase. It is gradually being phased out. You may use the jar version instead.
Create a TiDB PoC Cluster
- Log in to your TiDB Cloud account.
If you do not have a TiDB Cloud account, click “Try TiDB Cloud for Free” above to sign up for an account. - Click Create a Cluster to go to the plan selection page.
- Click apply for a PoC Cluster. It usually takes 24 ~ 48 hours to approve your request.
- On the Create a Cluster page, set up Cluster Name and Root Password. (In this tutorial, we will call our cluster PingExpressDB).
- Select the Region as AP-Southeast-1 (Singapore).
- Click Next.
- On the second page of the set, one TiDB node, three TiKV nodes, and one TiFlash node.
- Click Next.
- On the third page, review your settings and click Create Cluster.
Your TiDB Cloud cluster will be created in approximately 5 to 10 minutes.
Connect to TiDB Cloud
- Go to TiDBcloud and sign in to your cluster.
- On the TiDB Cloud console, in the upper right of the pane, click Connect.
The Connect to TiDB dialog displays. - Create the traffic filter for the cluster.
- Click Allow Access from Anywhere in Step 1.
- Click Create Filter.
Note: For production environments, do not enable Allow Access from Anywhere. Note the information between the -h and -P parameters; you’ll need this for a later step. For example,mysql -u root -h tidb.xxx.xxxxx.us-west-prod.aws.tidbcloud.com -P 4000 -p.
- Click the Web SQL Shell tab.
- Click Open SQL Shell and enter the password for the cluster.
You are now able to write SQL commands.
Import the Sample Data
- Create a database.
CREATE DATABASE PingExpressDB; - Create a user of the database. The user name is
'PingExpress_client', and you should set your own password to replace'<pwd>', such as'123'.CREATE USER 'PingExpress_client' IDENTIFIED BY '<pwd>'; - Grant all privileges to the user you just created.
GRANT ALL PRIVILEGES ON PingExpressDB.* TO 'PingExpress_client'; - Navigate to the TiDB Cloud Clusters page and find your cluster.
- In the upper right corner of the pane, click Import.
The Data Import Task page is displayed. - Enter the following information, and click Importto import the sample data:
- Data Source Type: Select AWS S3
- Bucket URL:
s3://pingexpress-na/backup_dumpling2/ - Bucket Region: Asia Pacific (Singapore)
- Data Format: Select TiDB Dumpling
- Setup Credentials:
arn:aws:iam::577523860935:role/pingexpress-na-1g - Target Database:
- Username: root.
- Password: Enter your root password.
- DB/Tables Filter: Leave this field blank.
The data import process takes about 5 minutes. When the data import progress bar shows Success, you have successfully imported the sample data and the database schema in your database.
Warning: Do not manipulate the data until the importing process finishes. Otherwise, the importing process fails.
- Check the imported data.
- Open Web SQL Shell and enter the cluster password. (Hint: On the TiDB Cloud console, in the upper right of the pane, click Connect, then click the Web SQL Shell tab.)
- Switch to PingExpressDB.
USE PingExpressDB; - Check the number of records
SELECT COUNT(*) FROM packages;The result should be
13000000.
- Create TiFlash replicas for the table packages.
ALTER TABLE packages SET TiFlash REPLICA 1;Wait for a few minutes and then run the following query to check whether the TiFlash node is ready.
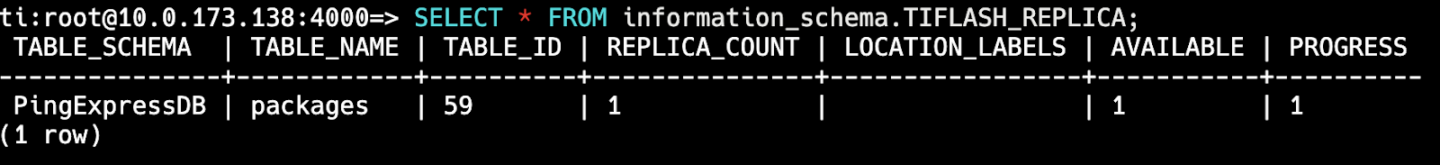
SELECT * FROM information_schema.TIFLASH_REPLICA;
When the TiFlash node is ready, the values of the “AVAILABLE” and “PROGRESS” columns turn to 1.
Connect to TiDB Cloud via Metabase
In this section, we walk you through the process of connecting to TiDB Cloud via Metabase.
- Start the Metabase application and click Let’s get started.
- Select your preferred language and click Next.
- Enter your information and account details in Step 2 and click Next.
- In the Add your data step, click the Database type drop down menu and select MySQL.
- Specify the following settings:
- Name:
PingExpressDB - Host:
<your_tidb_cloud_ip_address_obtained_previously> - Port:
4000 - Database name:
PingExpressDB - Username:
root - Password:
<password_of_your_tidb_cluster>
- Name:
- Scroll down to the bottom and click Next.
- For the Usage data preference step, change your preference if needed and click Next.
- Click Take me to Metabase.
Build Your Dashboards in Metabase
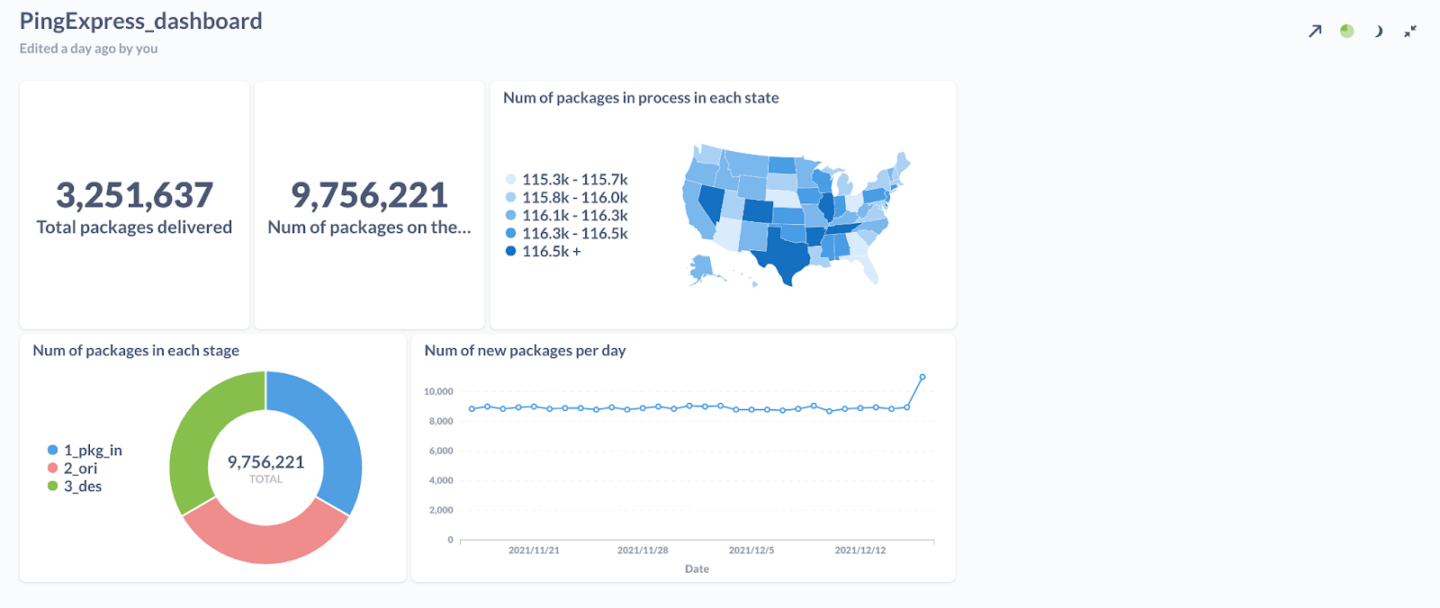
This section shows you how to build a Metabase dashboard. The dashboard contains five figures (or “questions” in Metabase terminology). We include the instructions to build the whole dashboard. However, building the first three of them is enough for the purpose of this tutorial. The last two figures are optional. The following figure shows the real-time Metabase dashboard for PingExpress_DemoCorp.
- Create a dashboard.
- In the top right corner of the dashboard, click the + sign and then choose New Dashboard.
- Enter the name PingExpress_dashboard.
- Click Create.
- Add a question.
- In the top right corner, click Ask a question on the top right corner, and then choose Native query.
- Select PingExpressDB as the database.
- Display the total number of packages delivered. Enter the following query and click the right side of the screen to run it:
SELECT COUNT(*) FROM packages WHERE transaction_kind="4_pkg_out";
- Save the question.
- In the upper right corner, click Save.
- Enter the name Total packages delivered.
- When being asked if you would like to add this question to the dashboard, click Yes please! and choose PingExpress_dashboard.
The result will now appear on the dashboard. - Click Save.
- Repeat steps 2 and 3 for the second question, “Number of packages on the way.” This is the query to use:
SELECT COUNT(*) FROM packages WHERE transaction_kind != "4_pkg_out"; - Visualize the Number of packages in process in each state.
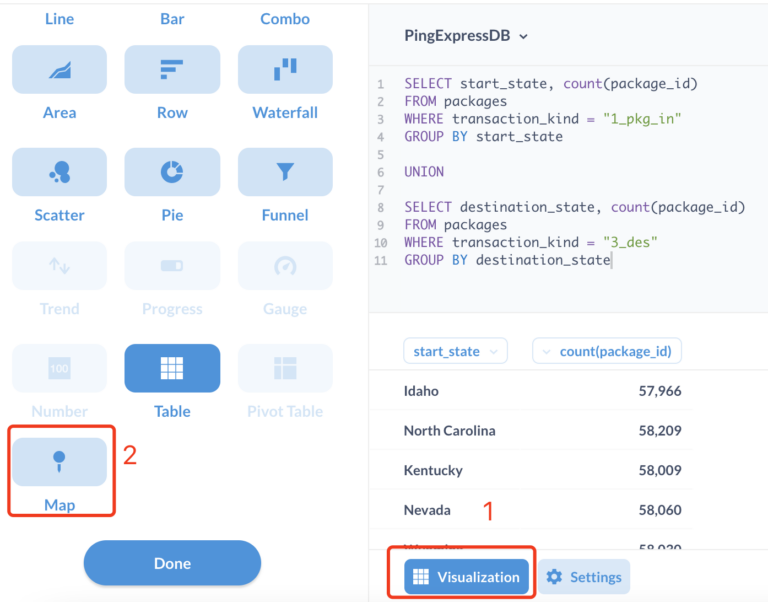
- Repeat step 3 and use the following query instead.
SELECT start_state, COUNT(package_id) FROM packages WHERE transaction_kind = "1_pkg_in" GROUP BY start_state UNION SELECT destination_state, COUNT(package_id) FROM packages WHERE transaction_kind = "3_des" GROUP BY destination_state - After getting the result, click the Visualization button and choose Map. For the map options:
- Map Type: Region map
- Region Map: United States
Leave everything else as default.
- Repeat step 4 and add this question to the dashboard.
![add this question to the dashboard.]()
- Repeat step 3 and use the following query instead.
- (Optional) Repeat the previous steps to add two more queries:
- Number of packages in each stage (pie chart):
SELECT transaction_kind, count(*) FROM packages WHERE transaction_kind != "4_pkg_out" GROUP BY transaction_kind - Number of new packages per day (line chart):
SELECT DATE(start_time), count(*) FROM packages WHERE transaction_kind = "1_pkg_in" AND start_time > DATE(NOW()) - INTERVAL 30 DAY GROUP BY DATE(start_time)
- Number of packages in each stage (pie chart):
Execute the Program
- Clone the program to your local machine or any virtual machines provided by your cloud vendor.
git clone https://github.com/pingcap/education.git - Go to the directory for PingExpress_DemoCorp.
cd PingExpress_DemoCorp - Update the connection string in the main method of
PingExpress_client.py. The connection string is in the format:tidb://<client_name>:<pwd>@xxx.xxxx.xxxx.xxxx.prod.aws.tidbcloud.com:4000/<DB_name>For example, if the client name is
PingExpress_client, the password is123, and the database name isPingExpressDB, the connection string is:tidb://PingExpress_client:[email protected]:4000/PingExpressDBYou can find the host address for TiDB Cloud in Connect to TiDB – Standard Connection – Step 2 in the TiDB Console, in the format:
xxx.xxxx.xxxx.xxxx.prod.aws.tidbcloud.com. - Update the timestamp to match the current date:
python3 PingExpress_client.py --update_timestampIt may take 5 ~ 10 minutes.
- Execute the program:
python3 PingExpress_client.py --execute --clients 50 --duration 100The command assumes there will be 50 clients, and the program runs for 200 seconds.
- Observe the results. When the program starts running, you can navigate to the Metabase dashboard and observe the dashboard being updated in real time.
Published at DZone with permission of Phoebe He. See the original article here.
Opinions expressed by DZone contributors are their own.
Comments