

This Compiler Bottleneck Took 16 Hours Off Our Training Time
We shaved 16 hours off training by uncovering a hidden compiler bottleneck! Real speedups come from understanding toolchain failures, not just using more tools.
 ·
·
Join the DZone community and get the full member experience.
Join For FreeA 60-hour training job had become the new normal. GPUs were saturated, data pipelines looked healthy, and infra monitoring didn’t flag any issues. But something was off. The model wasn't large, nor was the data complex enough to justify that duration. What we eventually discovered wasn't in the Python code or the model definition. It was buried deep in the compiler stack.
Identifying the Invisible Bottleneck
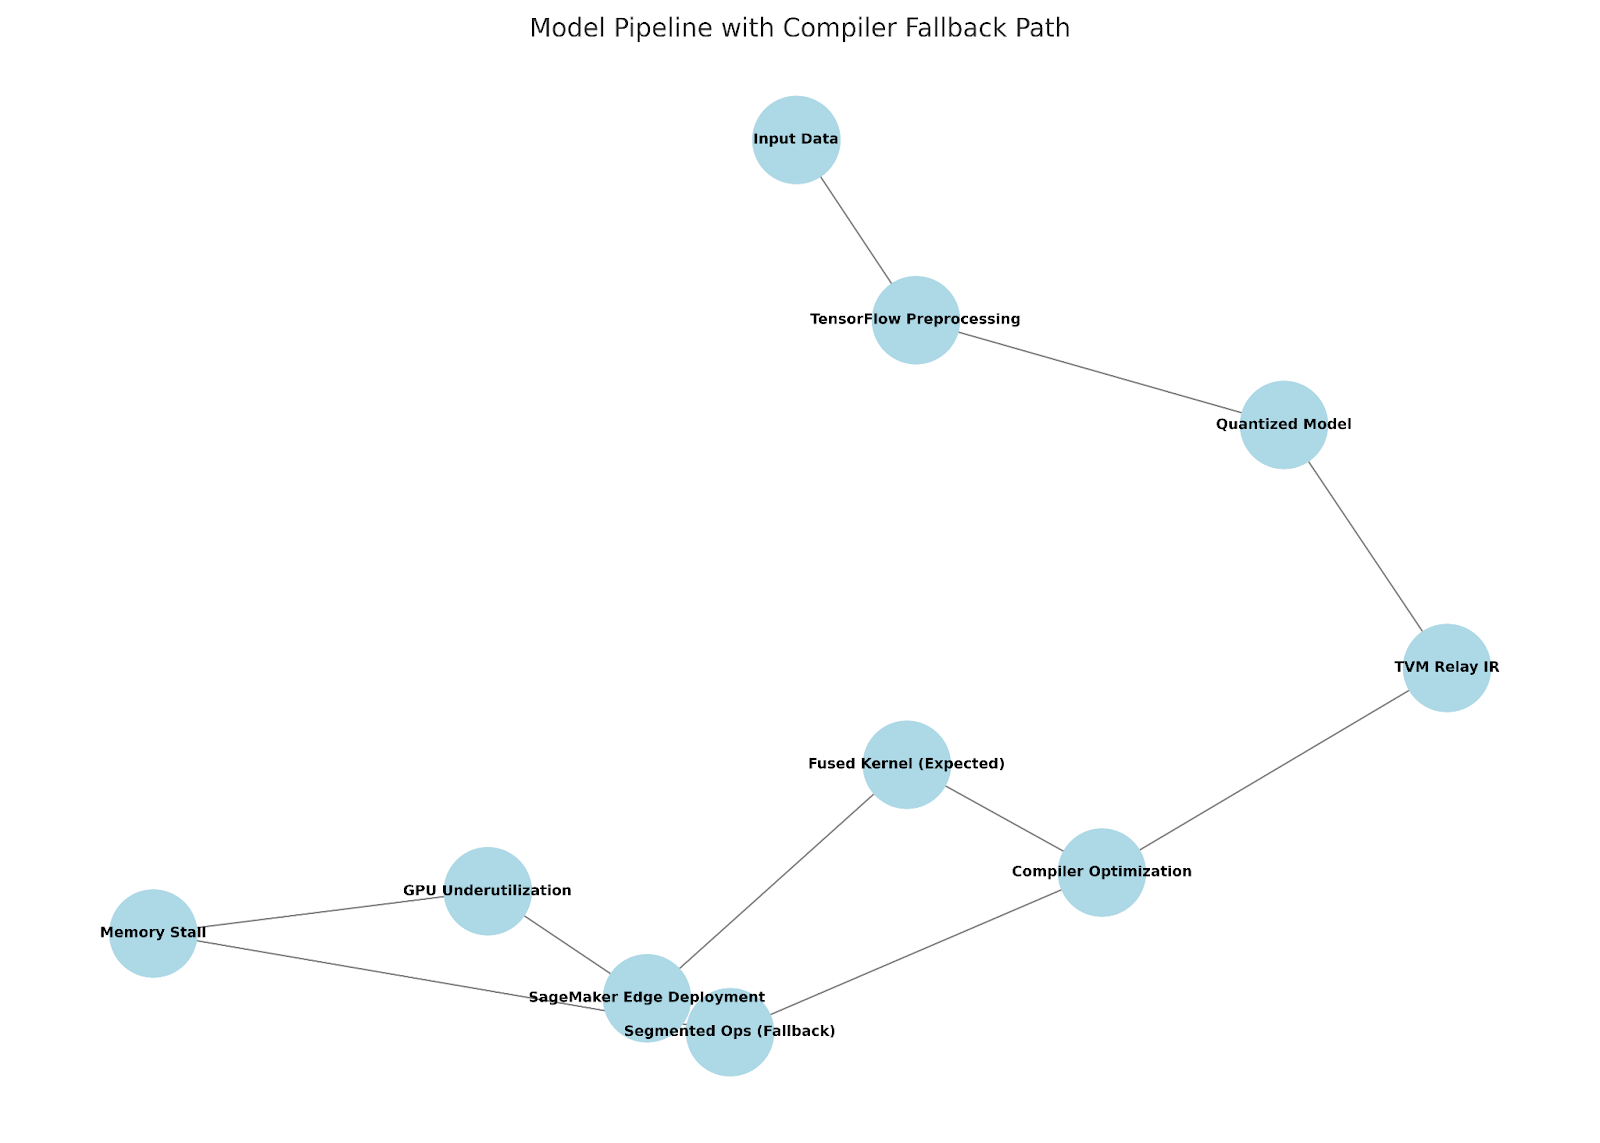
Figure: Model pipeline showing the expected flow toward fused kernel optimization and the alternate fallback path leading to GPU under-utilization. The figure highlights critical decision points in the compiler stack affecting performance.
We were deploying a quantized neural network using TensorFlow with TensorRT acceleration, routed through a custom TVM stack for inference optimization. On paper, this stack was airtight: optimized kernels, precompiled operators, and GPU targeting enabled. But profiling told another story.
Despite all optimizations turned on, GPU utilization plateaued. Memory spikes were inconsistent. Logs showed fallback ops triggering sporadically. We drilled into the Relay IR emitted by TVM and discovered a subtle but costly regression: certain activation patterns (like leaky_relu fused after layer_norm) weren’t being lowered correctly for quantized inference. Instead of a fused kernel, we were getting segmented ops that killed parallelism and introduced memory stalls.
# Expected fused pattern (not observed due to mispass)
%0 = nn.batch_norm(%input, %gamma, %beta, epsilon=0.001)
%1 = nn.leaky_relu(%0)
# Compiled form should have been a single fused op

# Actual IR observed during fallback
%0 = nn.batch_norm(%input, %gamma, %beta, epsilon=0.001)
%1 = nn.op.identity(%0)
%2 = nn.leaky_relu(%1)
# Segmentation introduced identity pass, breaking the fuse pattern
The root cause? A compiler pass treating a narrow edge case as a generic transform.
The Dirty Work of Debugging Acceleration
In debugging TVM's Relay IR stack, one overlooked ally was the relay.analysis module. We scripted out a pattern matcher to scan through blocks and detect unintended op separation, especially when quantization annotations were injected. The IR was instrumented with logs to trace op-to-op transitions.
from tvm.relay.dataflow_pattern import wildcard, is_op, rewrite, DFPatternCallback

class FuseChecker(DFPatternCallback):
    def __init__(self):
        super().__init__()
        self.pattern = is_op("nn.batch_norm")(wildcard()) >> is_op("nn.leaky_relu")

    def callback(self, pre, post, node_map):
        print("Unfused pattern detected in block:", pre)

rewrite(FuseChecker(), mod['main'])
This gave us visibility into the transformation path and showed that, despite high-level optimizations, certain common patterns weren’t being caught. Worse, the IR graph diverged depending on how the quantization pre-pass handled calibration annotations.
Fixing this wasn’t elegant. First, we had to isolate the affected patterns with debug passes in Relay. We then created a custom lowering path that preserved fused execution for our target GPU architecture. Meanwhile, TensorRT logs revealed that calibration ranges had silently defaulted to asymmetric scaling for certain ops, leading to poor quantization fidelity; something no benchmarking script had caught.
[TensorRT] WARNING: Detected uncalibrated layer: layer_norm_23
[TensorRT] INFO: Tactic #12 for conv1_3x3 failed due to insufficient workspace
[TensorRT] INFO: Fallback triggered for leaky_relu_5
[TensorRT] WARNING: Calibration range fallback defaulted to (min=-6.0, max=6.0)
We re-quantized using percentile calibration and disabled selective TensorRT fusions that were behaving unpredictably. The changes weren’t just in code; they were in judgment calls around what to optimize and when. Performance engineering is part systems diagnosis, part gut instinct.
Infrastructure Rewrites We Didn’t Want To Do
To maintain reproducibility, we added hashing logic to model IR checkpoints. This allowed us to fingerprint model graphs before and after every compiler optimization pass. Any IR delta triggered a pipeline rerun and a deployment alert.
We also introduced an internal version control mechanism for compiled artifacts, stored in S3 buckets with hash-tagged lineage references. This way, deployment failures could be traced back to a specific commit in the compiler configuration and not just the source model.
None of these fixes was isolated. Once our quantization flow changed, our SageMaker Edge deployment containers broke due to pa ackage mismatch and model signature incompatibility. We had to revalidate across device classes, update Docker images, and reprofile edge deployment times.
# TVM Lowering Configuration
import tvm
from tvm import relay

target = tvm.target.Target("cuda")
with tvm.transform.PassContext(opt_level=3):
    lib = relay.build(mod, target=target, params=params)
What made this harder was the legacy cost-tracking infrastructure built during my time at Amazon Go. Any model versioning tweak disrupted our resource billing granularity. So we also had to rewire metering hooks, regenerate EC2 cost estimates, and rewrite tagging policies.
Tooling complexity cascades. A single op tweak at the compiler level turned into a week-long infra-wide dependency resolution
Performance Tradeoff
Yes, we got a 5x speedup. But it came with tradeoffs.
Some quantized models lost accuracy in edge deployment. Others were too fragile to generalize across hardware classes. We had to A/B test between 8-bit and mixed-precision models. In one case, we rolled back to a non-quantized deployment just to preserve prediction confidence.
Quantization also impacted explainability in downstream model audits. We noticed inconsistent behavior in post-deployment trace logs, particularly in user-facing applications where timing-sensitive predictions created drift across device tiers. Optimizing the calibration configuration for precision often meant sacrificing consistency — a trade-off that's hard to communicate outside the infra team.
The hardest part? Convincing teams that ‘faster’ didn’t always mean ‘better.’
Closing Reflection
Most performance wins don’t come from new tools. They come from understanding how existing ones fail.
TVM, TensorRT, SageMaker... they all offer acceleration, but none of them account for context. We learned to build visibility into our compilers, not just our models. We now inspect every IR block before deployment. We trace every fallback path. We don’t benchmark for speed but we benchmark for behavior.
We also built internal dashboards to track compiler-side regressions over time. Having that historical visibility has helped us preemptively catch fallback patterns that would have otherwise crept into production.
That 16-hour drop wasn’t just a speed win. It was a visibility win. And in ML infrastructure, that’s the metric that really matters.
Opinions expressed by DZone contributors are their own.
Comments