

CPU Profiling - Flame Graphs
This article gives an introduction to flame graphs and discusses how they can be used to analyze CPU hot spots in large systems to reduce cost.
 ·
·
Join the DZone community and get the full member experience.
Join For FreeFor any distributed large-scale software application keeping cost under control is one of the most important aspects. As the business grows, the cost of core software applications can get very high.
For cloud-based elastic distributed systems, the cost can be managed by monitoring and optimizing the CPU of the application, if system scale-out and scale-in are controlled by CPU usage threshold. One way is to generate a flame graph of the application to understand CPU hot spots.
In my experience, I have been able to reduce large distributed systems costs by 10–15% by analyzing and relieving CPU hotspots through flame graphs. For bigger systems reducing even 1% can result in huge cost reduction.
Flame Graph
A flame graph is a visualization of application control flow. It shows the sequence of functions called within the application call stack along with the CPU percentage used by those code segments.
The CPU percentage for a certain routine or call stack is calculated based on the number of samples belonging to the call stack of a certain routine compared to the total samples for the duration of profiling.
Understanding Flame Graphs
Below is a sample visualization of the flame graph. A common mistake is to assume that the x-axis is the passage of time. Instead, the x-axis is alphabetically ordered function calls or call stacks and the y-axis is call stack depth.
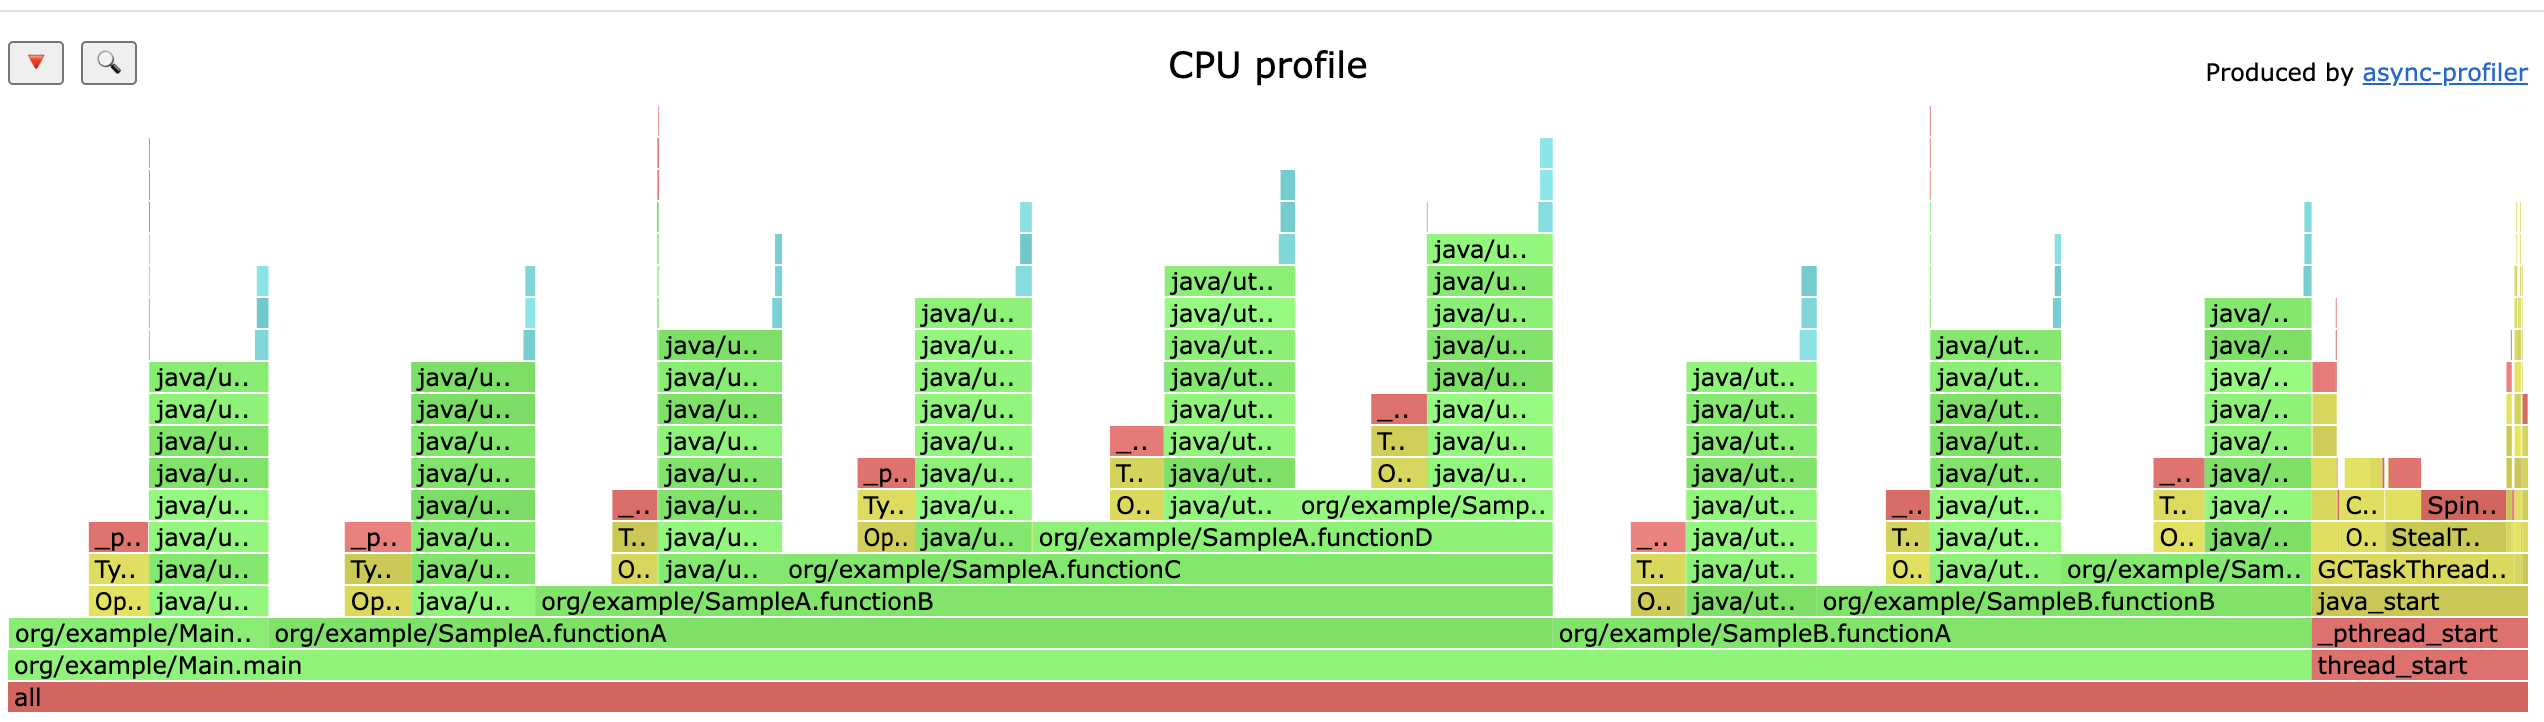
In the sample graph, the main call stack is Main.main which is calling Main.FunctionA, SampleA.FunctionA and SampleB.FunctionA but not in the same order, the calls are arranged alphabetically.
On hovering the mouse over a particular routine, it shows the total samples and CPU usage by the routine. Below it shows 858 samples, 30.58% usage for SampleA.functionC routine.
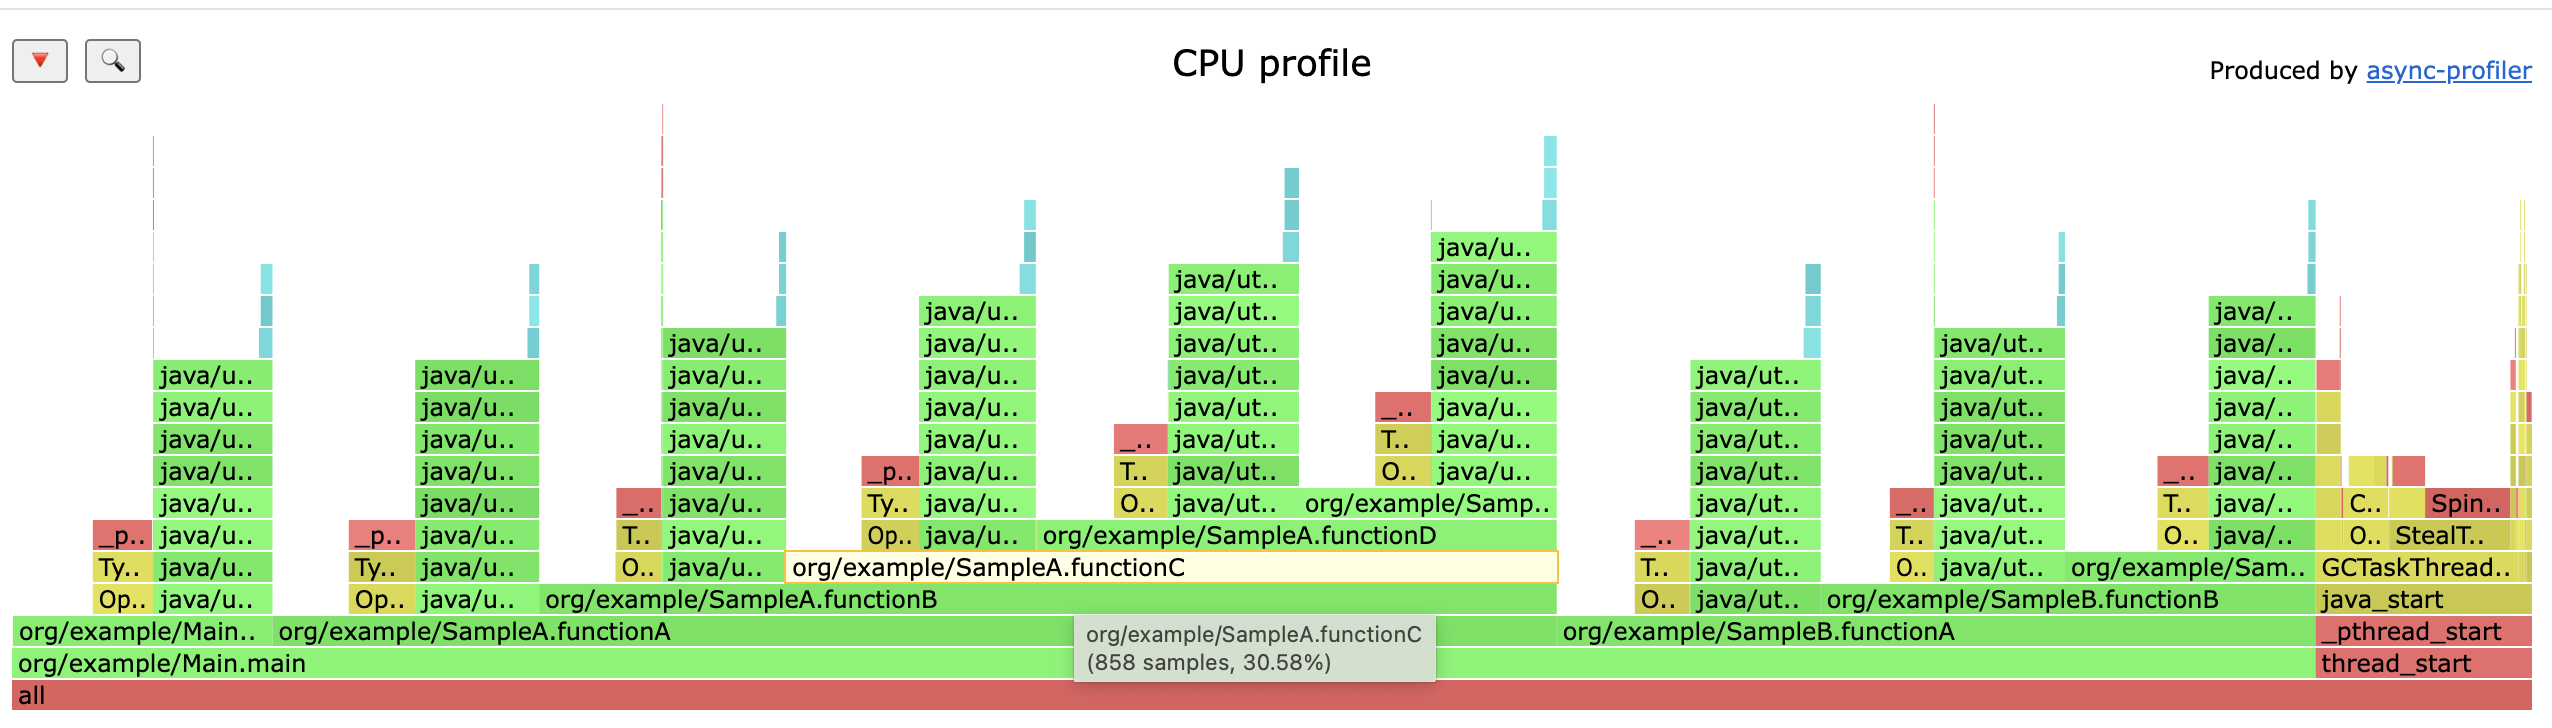
Now, if the routine is not expected to take as long as shown in the flame graph, it should be inspected for any possible optimization.
Some wasteful activities could be unnecessary polling, too many layers of objects, redundant checks, and unnecessary deserialization and serialization of objects.
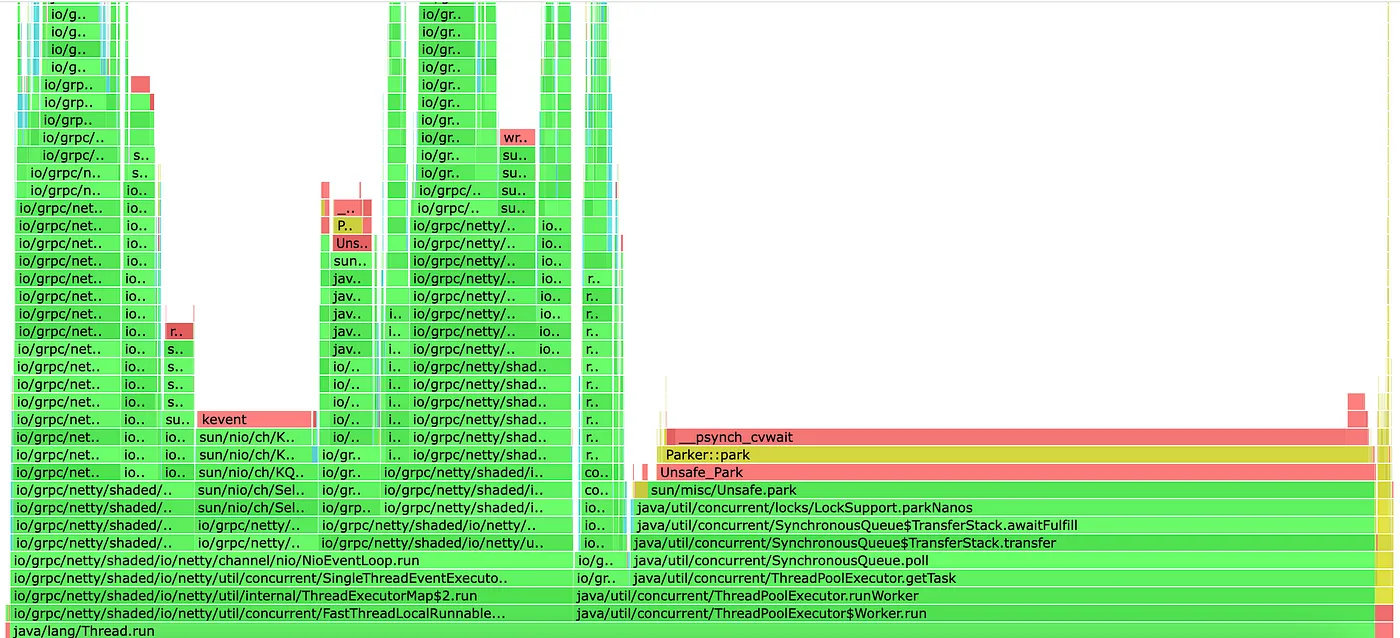
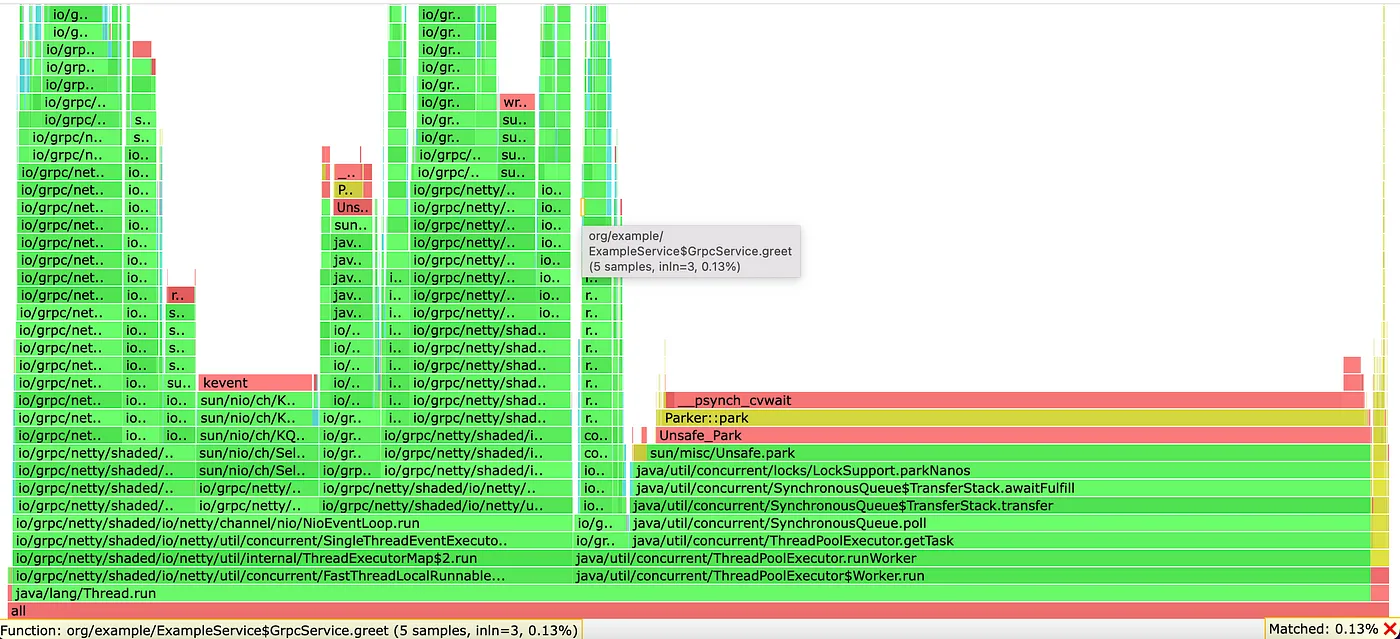
Flame graphs for a large-scale application or ones using existing frameworks could become very dense. In that case, it is efficient to search a specific routine within the graph rather than combing through each call stack. e.g. below is a flame graph for a sample Java reactor-based gRPC service.
It is easier to search the routine to pinpoint its usage. In this case, routine greet() is searched.
Generation
There are many tools to generate flame graphs. The one used for the article is async-profiler. It is a simple low-overhead profiler that also prevents issues due to safe point sampling and is simple to download and use.
Below is the command to generate a flame graph for a sample window of 30 sec using an async-profiler.
asprof -d 30 -f cpu_profile.html <process_id>
Conclusion
CPU profiling is an important aspect to identify cpu hot spots and flame graphs are a good way to analyze cpu hot spots.
If done correctly, CPU profiling can result in a good amount of cost reduction for large-scale elastic applications. In my experience, I have been able to successfully reduce the 10–15% cost of large applications by identifying CPU hot spots through flame graphs.
Feel free to reach out in case of any doubts and in case any guidance is required for your use case.
Published at DZone with permission of Parveen Saini. See the original article here.
Opinions expressed by DZone contributors are their own.
Comments