Sponsored Content
Deploying Kafka With the ELK Stack
Deploying Kafka With the ELK Stack
In this article, I'll show how to deploy all the components required to set up a resilient data pipeline with the ELK Stack and Kafka.
This article was provided by and does not represent the editorial content of DZone.
Join the DZone community and get the full member experience.
Join For Free
Following a production incident, and precisely when you need them the most, logs can suddenly surge and overwhelm your logging infrastructure. To protect Logstash and Elasticsearch against such data bursts, users deploy buffering mechanisms to act as message brokers.
Apache Kafka is the most common broker solution deployed together the ELK Stack. Usually, Kafka is deployed between the shipper and the indexer, acting as an entrypoint for the data being collected:

In this article, I'll show how to deploy all the components required to set up a resilient data pipeline with the ELK Stack and Kafka:
- Filebeat - collects logs and forwards them to a Kafka topic.
- Kafka - brokers the data flow and queues it.
- Logstash - aggregates the data from the Kafka topic, processes it and ships to Elasticsearch.
- Elasticsearch - indexes the data.
- Kibana - for analyzing the data.
My Environment
To perform the steps below, I set up a single Ubuntu 16.04 machine on AWS EC2 using local storage. In real-life scenarios you will probably have all these components running on separate machines.
I started the instance in the public subnet of a VPC and then set up a security group to enable access from anywhere using SSH and TCP 5601 (for Kibana). Finally, I added a new elastic IP address and associated it with the running instance.
The example logs used for the tutorial are Apache access logs.
Step 1: Installing Elasticsearch
We will start with installing the main component in the stack — Elasticsearch. Since version 7.x, Elasticsearch has been bundled with Java so we can jump right ahead with adding Elastic's signing key:
wget -qO - https://artifacts.elastic.co/GPG-KEY-elasticsearch | sudo apt-key add -For installing Elasticsearch on Debian, we also need to install the apt-transport-https package:
sudo apt-get update
sudo apt-get install apt-transport-https
Our next step is to add the repository definition to our system:
echo "deb https://artifacts.elastic.co/packages/7.x/apt stable main" | sudo
tee -a /etc/apt/sources.list.d/elastic-7.x.list
All that's left to do is to update your repositories and install Elasticsearch:
sudo apt-get update && sudo apt-get install elasticsearchBefore we bootstrap Elasticsearch, we need to apply some basic configurations using the Elasticsearch configuration file at: /etc/elasticsearch/elasticsearch.yml :
sudo su
vim /etc/elasticsearch/elasticsearch.yml
Since we are installing Elasticsearch on AWS, we will bind Elasticsearch to localhost. Also, we need to define the private IP of our EC2 instance as a master-eligible node:
network.host: "localhost"
http.port:9200
cluster.initial_master_nodes: ["<InstancePrivateIP"]
Save the file and run Elasticsearch with:
sudo service elasticsearch startTo confirm that everything is working as expected, point curl to: http://localhost:9200 , and you should see something like the following output (give Elasticsearch a minute or two before you start to worry about not seeing any response):
{
  "name" : "ip-172-31-49-60",
  "cluster_name" : "elasticsearch",
  "cluster_uuid" : "yP0uMKA6QmCsXQon-rxawQ",
  "version" : {
    "number" : "7.0.0",
    "build_flavor" : "default",
    "build_type" : "deb",
    "build_hash" : "b7e28a7",
    "build_date" : "2019-04-05T22:55:32.697037Z",
    "build_snapshot" : false,
    "lucene_version" : "8.0.0",
    "minimum_wire_compatibility_version" : "6.7.0",
    "minimum_index_compatibility_version" : "6.0.0-beta1"
  },
  "tagline" : "You Know, for Search"
}
Step 2: Installing Logstash
Next up, the "L" in ELK — Logstash. Logstash will require us to install Java 8 which is fine because this is also a requirement for running Kafka:
sudo apt-get install default-jreVerify java is installed:
java -version

openjdk version "1.8.0_191"
OpenJDK Runtime Environment (build 1.8.0_191-8u191-b12-2ubuntu0.16.04.1-b12)
OpenJDK 64-Bit Server VM (build 25.191-b12, mixed mode)
Since we already defined the repository in the system, all we have to do to install Logstash is run:
sudo apt-get install logstashNext, we will configure a Logstash pipeline that pulls our logs from a Kafka topic, process these logs and ships them on to Elasticsearch for indexing.
Let's create a new config file:
sudo vim /etc/logstash/conf.d/apache.confPaste the following configurations:
input {
  kafka {
    bootstrap_servers => "localhost:9092"
    topics => "apache"
    }
}

filter {
    grok {
      match => { "message" => "%{COMBINEDAPACHELOG}" }
    }
    date {
    match => [ "timestamp" , "dd/MMM/yyyy:HH:mm:ss Z" ]
    }
  geoip {
      source => "clientip"
    }
}

output {
  elasticsearch {
    hosts => ["localhost:9200"]
  }
}
As you can see, we're using the Logstash Kafka input plugin to define the Kafka host and the topic we want Logstash to pull from. We're applying some filtering to the logs and we're shipping the data to our local Elasticsearch instance.
Save the file.
Step 3: Installing Kibana
Let's move on to the next component in the ELK Stack - Kibana. As before, we will use a simple apt command to install Kibana:
sudo apt-get install kibanaWe will then open up the Kibana configuration file at: /etc/kibana/kibana.yml, and make sure we have the correct configurations defined:
server.port: 5601
elasticsearch.url: "http://localhost:9200"
These specific configurations tell Kibana which Elasticsearch to connect to and which port to use.
Now, we can start Kibana with:
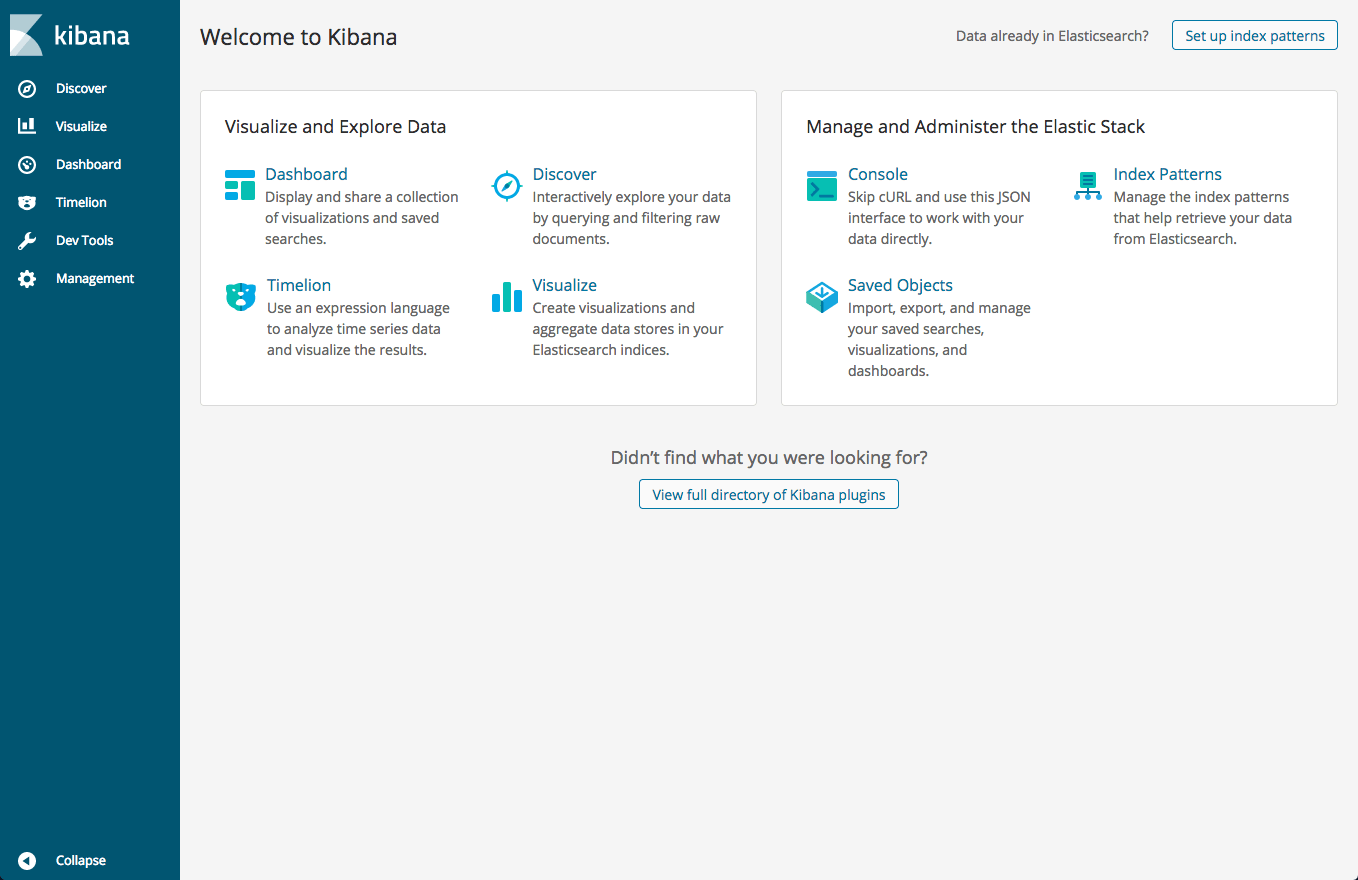
sudo service kibana startOpen up Kibana in your browser with: http://localhost:5601. You will be presented with the Kibana home page.
Step 4: Installing Filebeat
As mentioned above, we will be using Filebeat to collect the log files and forward them to Kafka.
To install Filebeat, we will use:
sudo apt-get install filebeatLet's open the Filebeat configuration file at:
/etc/filebeat/filebeat.yml

sudo vim /etc/filebeat/filebeat.yml
Enter the following configurations:
filebeat.inputs:
- type: log
  enabled: true
  paths:
    - /var/log/apache2/access.log

output.kafka:
  codec.format:
    string: '%{[@timestamp]} %{[message]}'
  hosts: ["localhost:9092"]
  topic: apache
  partition.round_robin:
    reachable_only: false
  required_acks: 1
  compression: gzip
  max_message_bytes: 1000000
In the input section, we are telling Filebeat what logs to collect — Apache access logs. In the output section, we are telling Filebeat to forward the data to our local Kafka server and the relevant topic (to be installed in the next step).
Note the use of the codec.format directive — this is to make sure the message and timestamp fields are extracted correctly. Otherwise, the lines are sent in JSON to Kafka.
Save the file.
Step 4: Installing Kafka
Our last and final installation involves setting up Apache Kafka — our message broker.
Kafka uses ZooKeeper for maintaining configuration information and synchronization so we'll need to install ZooKeeper before setting up Kafka:
sudo apt-get install zookeeperdNext, let's download and extract Kafka:
wget http://apache.mivzakim.net/kafka/2.2.0/kafka_2.12-2.2.0.tgz
tar -xvzf kafka_2.12-2.2.0.tgz
sudo cp -r kafka_2.12-2.2.0 /opt/kafka
We are now ready to run Kafka, which we will do with this script:
sudo /opt/kafka/bin/kafka-server-start.sh
/opt/kafka/config/server.properties
You should begin to see some INFO messages in your console:
[2019-04-22 11:48:16,489] INFO Registered
kafka:type=kafka.Log4jController MBean
(kafka.utils.Log4jControllerRegistration$)
[2019-04-22 11:48:18,589] INFO starting (kafka.server.KafkaServer)
Next, we're going to create a topic for our Apache logs:
bin/kafka-topics.sh --create --zookeeper localhost:2181
--replication-factor 1 --partitions 1 --topic apache

Created topic apache.
We are all set to start the pipeline.
Step 5: Starting the Data Pipeline
Now that we have all the pieces in place, it's time to start all the components in charge of running the data pipeline.
First, we'll start Filebeat:
sudo service filebeat startThen, Logstash:
sudo service logstash startIt will take a few minutes for the pipeline to start streaming logs. To see Kafka in action, enter the following command in a separate tab:
/opt/kafka/bin/kafka-console-consumer.sh --bootstrap-server
localhost:9092 --topic apache --from-beginning
If your Apache web server is indeed serving requests, you should begin to see the messages being forwarded to the Kafka topic by Filebeat in your console:
2019-04-23T13:50:01.559Z 89.138.90.236 - - [23/Apr/2019:13:50:00 +0000]
"GET /mysite.html HTTP/1.1" 200 426 "-" "Mozilla/5.0
(Macintosh; Intel Mac OS X 10_13_6) AppleWebKit/537.36 (KHTML, like Gecko)
Chrome/73.0.3683.86 Safari/537.36"
2019-04-23T13:51:36.581Z 89.138.90.236 - -
[23/Apr/2019:13:51:34 +0000] "GET /mysite.html HTTP/1.1" 200 427 "-"
"Mozilla/5.0 (Macintosh; Intel Mac OS X 10_13_6) AppleWebKit/537.36
(KHTML, like Gecko) Chrome/73.0.3683.86 Safari/537.36"
To make sure Logstash is aggregating the data and shipping it into Elasticsearch, use:
curl -X GET "localhost:9200/_cat/indices?v"If all is working as expected, you should see a logstash-* index listed:
health status index                      uuid                   pri rep docs.count docs.deleted store.size pri.store.size
green  open   .kibana_task_manager       zmMH6yy8Q6yg2jJHxq3MFA   1   0          2            0     45.4kb         45.4kb
yellow open   logstash-2019.04.23-000001 rBx5r_gIS3W2dTxHzGJVvQ   1   1          9            0     69.4kb         69.4kb
green  open   .kibana_1                  rv5f8uHnQTCGe8YrcKAwlQ   1   0          5            0
If you don't see this index, it's time to do some debugging I'm afraid. Check out this blog post for some tips on debugging Logstash.
All we have to do now is define the index pattern in Kibana to begin analysis. This is done under Management → Kibana Index Patterns.
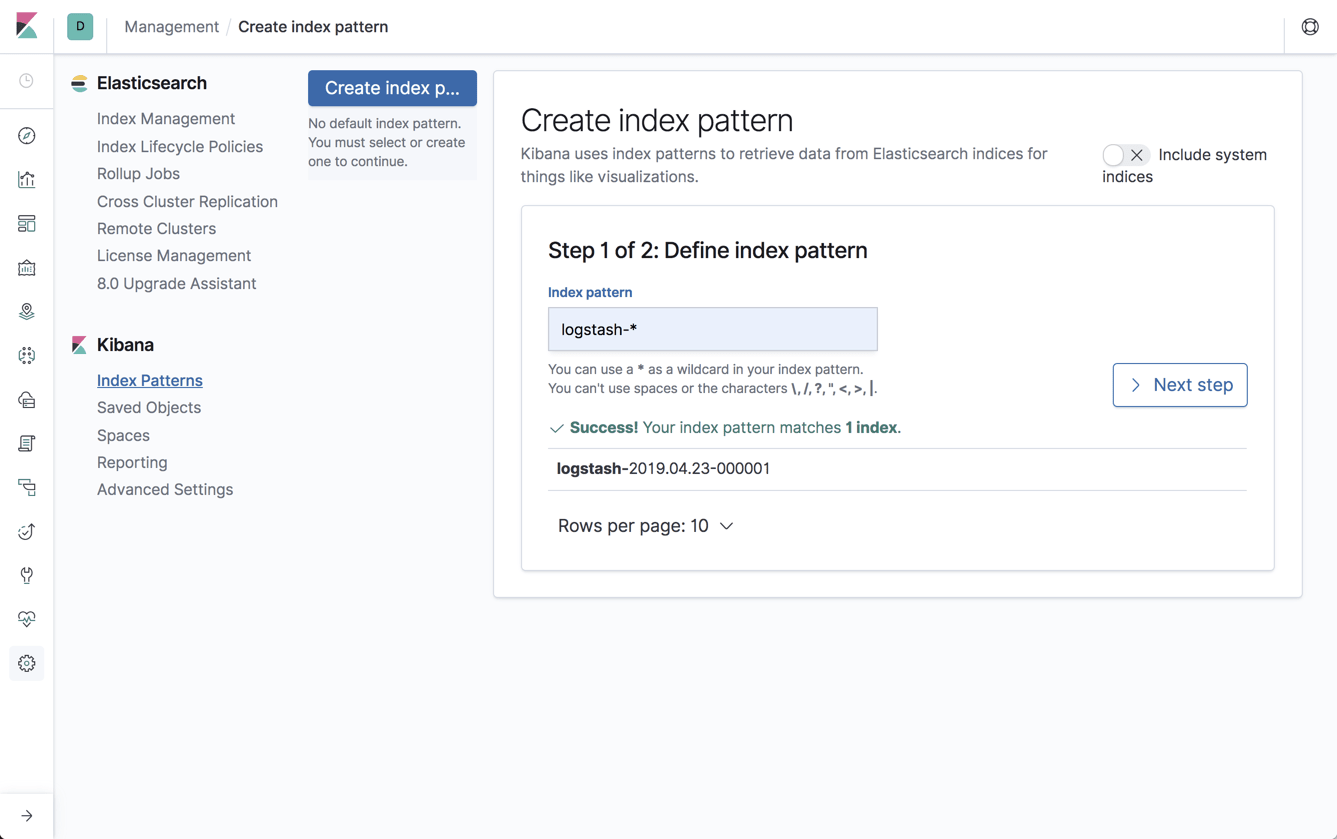
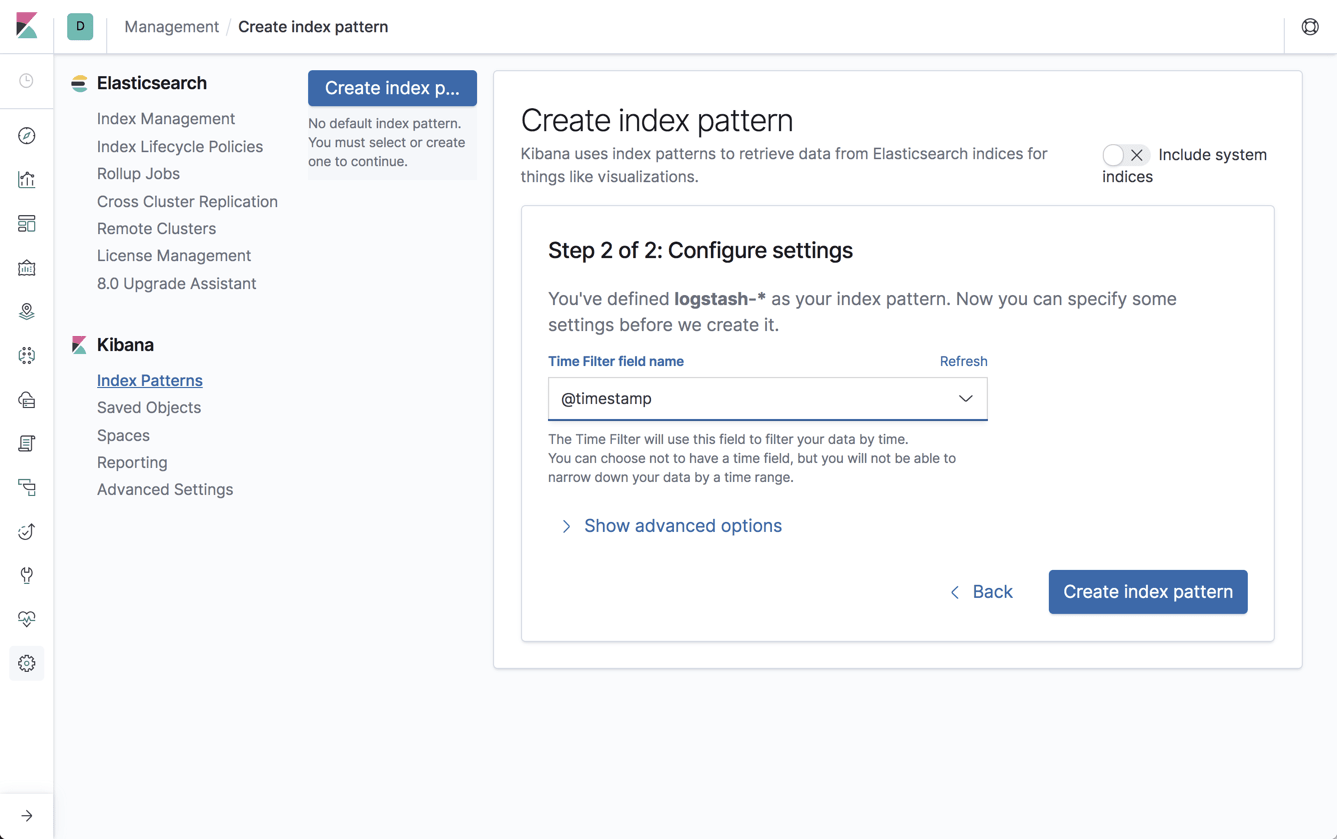
Kibana will identify the index, so simply define it in the relevant field and continue on to the next step of selecting the timestamp field:
Once you create the index pattern, you'll see a list of all the parsed and mapped fields:
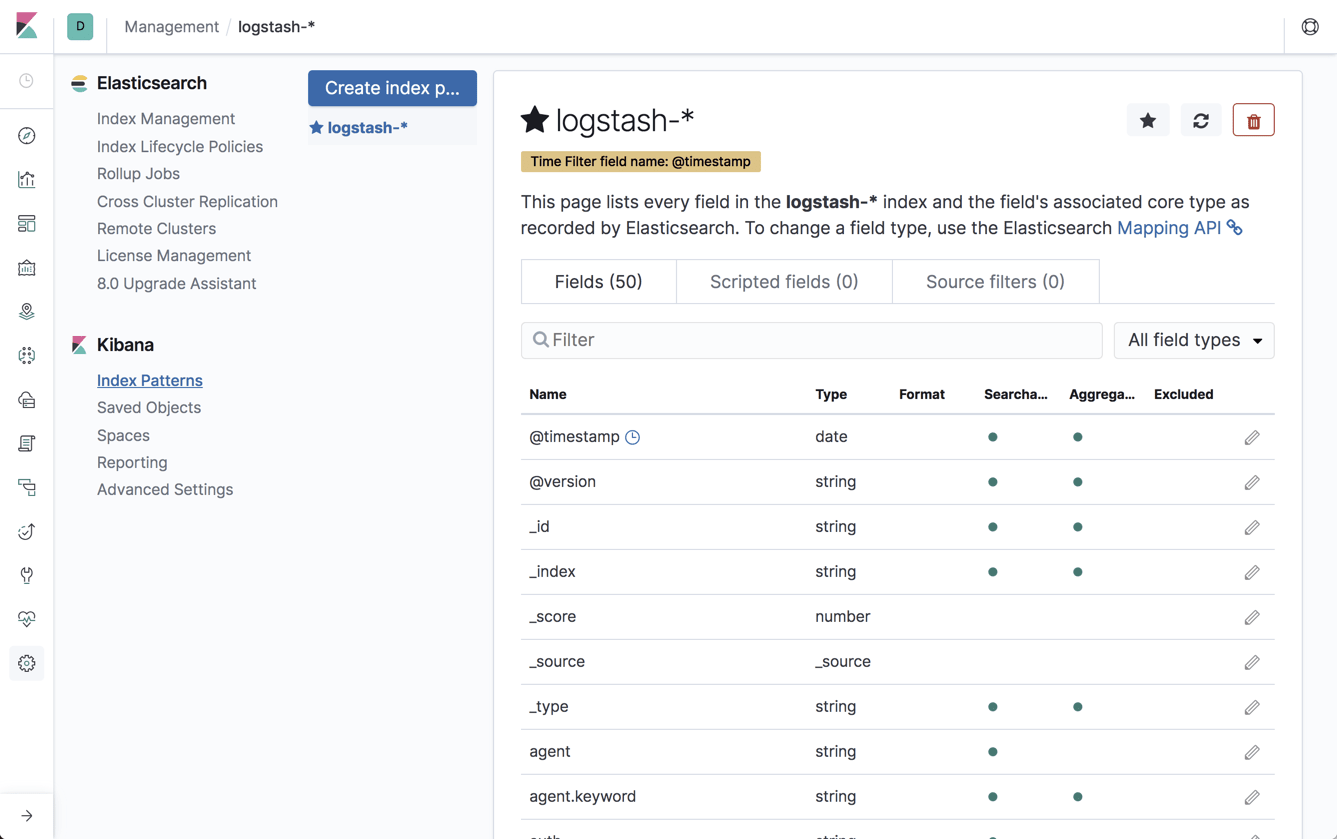
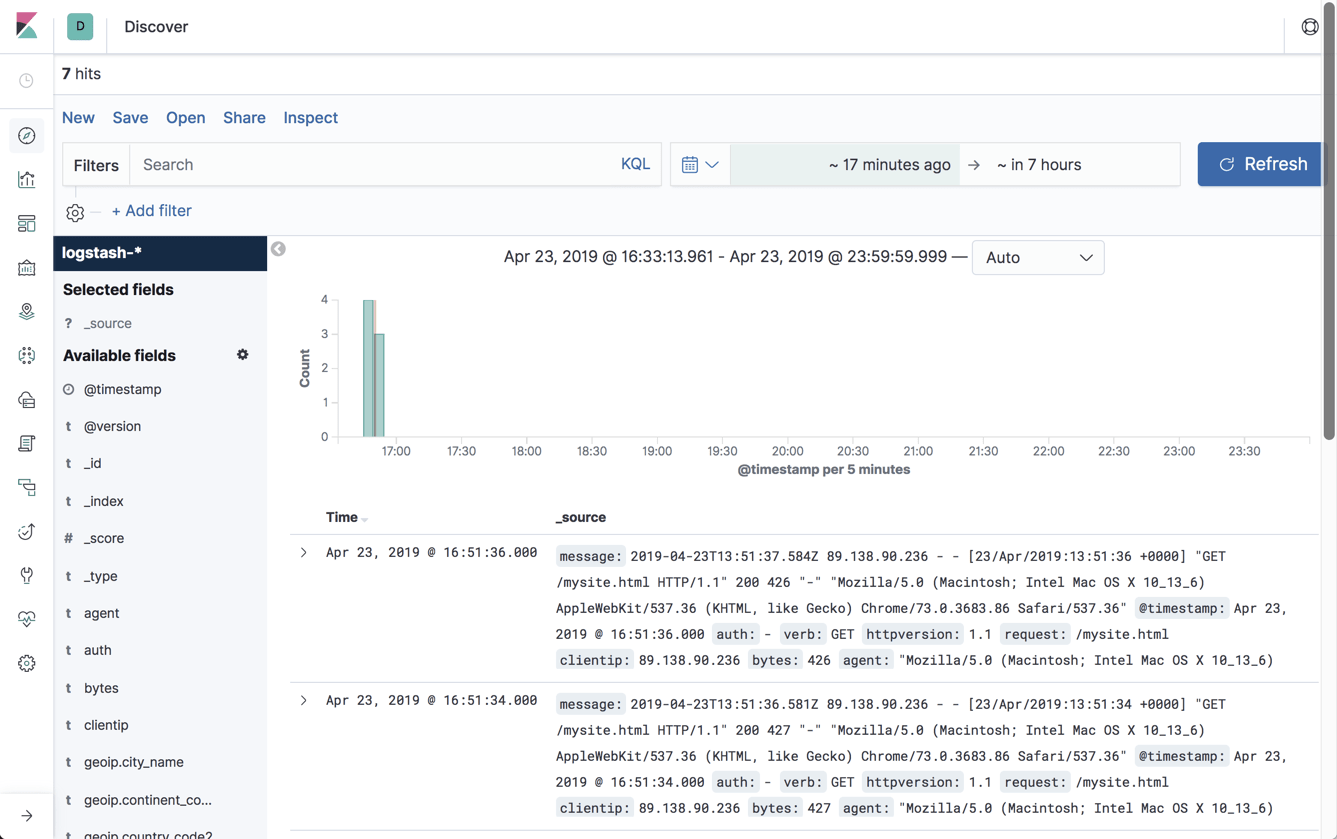
Open the Discover page to begin analyzing your data!
Summing it Up
Resilient data pipelines are a must in any production-grade ELK deployments. Logs are crucial for piecing together events and they are needed most in emergencies. We cannot afford to have our logging infrastructure fail at the exact point in time when it is most required. Kafka, and similar brokers, play a huge part in buffering the data flow so Logstash and Elasticsearch don't cave under the pressure of a sudden burst.
The example above is a basic setup of course. Production deployments will include multiple Kafka instances, a much larger amount of data and much more complicated pipelines. This will involve a considerable amount of engineering time and resources, something to take into consideration. The instructions here will help you understand how to get started though. I also recommend taking a look at our article explaining how to log Kafka itself.
Published at DZone with permission of Daniel Berman. See the original article here.
Opinions expressed by DZone contributors are their own.
{{ parent.title || parent.header.title}}
{{ parent.tldr }}
{{ parent.linkDescription }}
{{ parent.urlSource.name }}