Logging Using Log4Net and gelf4net to ELK running on Docker via Udp Port
We take a look at how to set up the ELK stack, get it running on Docker, and configure log4net to send Gelf messages to ELK using gelf4net.
Join the DZone community and get the full member experience.
Join For FreeIn this article, we will see how to set up ELK running on Docker and configure log4net to send Gelf messages to ELK using gelf4net. The sample code is written in C# and the .NET Framwork Console project.
ELK is an open source project; it is an acronym for Elasticsearch, Logstash and Kibana. For a quick recap, Elasticsearch is a search and analytics engine. Logstash is a server-side data processing pipeline that is capable of ingesting data from multiple sources, transform it, and then send it to Elasticsearch. Kibana is used to visualize data with charts and graphs in Elasticsearch.
The Apache log4net library is a popular tool that allows you to output log statements to a variety of output targets.
The library gelf4net is a log4net adapter that formats logs to the GELF specification and makes it easy to send them over Udp. Gelf stands for Graylog Extended Log Format (GELF). GELF is a great choice for logging from within applications and GELF can be sent via UDP since you don’t have to worry about timeouts, connection problems, or anything that might break your application from within the class you are using for logging. You can read more about GELF at this link http://docs.graylog.org.
Getting Started: To start with, we will be creating our custom image from the public image sebp/elk on Docker Hub. The sebp/elk Docker image provides a convenient, centralized log server and log management web interface, by packaging Elasticsearch, Logstash, and Kibana, collectively known as ELK.
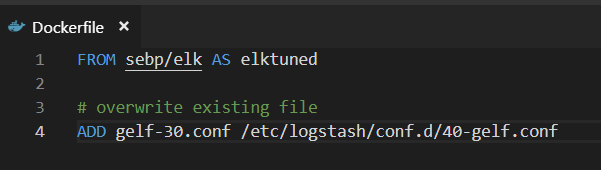
Steps 1. Create a Docker file that will be used to build the ELK image.
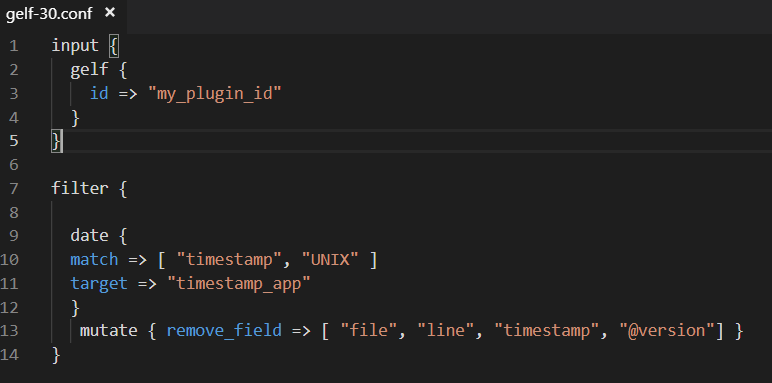
Step 2. Create a gelf-30.conf file for Logstash which will be added to the image. This file specifies which plugins we want to use and the settings for each plugin. In our case, we will use a GELF input plugin. Plugins enable a specific source of events to be read by Logstash. You will notice on the input plugin we did not specify a port. Hence, Logstash will use the default port of 12201.
Step 3. We will run Docker build command to build image from the docker file above.
# Docker build -t victorbit8/elk -f DockerfileStep 4. Run the Docker Command to see the image that was created from above and push it to your repository in Doker Hub by running the Docker push command.
#Docker image ls.

#docker push victorbit8/elk
Step 5. Now we can create a container from the image above my issuing the Docker command below. Note: we added a port on which we can access the ELK stack outside the container. You can do further study on Docker networking from https://docs.docker.com/network/.
# docker run --privileged -p 5601:5601 -p 9200:9200 -p 5044:5044 -p 5300:5300/udp -p 12201:12201/udp victorbit8/elk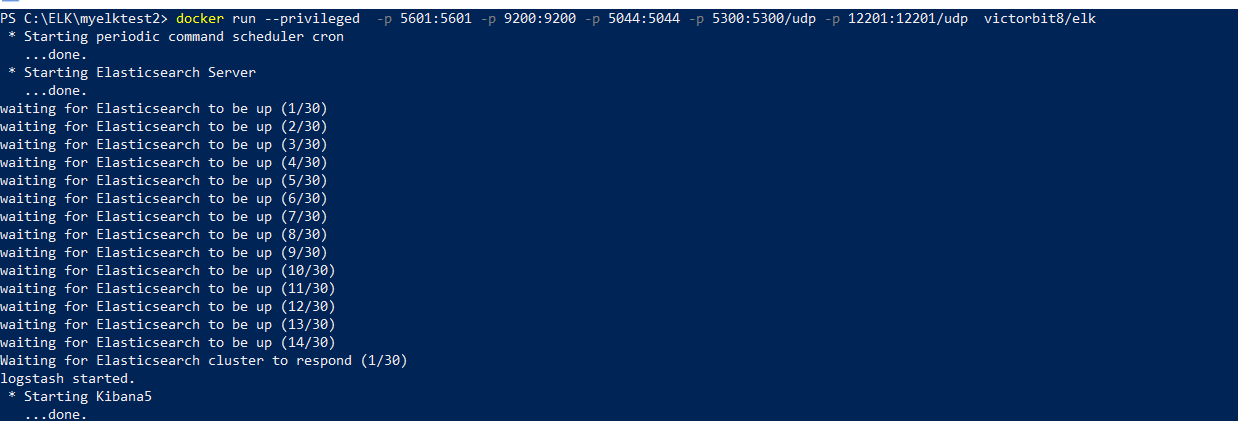
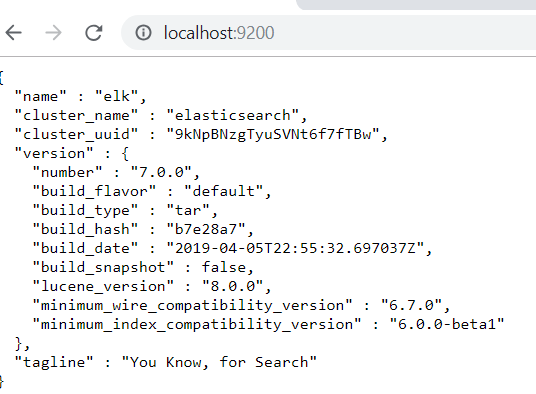
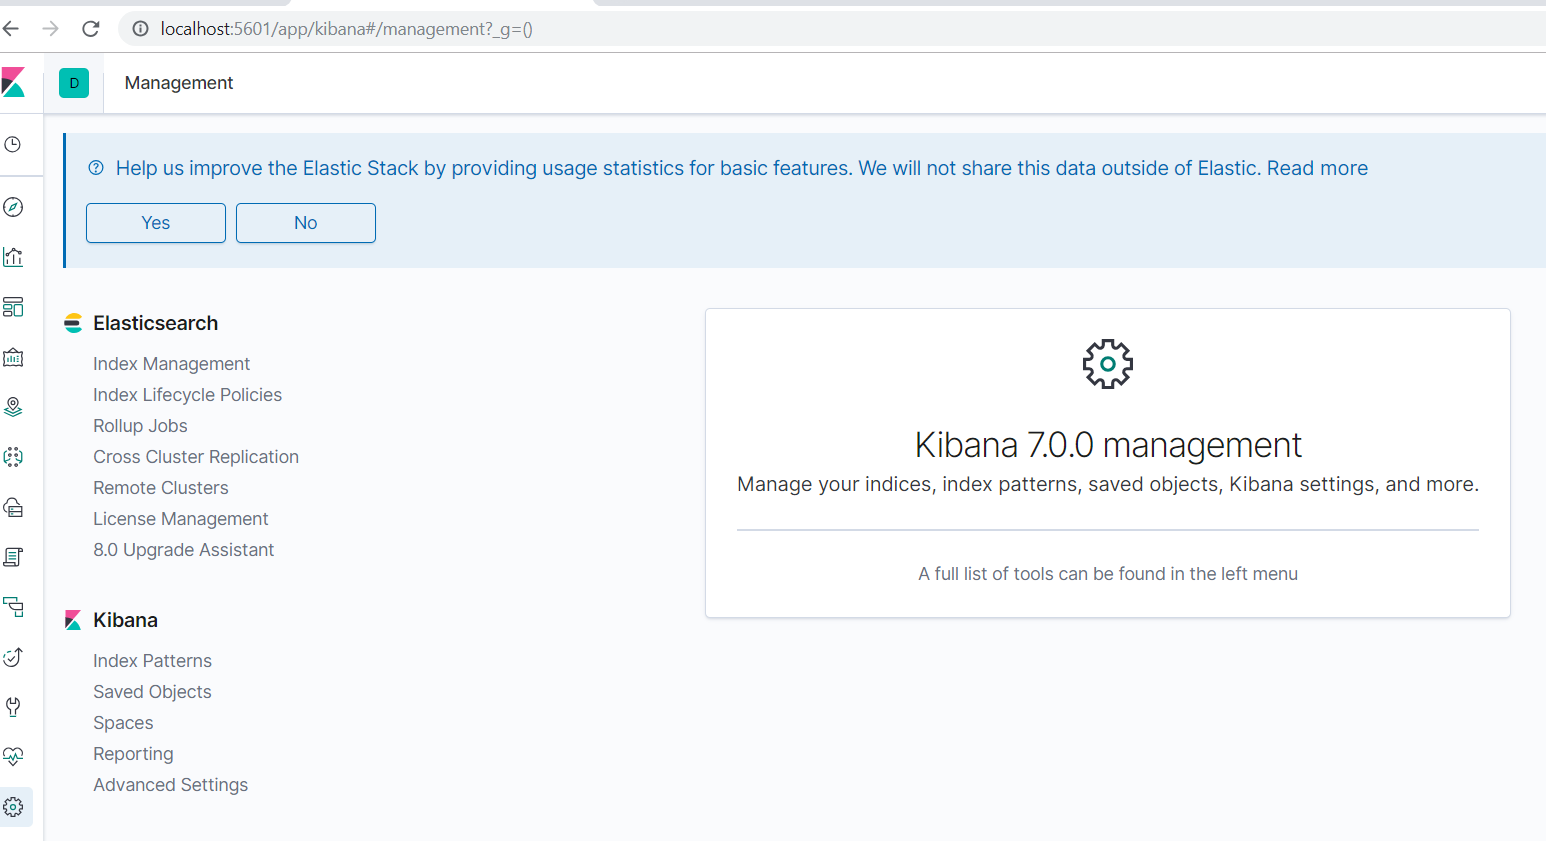
Step 6. Open a browser and go to http://localhost:9200/ for ELasticsearch and http://localhost:5601/ (or http://127.0.0.1:5601/) — you should see something like screen shot below.
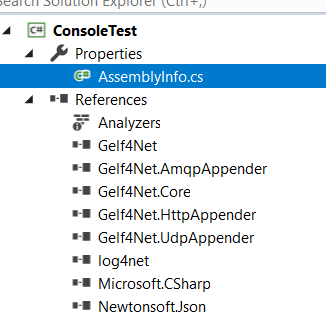
Step 6. Create a sample .NET Framework Console project using Visual Studio. Add a reference to log4net, Newtonsoft.json, and Gelf4Net from the NuGet package manager.
Step 7. Include a log4net.config file to the project as shown below. Notice we are using GelfUdpAppender. We have other appenders which we are not going to be using in this article.
<?xml version="1.0" encoding="utf-8"?>
<configuration>
    <configSections>
        <section name="log4net" type="log4net.Config.Log4NetConfigurationSectionHandler" />
    </configSections>
    <appSettings>
        <add key="log4net.Internal.Debug" value="true" />
    </appSettings>
    <log4net>
        <logger name="LogSendToElkAppender">
            <level value="ALL" />
            <appender-ref ref="GelfUdpAppender" />
        </logger>
        <appender name="GelfUdpAppender" type="Gelf4Net.Appender.GelfUdpAppender, Gelf4Net">
            <remoteAddress value="127.0.0.1" />
            <remotePort value="12201" />
            <layout type="Gelf4Net.Layout.GelfLayout, Gelf4Net">
                <param name="AdditionalFields" value="app:UdpAppender,version:1.0,Environment:Dev,Level:%level" />
                <param name="Facility" value="RandomPhrases" />
                <param name="IncludeLocationInformation" value="true" />
                <param name="SendTimeStampAsString" value="false" />
            </layout>
        </appender>
    </log4net>
</configuration>
Step 8. Add the below to assembly.cs class.
[assembly: log4net.Config.XmlConfigurator(ConfigFile = "log4net.config")]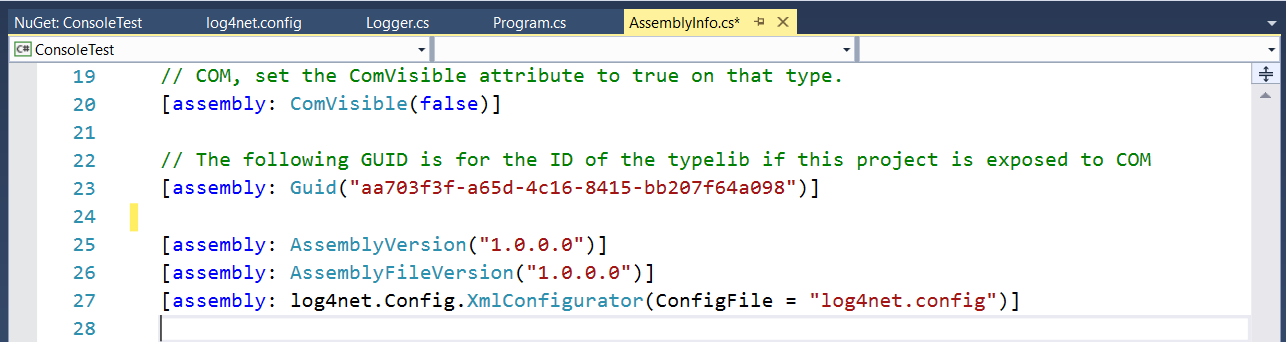
Step 9. Create a class called logger and paste in the below code.
using log4net;
namespace ConsoleTest
{
public class Logger
{
private static readonly ILog logSendToElk = log4net.LogManager.GetLogger("LogSendToElkAppender");
public static void logToELK(string message)
{
logSendToElk.Info(message);
}
}
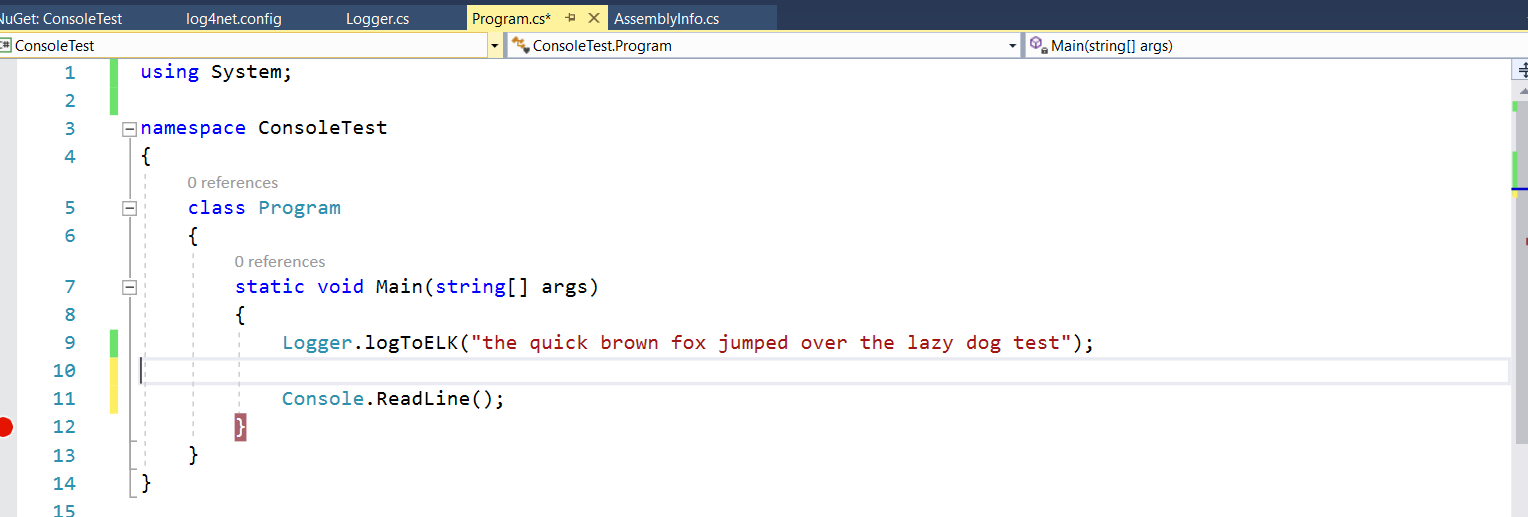
}Finally call the class method on the main method of program.cs
class Program
{
static void Main(string[] args)
{
Logger.logToELK("the quick brown fox jumped over the lazy dog test");
Console.ReadLine();
}
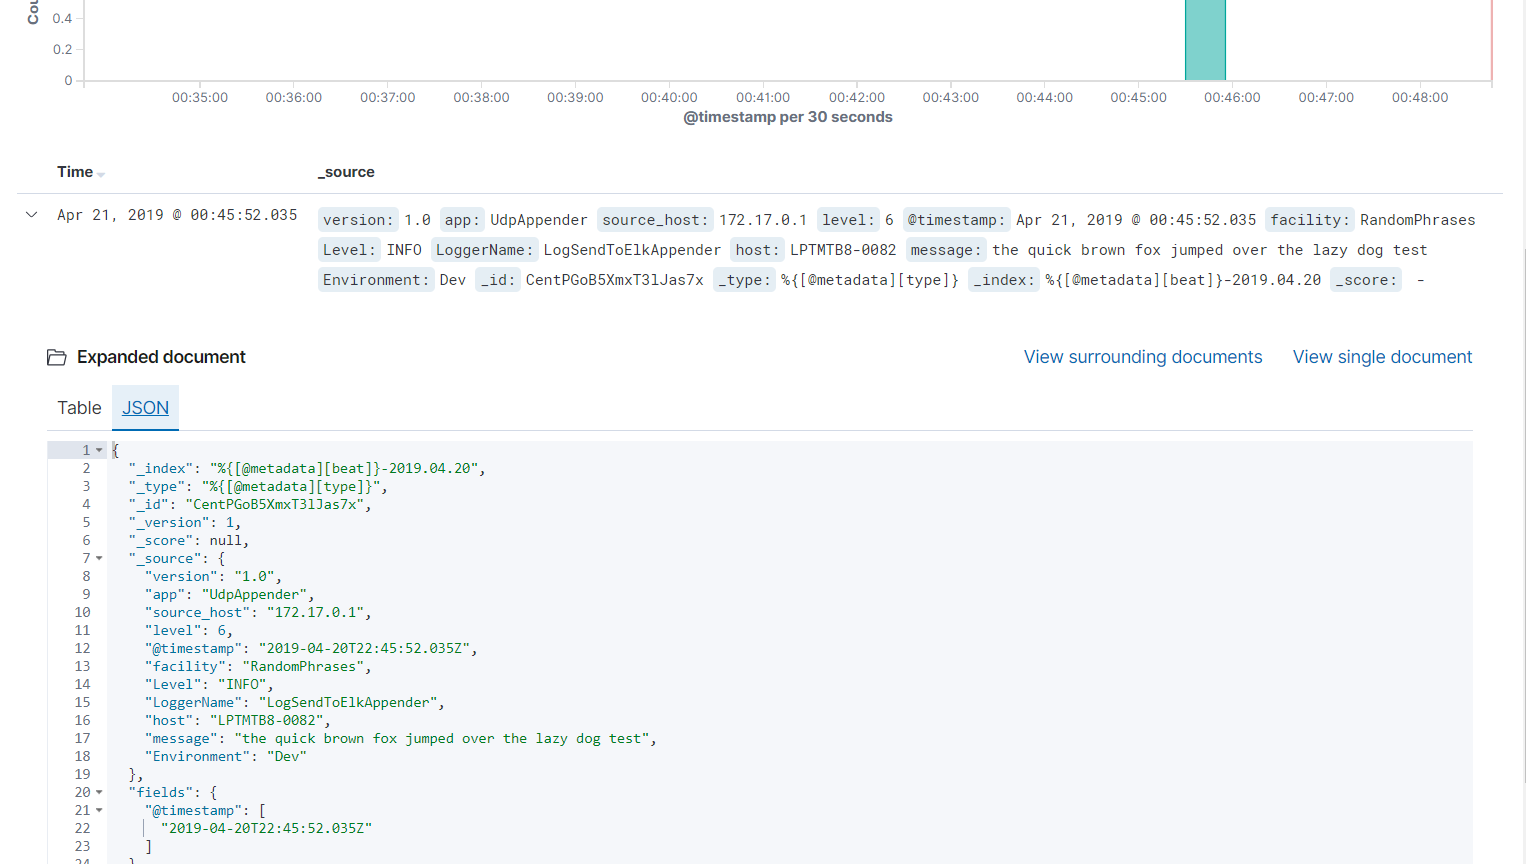
}Step 10. We will now execute the console program and view Kibana to see the log message. The Logstash service is listening on port 12201 via Udp and recieved the message and sent it to Elasticsearch. We can visualize the log by creating an index pattern with Kibana.
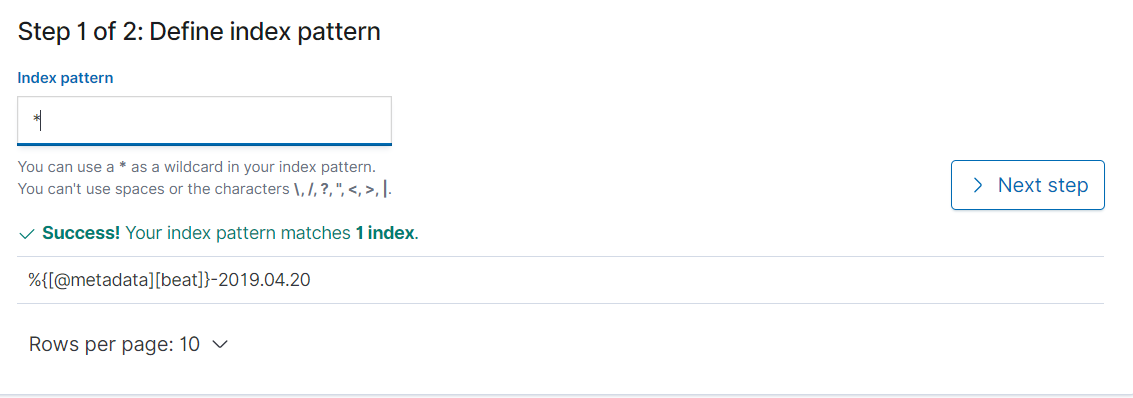
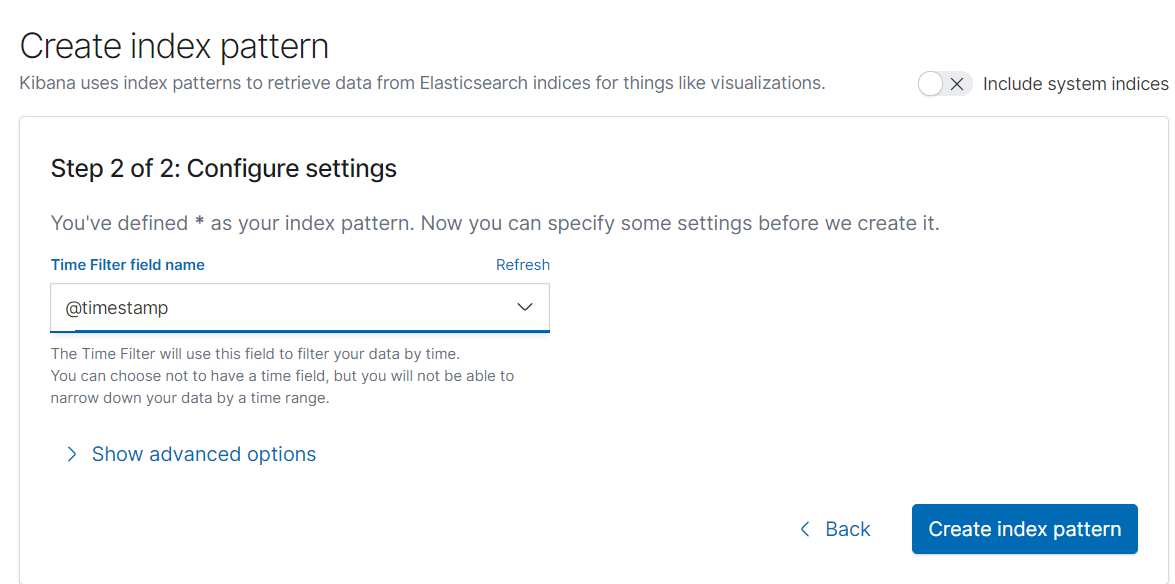
Step 11. We can now go to Kibana to see the log that was sent from our Visual Studio console project.
Opinions expressed by DZone contributors are their own.
Comments