Introduction to Elasticsearch and the ELK Stack, Part 1
In this post, we cover the frameworks that make up the ELK stack (Elasticsearch, Logstash, Kibana [plus Beats]) and how they all work together.
Join the DZone community and get the full member experience.
Join For FreeIn this article series, we are discussing Elasticsearch. In Part 1, we will start with an introduction of Elasticsearch and then will have a brief discussion of the so-called ELK stack. In Part 2, we will then move to the architecture of Elasticsearch and what the heck nodes are, plus a look into clusters, shards, indexes, documents, replication, and so on. So let's start.
Introduction to Elasticsearch
Elasticsearch is open source analytics and full-text search engine. It’s often used for enabling search functionality for different applications. For example, a blog for which you want users to be able to search for various kinds of data. That could be blog posts, products, categories, etc. You can actually build complex search functionalities with Elasticsearch, like auto-completion, handling synonyms, adjusting relevance, and so on.
Suppose, you want to implement a full-text search while taking a number of other factors into account, like rating and size of posts, and adjust the relevance of the results. Technically, Elasticsearch can do everything and anything you want from a "powerful" search engine and hence it doesn’t limit you to only full-text searches. You can even write queries for structured data and use that to make pie charts, allowing you to use Elasticsearch as an analytics platform.
Here are some of the common use cases where Elasticsearch or the ELK stack (Elasticsearch, Logstash, Kibana) can be used:
- Keep track of the number of errors in a web application.
- Keep track of memory usage of the server(s) and show the data on some line chart. This is popularly known as APM (Application Performance Management).
- Send events to Elasticsearch, where events can be website clicks, sales, new subscribers, logins, or anything like that under the sun.
One thing you might wonder about is how all this is done via Elasticsearch. Actually, in Elasticsearch, data is stored in the form of documents where a document is analogous to a row in a relational database, like MySQL. A document then contains fields which are similar to columns in a relational database. Technically, a document is nothing but a JSON object. For example, if you want to add a book object to Elasticsearch, your JSON object for that book may look something like this:
 {
     "name" : "The power of subconscious mind",
     "price" : $12.99,
     "categories" : ["self help", "motivational"]
    }
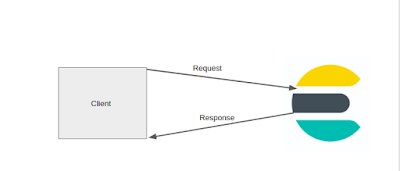
How do you query Elasticsearch? The answer is RESTful APIs:
The queries (which we will cover later) are also written as JSON objects.
Since Elasticsearch is distributed by nature, it scales very well in terms of increasing data volumes and query throughput. Hence, even if you have loads of data, the search is still going to be super fast. As a matter of fact, Elasticsearch is written in Java and is built on the top of Apache Lucene.
Now, before moving on with our journey of exploring Elasticsearch, let us give a quick overview of the ELK stack, which is also popularly known as the Elastic Stack.
Understanding the Elastic Stack
As we have already covered in the overview of Elasticsearch (which is really the heart of the Elastic Stack), we will give a brief overview of the other technologies in the Elastic Stack.
The technologies we are going to discuss generally interact with Elasticsearch in one way or another. Actually, for some of them, interacting with Elasticsearch is not mandatory, but there is a strong synergy between the technologies, so they are frequently used together for various purposes.
So, let us start with Kibana.
Kibana
Kibana is basically an analytics and visualization platform, which lets you easily visualize data from Elasticsearch and analyze it to make sense of it. You can assume Kibana as an Elasticsearch dashboard where you can create visualizations such as pie charts, line charts, and many others.
There are an infinite number of use cases for Kibana. For example, you can plot your website’s visitors onto a map and show traffic in real-time. Kibana is also where you configure change detection and forecasting. You can aggregate website traffic by the browser and find out which browsers are important to support based on your particular audience. Kibana also provides an interface to manage the authentication and authorization of Elasticsearch. You can literally think of Kibana as a web interface to the data stored on Elasticsearch.
It uses the data from Elasticsearch and basically just sends queries to Elasticsearch using the same REST API that can otherwise manually do this. Kibana provides an interface for building those queries and lets you configure how to display the results. In this sense, it saves you a lot of time because you don't have to implement all of this by yourself. You can easily create dashboards for System Administrators which shows the performance of servers. You can create dashboards for developers which shows application errors and API response times and what not.
As can be seen, you may store a lot of different kinds of data in Elasticsearch, apart from data that you want to search and present to your external users. In fact, you might not even use Elasticsearch for implementing search functionality at all. Using Elasticsearch as an analytics platform together with Kibana is a pretty common use case. There is an official demo for what Kibana can do on Elastic's site. You must check it out. Now, let's move onto Logstash.
Logstash
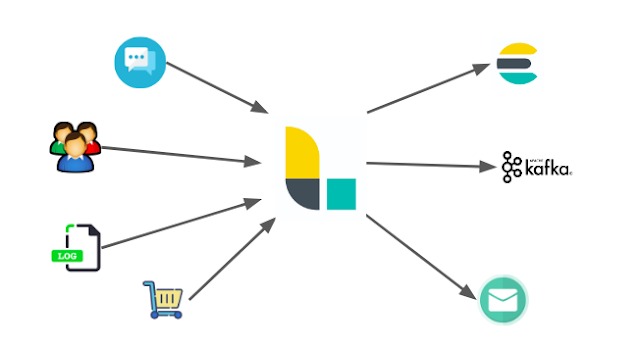
Traditionally, Logstash has been used to process logs from applications and send them to Elasticsearch, hence the name. That’s still a popular use case, but Logstash has evolved into a more general purpose tool, meaning that Logstash is a data processing pipeline. The data that Logstash receives will be handled as events, which can be anything of your choice. They could be log file entries, e-commerce orders, customers, chat messages, etc. These events are then processed by Logstash and shipped off to one or more destinations. A couple of examples could be Elasticsearch, a Kafka queue, an e-mail message, or to an HTTP endpoint.
A Logstash pipeline consists of three stages: an input stage, a filter stage, and an output stage. Each stage can make use of a plugin to do its task.
- Input Stage: The input stage is how Logstash receives the data. An input plugin could be: a file so that Logstash reads events from a file; an HTTP endpoint; a relational database; a Kafka queue Logstash can listen to; etc.
- Filter Stage: The filter stage is all about how Logstash processes the events received from the input stage plugins. Here we can parse CSV, XML, or JSON. We can also perform data enrichment, such as looking up an IP address and resolving its geographical location or looking up data in a relational database.
- Output Stage: An output plugin is where we send the processed events to. Formally, those places are called stashes. These places can be a database, a file, an Elasticsearch instance, a Kafka queue, and so on.
So, Logstash receives events from one or more input plugins at the input stage, processes them at the filter stage, and sends them to one or more stashes at the output stage. You can have multiple pipelines running within the same Logstash instance if you want to, and Logstash is horizontally scalable.
A Logstash pipeline is defined in a proprietary markup format that is somewhat similar to JSON. Technically, it’s not only a markup language, as we can also add conditional statements and make a Logstash pipeline dynamic.
A sample Logstash pipeline configuration:
 input {
      file {
           path => "/path/to/your/logfile.log"
      }
 }
 filter {
      if [request] in ["/robots.txt"] {
           drop {}
      }
 }
 output {
      file {
           path => "%{type}_%{+yyyy_MM_dd}.log"
      }
 }
Let us consider a basic use case of Logstash before moving to the other components of our ELK stack. Suppose that we want to process access logs from the web server. We can actually configure Logstash to read the log file, line by line, and consider each line as a separate event. This can be easily done by using the input plugin named “file,” but there is a handy tool named Beats that is far better for this task. We will discuss Beats in the next section.
Once Logstash receives a line, it can process it further. Technically, a line is just a string, a collection of words, and we need to parse this string so that we can fetch valuable information out of it, like the status code, request paths, the IP address, and so on. We can do so by writing a "Grok" pattern, which is somewhat similar to a regular expression, to match pieces of information and save them into fields. Now suppose our "stash" here is Elasticsearch, we can easily save our processed bits of information stored in fields to the Elasticsearch as JSON objects.
Beats
Beats is basically a collection of data shippers. Data shippers are basically lightweight agents with a particular purpose. You can install one or more data shippers on your server(s) as per the requirements. They then send data to Elasticsearch or Logstash. There is n number of data shippers and each data shipper is called a beat. Each beat or data shipper collects different kinds of data and hence serves different purposes.
For example, there is a beat named Filebeat, which is used for collecting log files and sending the log entries off to either Logstash or Elasticsearch. Filebeat ships with modules for common log files, such as nginx, the Apache web server, or MySQL. This is very useful for collecting log files such as access logs or error logs.
Read more about Beats here.
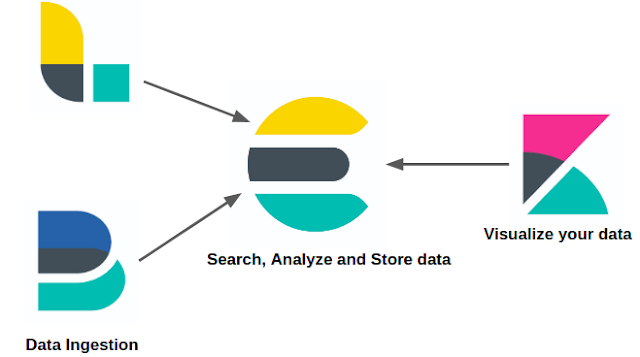
To summarize, we can look at Elastic Stack as:
Let us put all of the pieces together now. The center of the Elastic Stack is Elasticsearch, which contains the data. The process of ingesting data into Elasticsearch can be done with Beats and/or Logstash, but also directly through Elasticsearch’s API. Kibana is a user interface that sits on top of Elasticsearch and lets you visualize the data that it retrieves from Elasticsearch through the API. There is nothing Kibana does that you cannot build yourself, and all of the data that it retrieves is accessible through the Elasticsearch API. Hence, Kibana is a wonderful tool that can save a lot of time, as now you do not have to build dashboards yourself.
That's all for Part 1! Tune back in tomorrow when we'll cover the architecture of Elasticsearch.
Published at DZone with permission of Ayush Jain. See the original article here.
Opinions expressed by DZone contributors are their own.


Comments