Document Generation With Dynamic Image Generation
Using dynamic images in a document generation process to make the dynamic even more dynamic.
Join the DZone community and get the full member experience.
Join For FreeOne of the fascinating aspects of Adobe Document Generation is how incredibly flexible it is. One aspect of the API that can enhance the final result is the ability to include images in your template. In a typical use case, you would provide a static image defined in your data used with the API. In this blog post, I will demonstrate a more advanced example — dynamically generating images, in our case, charts, on the fly.
The Basics
Before we get into a more advanced demo, let’s quickly cover the basics. (My coworker has an intense look into Document Generation and images you should check out.) As our docs describe, using a dynamic image in your Word template requires a few steps.
First, you add an image to your document. It doesn’t matter what image you pick, it’s just a placeholder, but you’ll want to place it in your document as you like and ensure you’ve sized it as expected. Once done, you right-click on the image and select the “Edit Alt Text” option. In that alt text, you supply JSON:
xxxxxxxxxx
{
"location-path": "logo",
"image-props": {
"alt-text": "This is an alt-text for the image placeholder"
}
}
The location-path property must point to the key-value used in your data that includes the image data. So, for example, given the above location-path value, the data I use with the API could look like so:
xxxxxxxxxx
{
"name":"Some Random Name",
"age": 48,
"logo": "<base64 encoded image>"
}
As the example demonstrates, the image data must be a Base64 encoded version of the image. If you’ve never seen that before, it looks somewhat like this:
"data:image/png;base64,aVeryLongListofCharacters"
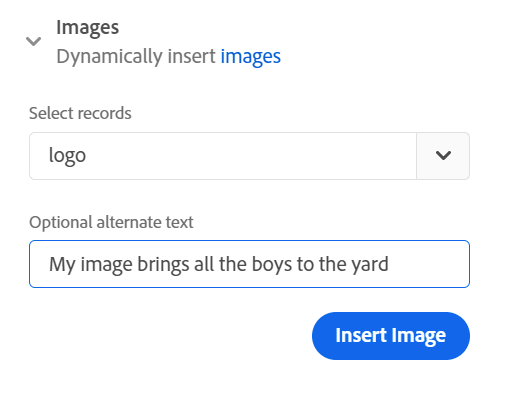
You can also use the Word Add On to insert images for you. If the sample data you added includes a Base64 value, you can select it in the Images portion of the Advanced tab.
So, you can already dynamically change the image in the final result PDF or Word document at this point. To do so, you swap out the value. Imagine you’ve got two options for an image in your document, a picture of a cat or a dog. You embed a placeholder image in the Word template and link it to a value, pet. Before sending your template and data to the Document Generation API, you would use the correct value:
xxxxxxxxxx
// data is the object you will pass to the API, it's got stuff already
if(thisPersonIsVeryCool) {
data.pet = catBase64ImageData;
} else {
data.pet = dogBase64ImageData;
}
// now call our API and pass the template and data
As you can see, depending on some particular boolean value, the data will either have the encoded version of the cat or dog picture. (Obviously, one is better than the other, and I’m talking about the cat.)
While this qualifies as dynamic, we can take it a step further.
Using Dynamic Images
We will create a document describing the number of cats in a shelter over the previous six months for our scenario. This data is returned from an internal reporting system and can be represented like so:
xxxxxxxxxx
{
"numberOfCats": [
{"date":"11/2020", "amount":210},
{"date":"12/2020", "amount":354},
{"date":"1/2021", "amount":321},
{"date":"2/2021", "amount":337},
{"date":"3/2021", "amount":298},
{"date":"4/2021", "amount":274}
]
}
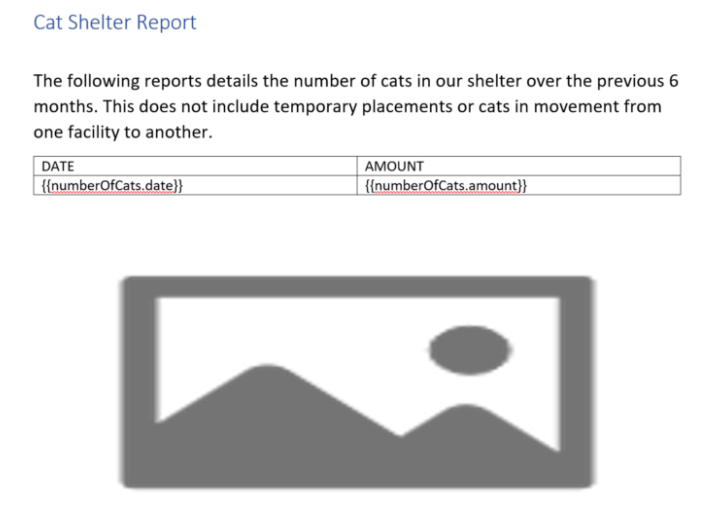
The data consists of an array of values ordered from oldest to newest. Each item in the array has a date stamp and a numeric amount. Let’s start with a template that has a table of data.
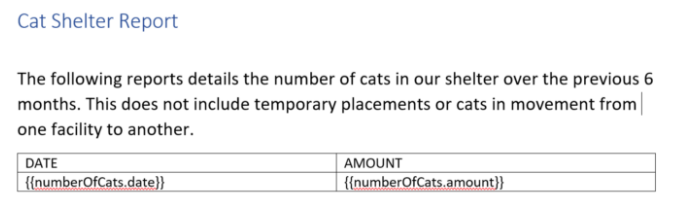
By itself, it’s nice and straightforward and outputs cleanly. Here’s what the PDF looks like when generated:
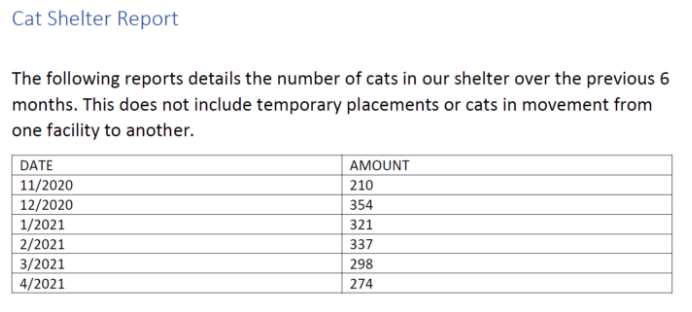
It “works,” but a chart could make it easier to read. You could more clearly see trends over time and make better judgments based on the data provided. But how do we get a dynamic chart into the Word template?
First, we need to find a service that can create the chart while also, which is the crucial part, giving us access to the raw image data of the chart. There are a thousand charting services out there, specifically for web developers. However, many of these charting libraries will render their library in a browser environment and when the JavaScript of a particular web page is viewed. We need a service that creates an actual image that could be requested via our server-side code and translated into Base64.
For our demo we are going to make use of QuickChart. QuickChart is a “service wrapper” around the open source Chart.js package. It basically takes the functionality of Chart.js and lets you get static images of charts by crafting a URL. For example, consider this URL:
https://quickchart.io/chart?c={type:'bar',data:{labels:['Q1','Q2','Q3','Q4'], datasets:[{label:'Users',data:[50,60,70,180]},{label:'Revenue',data:[100,200,300,400]}]}}
You can see a URL parameter defining various aspects of the chart, including the type (bar), the labels, and the actual data. You can see the result of that here:
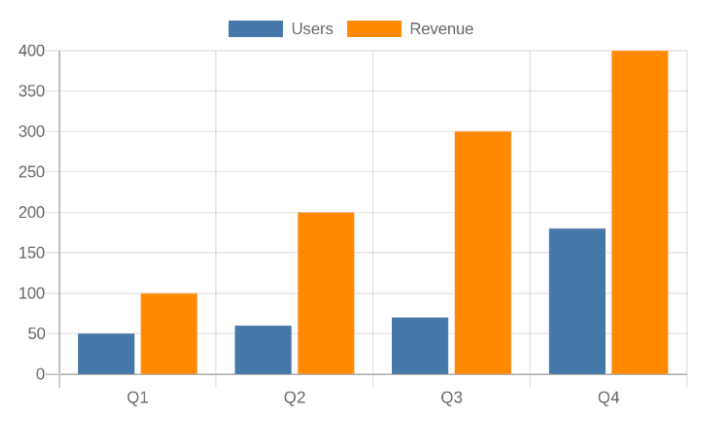
While the URL is a bit complex (and can be even more complex), it provides a solution to our issue. Given that we have our data from our internal AP, we must “rewrite” it in a URL that works for QuickChart.
I built that first. It takes in my ordered data to create a URL on QuickChart that uses the line graph format and specifies a specific height and width. Here’s that function:
xxxxxxxxxx
function generateQuickChartURL(arr) {
let labels = arr.map(d => d.date);
let data = arr.map(d => d.amount);
let url = `https://quickchart.io/chart?c={type:'line',data:{labels:${JSON.stringify(labels)},datasets:[{label:'Cats',data:${JSON.stringify(data)}}]}}&width=500&height=300`;
return url;
}
Perhaps I would modify it here if I wanted to add more chart features, like custom colors. With that done, I added a placeholder image to my Word doc and specified the size. Ben covers this as tip #6 in his excellent article, Adobe Document Generation API: Working with Images.
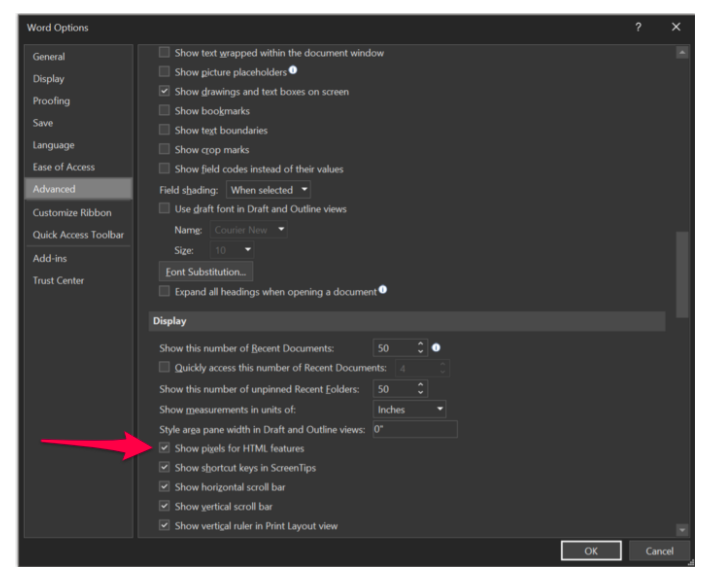
One thing I would add to this recommendation is to switch Word to use pixel height and width for images instead of inches. In your Word settings, under Advanced, go to Display and enable “Show pixels for HTML features”:
We can set a specific height and width (500 by 300) for the image and center it right beneath the table with this enabled.
The alt text for the image looks like so:
xxxxxxxxxx
{
"location-path": "image"
}
As a reminder, when we pass our data to the Document Generation API, it will expect the image key to containing the Base64 data of our image. How do we do that? With another function!
xxxxxxxxxx
async function urlToBase64(url) {
let resp = await fetch(url);
let header = resp.headers.get('content-type');
let body = await resp.arrayBuffer();
data = 'data:' + resp.headers.get('content-type') + ';base64,' + Buffer.from(body).toString('base64');
return data;
}
The urlToBase64 function does precisely what it sounds like - it hits a remote URL, gets the data, and converts it. Now we have all the parts we need, let's look at a complete example:
xxxxxxxxxx
const PDFToolsSdk = require('@adobe/documentservices-pdftools-node-sdk');
const fs = require('fs');
const fetch = require('node-fetch');
(async () => {
let input = './catreport.docx';
let data = JSON.parse(fs.readFileSync('./cats.json'));
let output = './catreport.pdf';
if(fs.existsSync(output)) fs.unlinkSync(output);
let url = generateQuickChartURL(data.numberOfCats);
// get my image
data.image = await urlToBase64(url);
await generateFromTemplate(input, data, output, './pdftools-api-credentials.json');
})();
/*
I'm specifically designed to return a url for a line item chart based on my cat array
- must include 'date' and 'amount'
*/
function generateQuickChartURL(arr) {
let labels = arr.map(d => d.date);
let data = arr.map(d => d.amount);
let url = `https://quickchart.io/chart?c={type:'line',data:{labels:${JSON.stringify(labels)},datasets:[{label:'Cats',data:${JSON.stringify(data)}}]}}&width=500&height=300`;
return url;
}
async function urlToBase64(url) {
let resp = await fetch(url);
let header = resp.headers.get('content-type');
let body = await resp.arrayBuffer();
data = 'data:' + resp.headers.get('content-type') + ';base64,' + Buffer.from(body).toString('base64');
return data;
}
async function generateFromTemplate(template, data, dest, creds) {
return new Promise((resolve, reject) => {
// Initial setup, create credentials instance.
const credentials = PDFToolsSdk.Credentials
.serviceAccountCredentialsBuilder()
.fromFile(creds)
.build();
// Create an ExecutionContext using credentials.
const executionContext = PDFToolsSdk.ExecutionContext.create(credentials);
const documentMerge = PDFToolsSdk.DocumentMerge,
documentMergeOptions = documentMerge.options;
//dest determines if Word or PDF
let format;
let destExt = dest.split('.').pop().toLowerCase();
if(destExt === 'docx') format = documentMergeOptions.OutputFormat.DOCX;
else if(destExt === 'pdf') format = documentMergeOptions.OutputFormat.PDF;
else throw('Invalid destination extension')
// Create a new DocumentMerge options instance.
options = new documentMergeOptions.DocumentMergeOptions(data, format);
// Create a new operation instance using the options instance.
const documentMergeOperation = documentMerge.Operation.createNew(options);
// Set operation input document template from a source file.
const input = PDFToolsSdk.FileRef.createFromLocalFile(template);
documentMergeOperation.setInput(input);
// Execute the operation and Save the result to the specified location.
documentMergeOperation.execute(executionContext)
.then(result => result.saveAsFile(dest))
.then(() => resolve(true))
.catch(err => {
if(err instanceof PDFToolsSdk.Error.ServiceApiError
|| err instanceof PDFToolsSdk.Error.ServiceUsageError) {
console.log('Exception encountered while executing operation', err);
reject(err);
} else {
console.log('Exception encountered while executing operation', err);
reject(err);
}
});
});
}
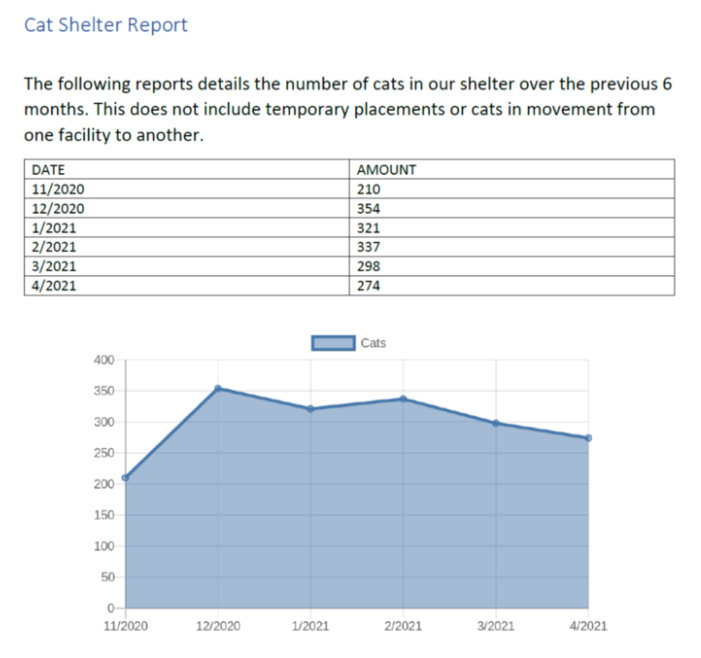
Taking it from the top, I begin by specifying variables for my input, data, and output. My cat data, in this case, is a complex coded JSON file, as shown above. I then call generateQuickChatURL with my data and assign the result to the image value. Finally, this gets passed to a utility function (generateFromTemplate) that uses our SDK to create the PDF. Here’s how the final PDF looks:
Published at DZone with permission of Raymond Camden, DZone MVB. See the original article here.
Opinions expressed by DZone contributors are their own.
Comments