How Doris SQL Cache Saved My Daily Morning Meetings
Doris SQL Cache can intelligently remember query results and make repetitive queries as smooth as silk, thus significantly improving query performance.
Join the DZone community and get the full member experience.
Join For Free"Xiao Zhang, why hasn't this SQL query finished after 5 minutes?"
"I checked this data yesterday; why does it take so long today?"
"The morning meeting is about to start, and the report is still loading..."
Do these complaints sound familiar? As a DBA or data engineer, you've likely experienced the awkward moments of being "swarmed" by users. Faced with repetitive query demands, the system acts like a "forgetful patient," recalculating every time, which is truly frustrating.
However, today, I want to introduce a special "memory master" — Doris SQL Cache, which can intelligently remember query results and make repetitive queries as smooth as silk. Say goodbye to the hassle of repeated calculations and let your system performance soar!
Doris' Efficient Caching Engine
Every morning at 9 a.m., the operations team queries yesterday's sales data. Everyone runs the same SQL, putting immense pressure on the system. Watching the growing concurrent requests, the DBA is very frustrated...
In the field of data analysis, repetitive queries are a common phenomenon. Xiao Wang checks the sales report daily, and Xiao Li counts user growth daily; these query logics are often very similar. If every query has to be recalculated, isn't that a waste of resources?
Doris' SQL Cache is like an intelligent coffee machine. The first cup of coffee needs to be freshly ground and brewed, but subsequent cups can be enjoyed directly. It dramatically improves query performance by intelligently caching query results.
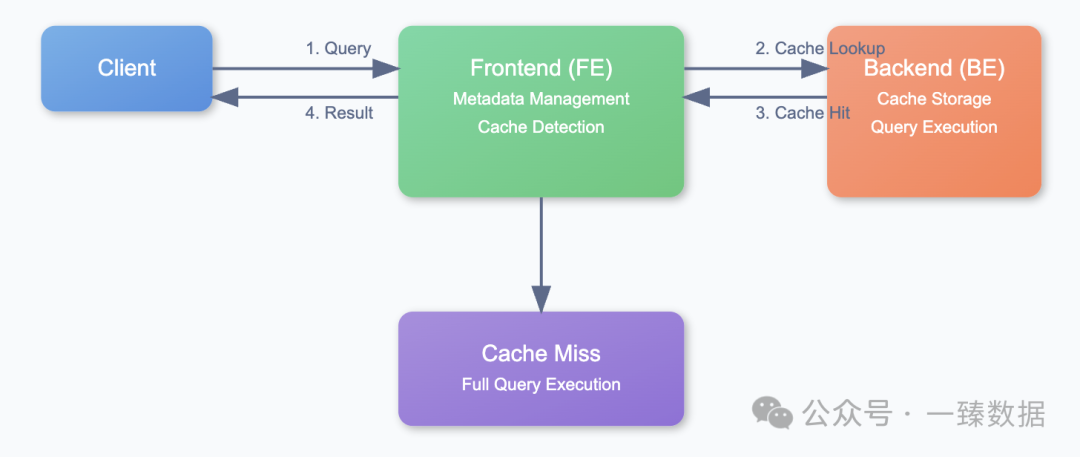
When a query request arrives, Doris performs a series of precise matches: Is the SQL text the same? Has the table version changed? Are the permissions consistent? It's like a barista confirming your taste and requirements. Only when all conditions match can you enjoy the fast response brought by the cache.
Let's look at a sales data analysis scenario:
-- Enable SQL Cache for the current session
set enable_sql_cache=true;

-- Analyze yesterday's sales data
SELECT
    province,
    SUM(sales_amount) as total_sales,
    COUNT(DISTINCT user_id) as buyer_count
FROM sales_detail
WHERE dt = '2025-02-09'
GROUP BY province;
The first time this query is executed, Doris fetches data from the BE nodes and calculates it. Subsequent identical queries can directly obtain results from the cache, reducing response time from seconds to milliseconds. This is a real shot in the arm for the daily morning sales analysis report.
Making Cache Manageable With Doris
Having a caching mechanism is not enough; Doris also provides a wealth of SQL Cache monitoring metrics to help users effectively monitor the cache.
Through the FE's HTTP interface, we can see the number of cache hits:
# FE's HTTP interface http://${FE_IP}:${FE_HTTP_PORT}/metrics

# Indicates that 1 SQL has been written to the cache
doris_fe_cache_added{type="sql"} 1

# Indicates two SQL Cache hits
doris_fe_cache_hit{type="sql"} 2
Through the BE's metrics, we can track the memory size occupied by the cache:
# BE's HTTP interface http://${BE_IP}:${BE_HTTP_PORT}/metrics

# Indicates that there are currently 1205 Caches in the BE's memory
doris_be_query_cache_sql_total_count 1205

# Indicates that all Caches currently occupy 44k of BE memory
doris_be_query_cache_memory_total_byte 44101
These metrics are like a "health check" for the cache, allowing us to monitor its status at any time.
To avoid excessive cache memory usage, Doris also provides flexible memory control mechanisms:
1. FE Memory Control
-- Store up to 100 Cache metadata entries; release the least recently used metadata when exceeded. Default value is 100.
ADMIN SET FRONTEND CONFIG ('sql_cache_manage_num'='100');

-- Automatically release metadata that has not been accessed for 300 seconds. Default value is 300.
ADMIN SET FRONTEND CONFIG ('expire_sql_cache_in_fe_second'='300');

-- By default, do not create SQL Cache if the result exceeds 3000 rows.
ADMIN SET FRONTEND CONFIG ('cache_result_max_row_count'='3000');

-- By default, do not create SQL Cache if the result exceeds 30M.
ADMIN SET FRONTEND CONFIG ('cache_result_max_data_size'='31457280');
2. BE Memory Control
-- When the cache memory space exceeds query_cache_max_size_mb + query_cache_elasticity_size_mb,
-- release the least recently used cache until the memory usage is below query_cache_max_size_mb.
query_cache_max_size_mb = 256
query_cache_elasticity_size_mb = 128
This is like setting an upper limit on the coffee machine's water storage, ensuring performance while avoiding resource waste.
Practical Case: Turning the Ordinary into the Extraordinary
Back to the beginning. Xiao Zhang is a DBA for an e-commerce platform and encountered a tricky problem: every morning at 9 a.m., the system's CPU usage spikes to 90%, and response times soar from milliseconds to seconds. After investigation, it was found that, at this time, many operations personnel were querying yesterday's sales data.
Let's see how Xiao Zhang leveraged Doris SQL Cache to its fullest potential:
Time Window Optimization
In sales data analysis, we often use the now() function to get the current time. Every second, the return value of this function changes, causing the cache to frequently expire. A smart approach is to adjust the time granularity to be coarser:
-- Before optimization: Poor cache performance
SELECT * FROM sales WHERE create_time > now();

-- After optimization: Cache can be reused within a day
SELECT * FROM sales WHERE dt = DATE(now());
Query Pattern Optimization
In report analysis scenarios, we often need to count data across various dimensions. Instead of querying each dimension separately, it's better to merge related dimension statistics into one query:
-- Before optimization: Multiple queries, poor cache performance
SELECT COUNT(*) FROM orders WHERE dt='2025-02-08';
SELECT SUM(amount) FROM orders WHERE dt='2025-02-08';

-- After optimization: One query, fully utilizing the cache
SELECT
    COUNT(*) as order_count,
    SUM(amount) as total_amount
FROM orders
WHERE dt='2025-02-08';
By enabling SQL Cache and optimizing query patterns, the problem was perfectly solved:
- CPU usage dropped below 50%
- Query response time decreased from 2 seconds to 50 milliseconds
- The operations team no longer had to worry about system lag
Xiao Zhang's experience tells us that SQL Cache improves query performance and significantly reduces system resource consumption.
Stay tuned for more interesting, useful, and valuable content in the next issue!
Published at DZone with permission of Zen Hua. See the original article here.
Opinions expressed by DZone contributors are their own.
Comments