Estimating Statistics via Bootstrapping and Monte Carlo Simulation
Join the DZone community and get the full member experience.
Join For FreeWe want to estimate some "statistics" (e.g. average income, 95
percentile height, variance of weight ... etc.) from a population.
It will be too tedious to enumerate all members of the whole
population. For efficiency reason, we randomly pick a number samples
from the population, compute the statistics of the sample set to
estimate the corresponding statistics of the population. We understand
the estimation done this way (via random sampling) can deviate from the
population. Therefore, in additional to our estimated statistics, we
also include a "standard error" (how big our estimation may be deviated
from the actual population statistics) or a "confidence interval" (a
lower and upper bound of the statistics which we are confident about
containing the true statistics).
The challenge is how do we estimate the "standard error" or the
"confidence interval". A straightforward way is to repeat the sampling
exercise many times, each time we create a different sample set from
which we compute one estimation. Then we look across all estimations
from different sample sets to estimate the standard error and confidence
interval of the estimation.
But what if collecting data from a different sample set is expensive, or
for any reason the population is no longer assessable after we
collected our first sample set. Bootstrapping provides a way to address
this ...
Bootstrapping
Instead of creating additional sample sets from the population, we create additional sample sets by re-sampling data (with replacement) from the original sample set. Each of the created sample set will follow the same data distribution of the original sample set, which in turns, follow the population.R provides a nice "bootstrap" library to do this.
> library(boot)
> # Generate a population
> population.weight <- rnorm(100000, 160, 60)
> # Lets say we care about the ninety percentile
> quantile(population.weight, 0.9)
     90%
236.8105
> # We create our first sample set of 500 samples
> sample_set1 <- sample(population.weight, 500)
> # Here is our sample statistic of ninety percentile
> quantile(sample_set1, 0.9)
     90%
232.3641
> # Notice that the sample statistics deviates from the population statistics
> # We want to estimate how big is this deviation by using bootstrapping
> # I need to define my function to compute the statistics
> ninety_percentile <- function(x, idx) {return(quantile(x[idx], 0.9))}
> # Bootstrapping will call this function many times with different idx
> boot_result <- boot(data=sample_set1, statistic=ninety_percentile, R=1000)
> boot_result

ORDINARY NONPARAMETRIC BOOTSTRAP


Call:
boot(data = sample_set1, statistic = ninety_percentile, R = 1000)


Bootstrap Statistics :
    original   bias    std. error
t1* 232.3641 2.379859     5.43342
> plot(boot_result)
> boot.ci(boot_result, type="bca")
BOOTSTRAP CONFIDENCE INTERVAL CALCULATIONS
Based on 1000 bootstrap replicates

CALL :
boot.ci(boot.out = boot_result, type = "bca")

Intervals :
Level       BCa
95%   (227.2, 248.1 )
Calculations and Intervals on Original Scale
Here is the visual output of the bootstrap plot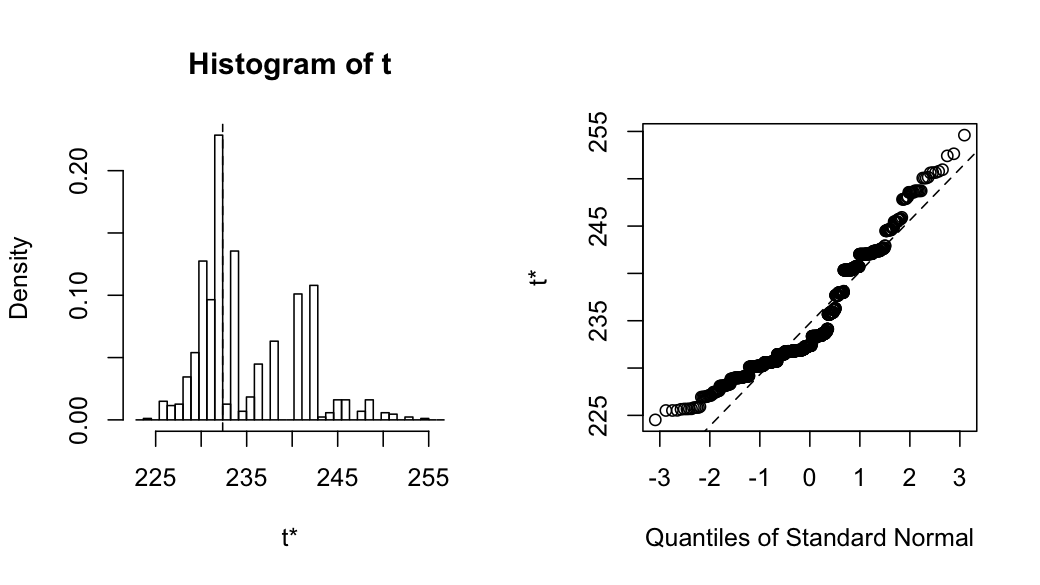
Bootstrapping is a powerful simulation technique for estimate any statistics in an empirical way. It is also non-parametric because it doesn't assume any model as well as parameters and just use the original sample set to estimate the statistics.
If we assume certain distribution model want to see the distribution of certain statistics. Monte Carlo simulation provides a powerful way for this.
Monte Carlo Simulation
The idea is pretty simple, based on a particular distribution function (defined by a specific model parameters), we generate many sets of samples. We compute the statistics of each sample set and see how the statistics distributed across different sample sets.For example, given a normal distribution population, what is the probability distribution of the max value of 5 randomly chosen samples.
> sample_stats <- rep(0, 1000)
> for (i in 1:1000) {
+     sample_stats[i] <- max(rnorm(5))
+ }
> mean(sample_stats)
[1] 1.153008
> sd(sample_stats)
[1] 0.6584022
> par(mfrow=c(1,2))
> hist(sample_stats, breaks=30)
> qqnorm(sample_stats)
> qqline(sample_stats)
Here is the distribution of the "max(5)" statistics, which shows some right skewness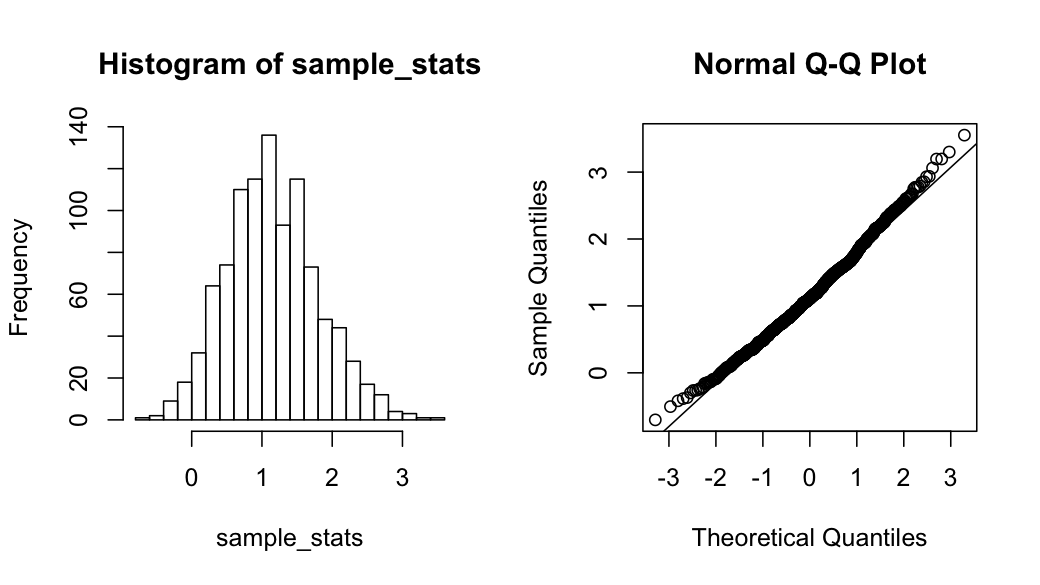
Bootstrapping and Monte Carlo simulation are powerful tools to estimate statistics in an empirical manner, especially when we don't have an analytic form of solution.
Published at DZone with permission of Ricky Ho. See the original article here.
Opinions expressed by DZone contributors are their own.
Comments