Exploring IBM App Connect Enterprise 12.0.10.0
In this article, we take a dive into some of the features of IBM App Connect Enterprise 12.0.10.0 and explore how developers can use them for their integration needs.
Join the DZone community and get the full member experience.
Join For FreeWe'll explore seven of the features released in IBM App Connect Enterprise 12.0.10.0 and provide a high-level overview of each;
- Toolkit:
- Simple JSON Mapping within the Discovery Connector Request nodes.
- New button to open workspace file system location.
- WebUI:
- New Record and Replay views with Hex and Base64 encoding.
- Resource Manager views.
- New Change Data Capture node for integrating with PostgreSQL and DB2.
- Built-in ODBC driver for integration with PostgreSQL databases.
- Importing and exporting credentials using the mqsivault command.
- Configuring an Integration Server's JRE - Java 11 changes.
- Open Telemetry platform support extended to include AIX and pLinux.
Toolkit
Simple JSON Mapping Within the Discovery Connector Request Nodes
For the last few mod releases of App Connect Enterprise, we have rapidly expanded the number of available Discovery Connector message flow nodes - both input nodes to trigger a message flow and also mid-flow request nodes. In total, the Toolkit now provides 86 such nodes.
To further improve the usability for developers wanting to integrate with application endpoints, we have also provided an easy way to map between data structures. App Connect Enterprise 12.0.10.0 introduces the concept of executing mapping logic as part of a Discovery Connector node. This is done using the JSONata expression language capabilities which were first made available as part of the web browser-based Designer authoring experience. For more information about JSONata, which itself is an open-source technology, check out the website here, which also includes a JSONata exerciser.
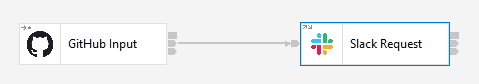
To demonstrate this new Toolkit message flow capability, consider a simple scenario of triggering a flow when a GitHub issue is created and then writing a message to a Slack channel. Previously, a scenario like this one would have required an intervening message flow node such as a Compute node, JavaCompute node, or Graphical Data Map node between the GitHub Input and the Slack Request nodes, but now we can wire the nodes together directly, and apply the mapping task as part of the Slack Request node:
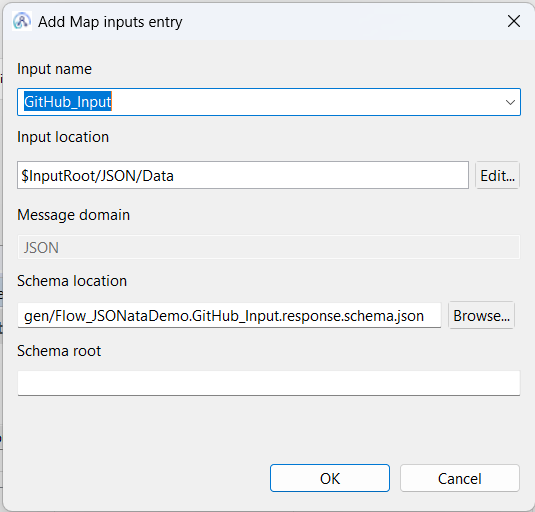
Once the two message flow nodes have been configured using the connector discovery process, return to the Slack Request message flow node and switch to the Request properties tab. On the Request Properties tab, you will find a Map inputs table, which describes specific parts of the Message Assembly (and the schemas that define them) that you may want to use when carrying out a mapping task. By default, the table is pre-populated with data describing a generic input message (scroll down a bit further to see a picture) and the structured parts of the LocalEnvironment tree. In this example, we're going to add an entry to the Map inputs table, which describes the data that is sent out of the GitHub Input node and passed into the Slack Request node. In circumstances like this one, where there is a preceding message flow node that defines the structure of the data arriving on this node's input terminal, then the schema will helpfully be located for you and automatically shown as a pre-filled option to use when you click the Add button, as shown below:
Click OK, and then the Map inputs table will now have a new row that represents the message structure from the GitHub Input node: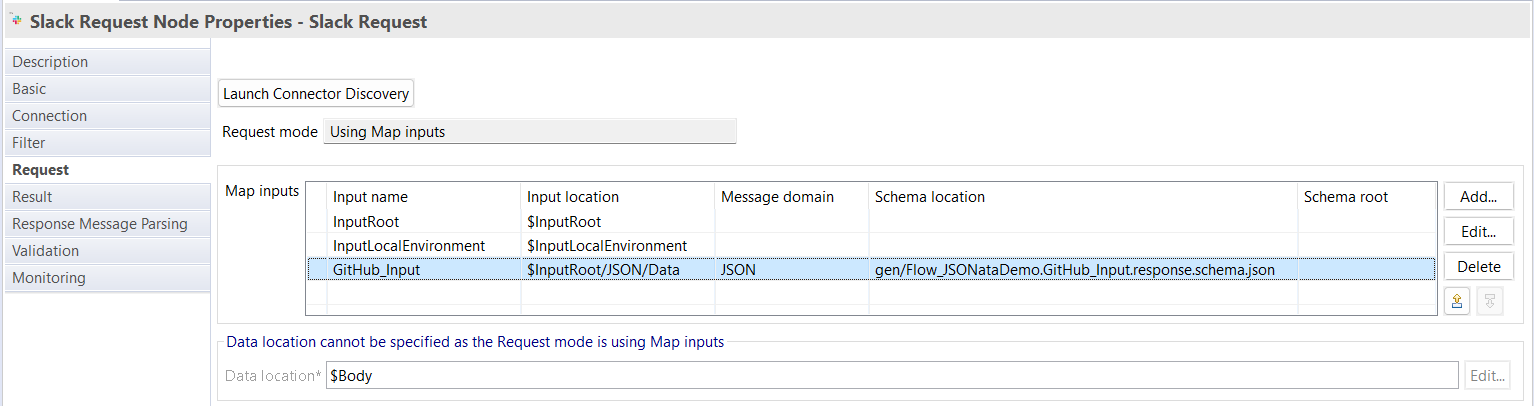
Now, when you Launch Connector Discovery, the GitHub data structure defined within the JSON schema(s) will be available when creating mappings; in this simple example, we wish to build up a field called Text, which represents the message that will be sent to a Slack channel. We want this message to have inserts representing the Title of the GitHub issue (whose creation originally triggered the flow) and its Issue Number:

Once the mapping has been saved and the message flow has been deployed, it can be triggered by the creation of a new Issue in GitHub. You can use the Toolkit Flow Exerciser to track the data through the flow as shown: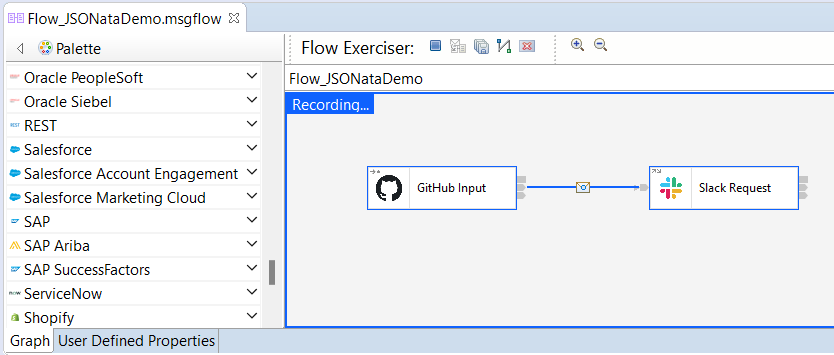
Clicking on the wire connecting the two nodes shows the Message Assembly, which represents the logical tree structure that is passed through the flow:
The output message is written to the Slack channel by the Slack Request node:

The same concept of using a Map inputs table on a Discovery Connector node's properties to define JSON structures can be applied to all the Discovery Connector nodes. This makes the task of mapping output data structures very user-friendly, and for some users, it will be dramatically simpler than having to write code. If you would prefer to avoid this approach and continue to write Compute node ESQL, use a GDM map node, or use a JavaCompute node, that's also a perfectly valid option - when running connector discovery, simply expand the Controls twistie and choose the option to Use the input message unchanged:
New Button to Open Workspace File System Location
App Connect Enterprise 12.0.10.0 introduces a small but helpful enhancement to easily open a File Explorer window (on Windows - or the equivalent on other development platforms) at the directory location of the Toolkit workspace, using a button at the top of the Application Development perspective. This can be helpful for developers wanting to check the actual files on disk which are underpinning the Eclipse projects.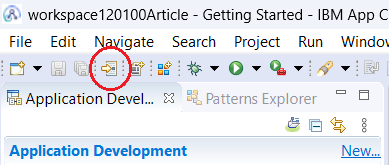
WebUI
New Record and Replay Views With Hex and Base64 Encoding
App Connect Enterprise 12.0.10.0 provides a new message viewer, which makes it easier to look at the content of messages that have been captured using the Record and Replay feature. For an integration node where Record and Replay have been turned on, you can navigate to a particular integration server's Record and Replay Store to see a list of recorded messages. When you drill into any of the messages in previous versions of the product, the display of data does not take into account the fact that a message can be composed of separate transport header(s) before the main body of the data. Depending on the type of header (such as an MQMD, MQRFH2, or HTTP header, for example), it could be of a varying length before the main message body is reached. Historically, this has made it somewhat difficult to differentiate and interpret the parts of the message that are human-readable from those that are not. Now, a hex viewer has been provided alongside a separate text rendering of the data (where the binary data has been decoded using an assumed UTF-8 codepage).
If the text view cannot understand the data, you have the choice to click the button to Show anyway, in which case some parts of the data (such as the body, for example) may be human readable: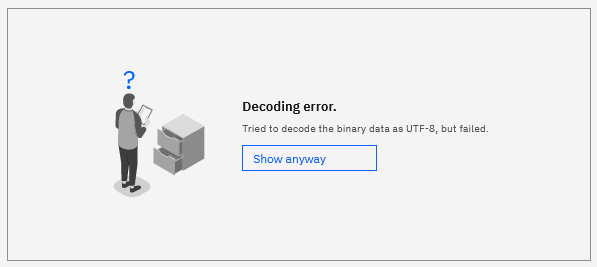
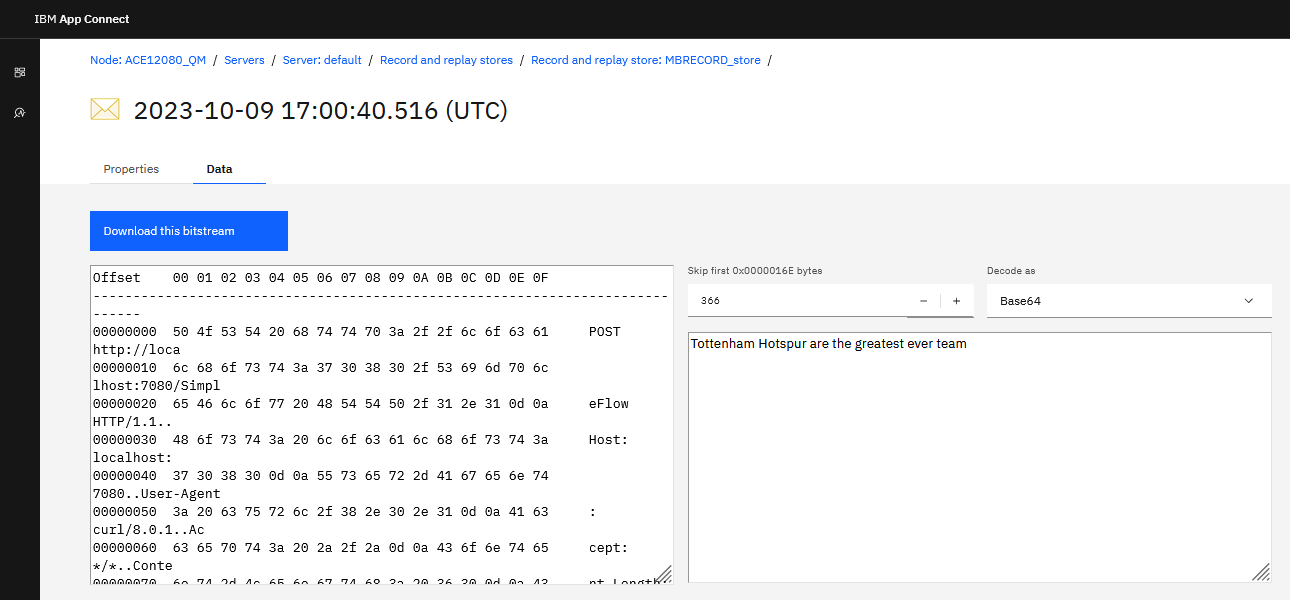
Additionally, the ACE Web UI now also provides the option of skipping over a configurable number of bytes at the start of the message before attempting to decode it. A separate control also lets you choose to attempt to decode the data as either Base64 or Hexadecimal. An example is provided in the pictures below where data has been saved with an HTTP header, which can be skipped over, and also a Base64 encoded message body, which has been translated as shown: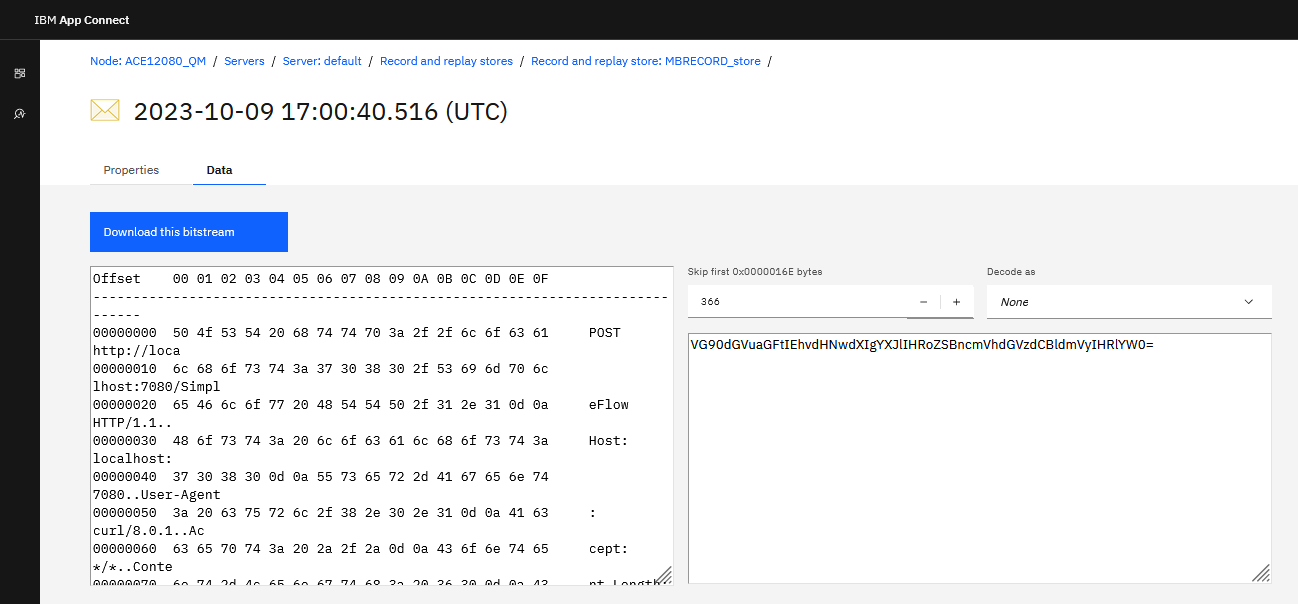
Resource Manager Views
The App Connect Enterprise Web UI has also been enhanced with version 12.0.10.0 to offer a new Resource managers tab, where information is displayed about each of the available resource manager components that are part of the integration server runtime process. The data can be laid out in a tile view or in a table layout, as shown in the screenshot below:
You can drill in to each of the Resource managers in order to view their detailed Properties. The Statistics view shows real-time Resource Statistics: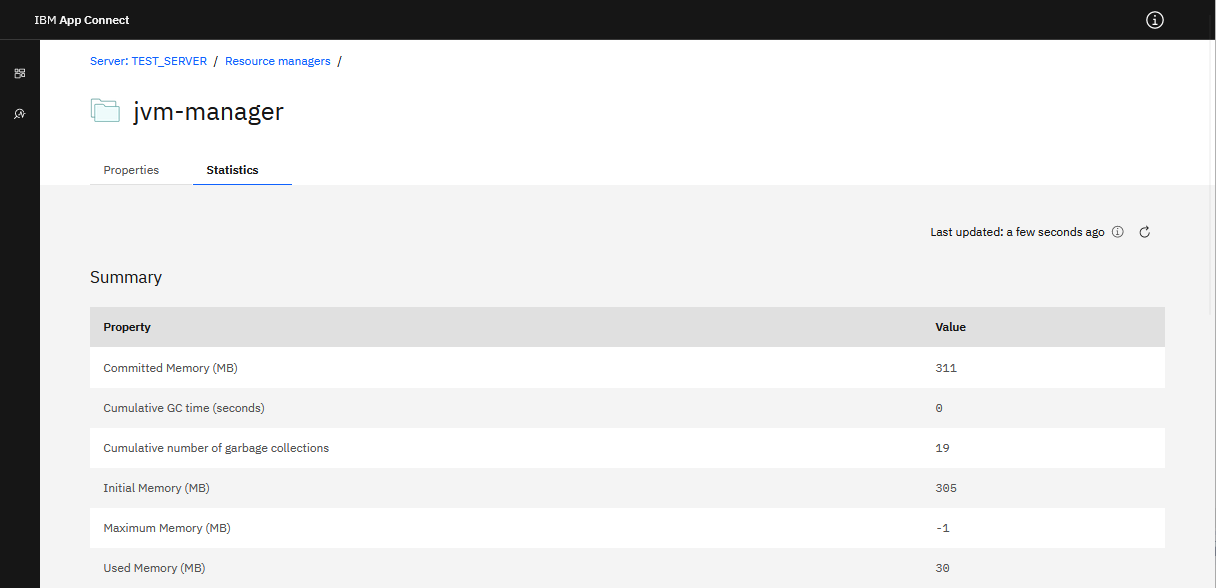
New Change Data Capture Node for Integrating With PostgreSQL and DB2
App Connect Enterprise 12.0.10.0 provides a new Change Data Capture message flow node, which introduces a new way of triggering message flows when updates occur on a database. You can use the Change Data Capture node to capture all the changed data from a database. You can use the node for extracting or subscribing to changes that occur on a particular database server without incurring an extra cost in each transaction.
The concept of using event input nodes to capture changes to a database has been an established architectural concept for many years, but traditionally, this has been achieved using a DatabaseInput node, which relies on Trigger functionality executing within the database itself, which is responsible for populating an event table that is then polled by the integration server. This approach comes with some behaviors that could be seen as pros and cons depending on your precise needs.
For example, one "downside" might be that the Trigger is performed within the boundary of the database transaction and hence may introduce a delay in the original transaction... although for some, this could be seen as an "upside" if you wanted the trigger execution to be tied to the original transaction.
For those users that don't like the concept of a trigger, an alternative option which is growing in popularity is to use Change Data Capture technology, which involves determining changes to the database by inspecting the database logs (on a separate thread or even in a separate process to the original transaction). At the end of 2022, Andreas Martens wrote an interim community blog entry that described how CDC could be used in conjunction with App Connect Enterprise using KafkaConnect and Debezium, but with 12.0.10.0, we are now able to execute CDC by running Debezium within the integration server process without the need for a Kafka pre-requisite. Debezium is an Open Source tool for doing Change Data Capture, which is written in Java and whose goal is to provide a library of connectors that can capture changes from a variety of database management systems and produce events with very similar structures.
Note that the Change Data Capture node requires an integration server to be running Java 11. The Change Data Capture node can be wired into a message flow just like other nodes:
The Change Data Capture node references a Change Data Capture policy that describes how to communicate with the database: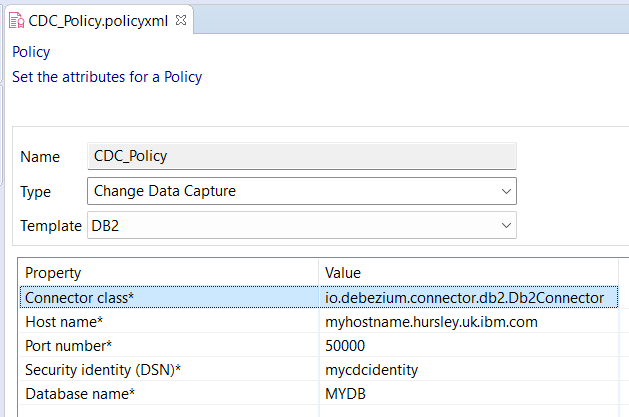
The Connector Class will be different depending on the database vendor that you are connecting to. Some examples are shown in the following list:
- Db2: io.debezium.connector.db2.Db2Connector.
- PostgreSQL: io.debezium.connector.postgresql.PostgresConnector.
- SQL Server: io.debezium.connector.sqlserver.SqlServerConnector.
Full details for configuring the CDC node are available in our documentation, but one thing to be aware of is that the ACE runtime will require some extra JAR files which will be specific to your database choice. These files should be extracted from the installation. For DB2 on Linux, for example, this would be at the path /opt/mqsi/server/cdc/debezium-connector-db2
Built-In ODBC Driver for Integration With PostgreSQL Databases
IBM App Connect Enterprise 12.0.10.0 provides a built-in ODBC database driver for communicating with PostgreSQL databases for the first time. The driver (like other App Connect ODBC drivers, provided by DataDirect but shipped as part of the App Connect installation) is provided for use on Windows and Linux x86-64 platforms. Configuration is provided in a very similar fashion to other ODBC data sources. On Windows platforms, register your database in the operating system's ODBC Data Source Administrator panel by selecting the IBM App Connect 12.0.10.0 - PostgreSQL Wire Protocol (DataDirect) driver and click Finish.
On the next panel, enter the DSN name, description, hostname of the machine where PostgreSQL is running, the port number on which PostgreSQL is listening, and the name of the database to which you want to connect.

On Linux systems, the configuration of a PostgreSQL data source is made through the odbc.ini file, just like other ODBC data sources: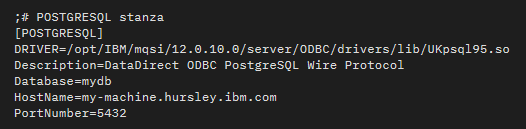
With the database connection configured, you can execute SQL commands against the database from within a message flow's Compute node.
Importing and Exporting Credentials Using the Mqsivault Command
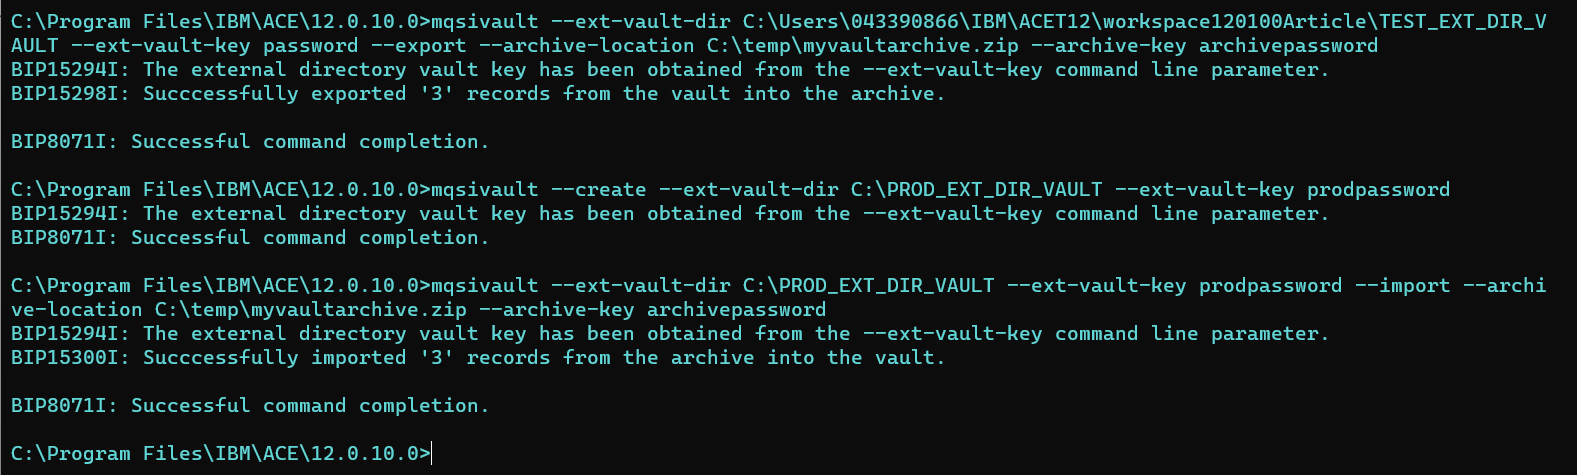
IBM App Connect Enterprise 12.0.10.0 provides new command options for importing and exporting credentials from App Connect Enterprise vaults. This capability can be very useful if you have populated your vault in a lower environment (for example, when connecting to third-party applications using the Discovery Connectors) and now wish to reuse the same credentials for a higher environment, such as a production system. The screenshot below shows a three-stage process:
- Export of credentials from an External Directory Vault into an archive file (where the provided key has been used to safely encrypt the credentials).
- Creation of a new (production) External Directory Vault.
- Import of credentials into the new (production) External Directory Vault from the archive file.
![Import of credentials into the new (production) External Directory Vault from the archive file.]()
Configuring an Integration Server's JRE — Java 11 Changes
IBM App Connect Enterprise 12.0.10.0 provides two separate major versions of Java (8 and 11) as part of the product installation which can be used by the Integration Server process. By default, the product is configured to use IBM Java 8, as shown below: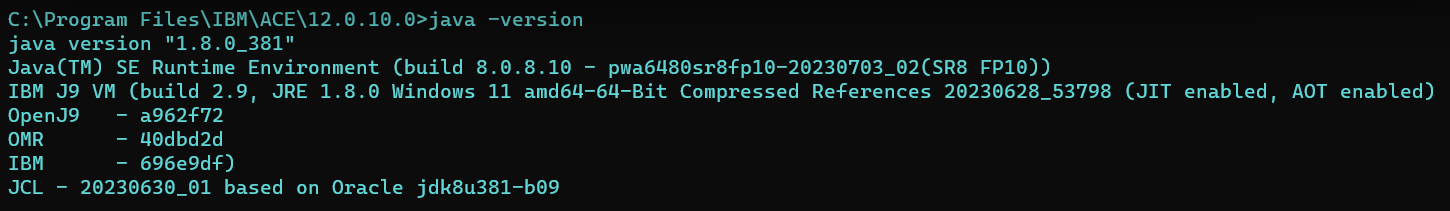
Java 11 is also available as an alternative. Unlike IBM App Connect Enterprise 12.0.9.0, where the user was responsible for locating and installing Java 11, the newest release, 12.0.10.0 provides Java 11 as an integral part of the product installation: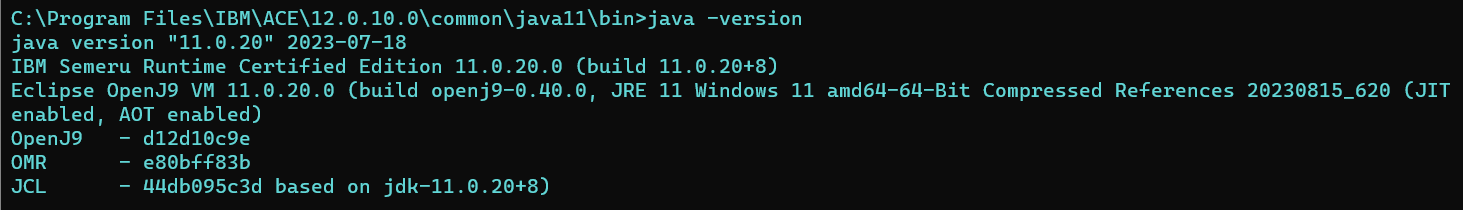
You can configure an integration node-owned integration server or an independent integration server to use Java 11 via the ibmint specify jre command.
Some features in IBM App Connect Enterprise depend on classes that are available only in specific versions of the JRE. For example, the Change Data Capture node, which is new in 12.0.10.0, requires classes that are available in Java 11 but not in Java 8. With this in mind, you can separately configure each of your integration servers to use the version that supports the applications that are deployed to the integration server.
You can read the details regarding the limitations for JRE versions in IBM App Connect Enterprise in the product documentation.
Open Telemetry Platform Support Extended to Include AIX and pLinux
OpenTelemetry provides an open-source framework for tracking and correlating data as it passes between disparate applications. The OpenTelemetry feature of App Connect Enterprise originated in 12.0.7.0 which provided a light-weight method of instrumenting ACE message flows. When OpenTelemetry is enabled for an integration server, for all the supported transports (MQ, HTTP, REST, SOAP, and Callable Flows nodes), Open Telemetry spans are generated, and data is exported to an OpenTelemetry collector. OpenTelemetry collectors can be thought of as vendor-agnostic proxies that receive data before sending it on to one or more observability back-ends. App Connect Enterprise 12.0.8.0 extended support for OpenTelemetry tracing to also include integration servers on zLinux and Windows platforms, in addition to the support for Linux x86-64 that was added in 12.0.7.0. App Connect Enterprise 12.0.10.0 extends support for Open Telemetry tracing to also include integration servers on AIX and pLinux.
Summary
IBM App Connect Enterprise is constantly evolving to support professionals in completing their integration needs. By diving into some of the latest product features and describing concepts, we aim in this article to help you learn more about how to use them to solve your business problems.
Published at DZone with permission of Ben Thompson. See the original article here.
Opinions expressed by DZone contributors are their own.
Comments