Fabric's Resource Governance and Scaling Pitfalls
An overview of Microsoft Fabric scaling. Teams that optimize, isolate workloads, and monitor capacity can avoid performance issues and operational costs.
Join the DZone community and get the full member experience.
Join For FreePerformance and Operational Pitfalls When Scaling BI on Fabric
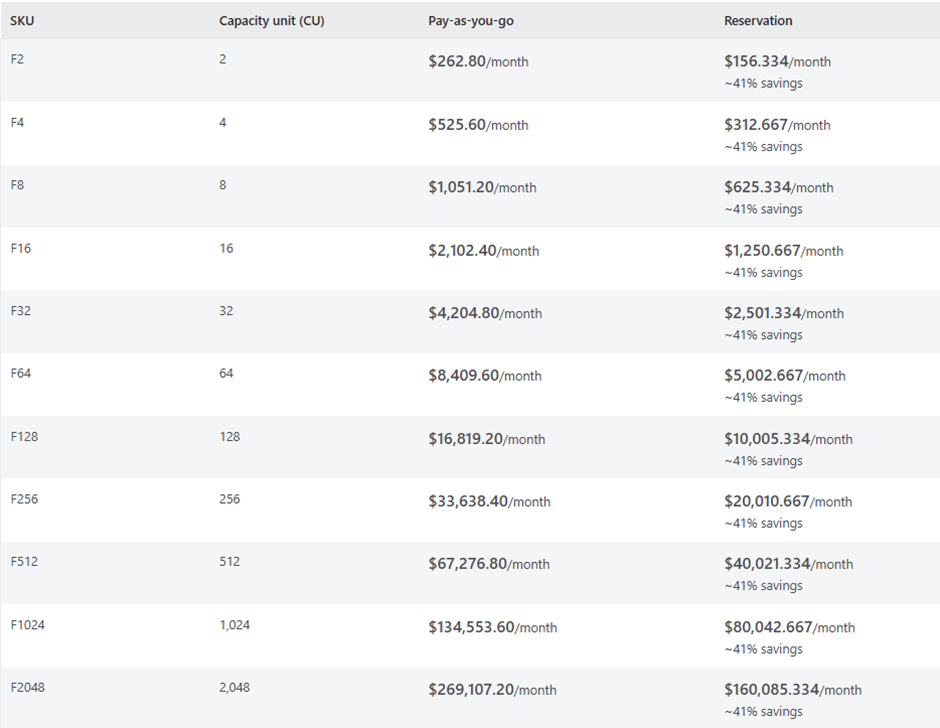
Microsoft chose cost predictability over elasticity for the Fabric billing model. While Fabric’s capacity model simplifies setup, there is a high chance of depleting shared compute resources of a capacity, as well as paying for more resources than necessary.
Common Pitfalls
Fabric capacity scaling is manual, and no auto-scaling is available at present. While this provides absolute control over cost, the whole capacity planning burden is on the admin.
Planning the size of capacity could be challenging as the required compute can vary widely based on the operation performed and concurrency.
Mitigation Strategies
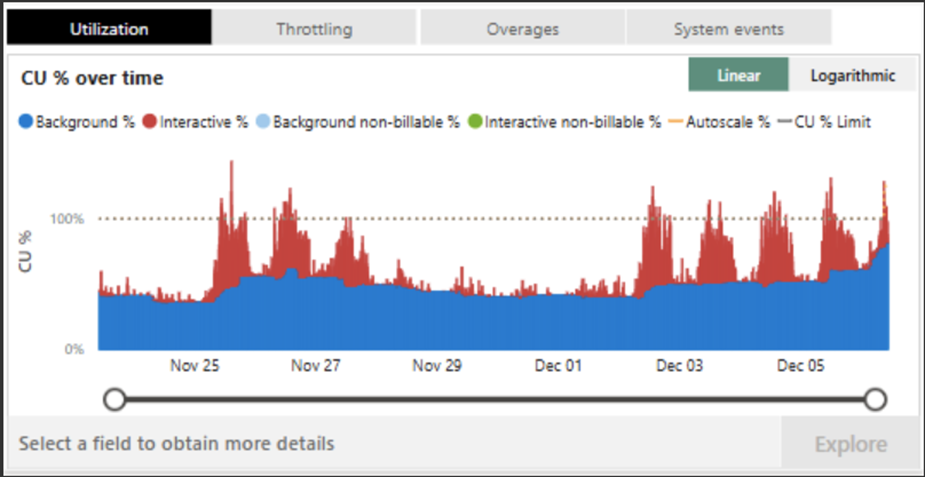
- Use the capacity metrics app to monitor and visualize recent utilization. The app is a standardized Power BI report designed provide a visual representation of resource usage across Health, Compute, and Storage. It can be installed from the Microsoft Learn site.
- To complete the installation, you’ll need Capacity ID, which can be found under Settings -> Admin Portal -> Capacity Settings.
- Use tools such as Monitoring Hub, Log Analytics, and Admin monitoring workspace to learn about frequently used items, current activities, and plan capacity accordingly.
- Monitor Business Hours rush and adjust capacity.
- Each workload, such as Warehouse or Lakehouse, requires its own optimization strategies and resource planning. Being mindful of these differences is important.
- The capacity events in the real-time hub provide a high-level summary of capacity usage, helping administrators monitor health, including capacity state and utilization.
Use the strategies below when capacity is highly utilized to resolve throttling and rejection:
- Optimize – Optimize the design of Fabric items
![]()
- Scale up – Scale up capacity temporarily or permanently by increasing the SKU size.
- Scale out – Move some of the Fabric items to a different capacity to spread the workload
While the above strategies may help you address some immediate scaling pressures, meticulous planning, workload awareness, and workflow design awareness are required for long-term resource governance.
Fabric Workload Resource Governance
To ensure scalable, cost-efficient analytics, governance must extend beyond simple capacity setting into the design of queries, pipelines, and code execution strategies. With diverse workload types and varying workloads, organizations must also proactively manage how resources are allocated, isolated, and optimized.
Governance Objectives
Below are key objectives to guide cost-efficient and scalable analytics:
Ensure predictable performance across concurrent workloads
- Use workload isolation and capacity assignment to prevent the noisy neighbor effect.
- Apply partitioning strategies (e.g., by date, region, or business units) to control scan volume
Optimize cost and performance by matching each workload to the right storage layout and execution model, and then stick to it. Establish simple governance rules such as:
- Eliminate wasteful scans and shuffles early: Use EXPLAIN for SQL and call .explain() on DataFrames in notebooks to flag large scans and unexpected shuffles.
- Partition, Z-Order, and compaction for efficient reads: Partition tables on the most used column; apply Z-Order on common multi-column filters; Apply Compaction to consolidate small files.
- Isolate heavy jobs with dedicated capacity: This helps bundle workloads based on separate compute, so spikes do not slow front-end apps such as interactive dashboards; this also helps in preventing one team’s heavy workload from slowing down the performance of the other team and pushing up the bill for everyone.
- Choose the right engine and validate with a benchmark: Use SQL for dashboard aggregation and PySpark for complex transformations; run a short benchmark using a sample workload on both engines to determine which gives optimum performance.
- Use DirectLake for read-heavy dashboarding, but selectively.
- Implement incremental refresh for large tables.
Support compliance through metadata integration and classification
Challenges, Gaps, and Wishlist
Despite Fabric’s unified architecture, workload governance presents several challenges:
- Major challenge being the lack of auto-scaling: Without elasticity, organizations that are used to elastic services from Azure, etc., struggle to find the “sweet spot” between under-provisioning and over-provisioning.
- Limited workload throttling control: More control towards prioritizing workloads based on urgency, user role, and sensitivity is desired.
- Cross-workspace visibility gaps: Monitoring resource consumption across multiple workspaces remains fragmented, complicating governance at scale.
- Git sync: Workspaces have item quota limits. Phantom lineage dependencies block the removal of workspace items during the sync process. Any sync failures block workspace operations, such as updating commits from Git to the workspace.
Best Practices
While effective resource planning is not a one-time design, it’s an iterative process of tuning for the best performance and optimized cost.
- Treat capacity sizing as trial-and-error; start small, monitor usage, scale up if needed.
- Roll out workloads in phases rather than all at once.
- Separate resource-intensive tasks and mission-critical workloads into their own workspaces/capacities to avoid contention.
- Fabrics workspaces work better horizontally but not vertically. Having one workspace for everything is not ideal in every scenario. Overloading the capacity will have resource utilization issues.
Governance Maturity Outlook
It may not be fully mature yet, but Fabric’s governance capabilities are rapidly evolving. Current limitations exist, however, as Microsoft continues to invest in Fabric’s governance features, with deeper integrations across services like Purview, enhanced telemetry, the outlook is promising.
Key Takeaways
- The world is shifting to AI-first BI, so governance must catch up.
- Bigger SKU ≠ scalability. Knowledge of organizational data, optimization, and monitoring is essential.
- Governance policies should start at design.
- Fabric’s governance and AI capabilities are evolving fast; organizations need to stay adaptive.
Opinions expressed by DZone contributors are their own.
Comments