Getting Started With C# DataFrame and XPlot.Ploty
For the Python programming language, Pandas is an efficient and popular data analysis tool, especially its Dataframe, used to manipulate and display data.
Join the DZone community and get the full member experience.
Join For FreeFor the Python programming language, Pandas is an efficient and popular data analysis tool, especially its Dataframe, used to manipulate and display data. For the .NET programming languages, we can use Deedle or Microsoft.Data.Analysis package available in NuGet which also provides a DataFrame class used to manipulate, transform, and display data.
This example focuses on Microsoft.Data.Analysis package by demonstrating some basic features of the DataFrame class in Jupyter Notebook.
It also uses the XPlot.Plotly package which is F# data visualization package to plot charts for the data in the Dataframe. The source code is available on GitHub.
Prerequisite
To run examples in this article, please refer to this Using .NET Core in Jupyter Notebook article for setting up Jupyter Notebook to support the .NET programming languages.
Install the Package
The Microsoft.Data.Analysis package is available in Nuget so the dotnet-interactive #r magic command can be used to install the package from NuGet.
Run the below command to install Microsoft.Data.Analysis package version 0.4.0.
#r "nuget:Microsoft.Data.Analysis,0.4.0"Refer the Namespaces
This article uses classes from the following four packages. Therefore, it uses the using statement to refer to those packages.
- XPlot.Plotly: A cross-platform data visualization package for the F# and .NET programming languages
- Microsoft.Data.Analysis: An easy-to-use and high-performance library for data analysis and transformation
- System.Linq: Classes and interfaces that support queries that use Language-Integrated Query
- Microsoft.AspNetCore.Html: Types for manipulating HTML content
using XPlot.Plotly;
using Microsoft.Data.Analysis;
using System.Linq;
using Microsoft.AspNetCore.Html;
Render a DataFrame as an HTML Table
By default, a DataFrame is rendered as an HTML table with one row and two columns (Columns and Rows).
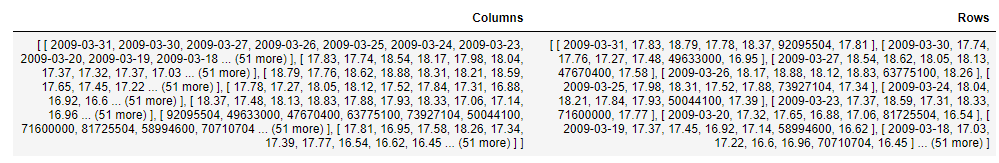
This can be overridden by registering the custom formatter for the DataFrame. The below code registers custom formatters for the Dataframe and DataFrameRow to render the data in an HTML table.
It only displays the first 100 rows. This can be changed by modifying the value of the take variable.
Formatter<DataFrame>.Register((df, writer) =>
{
    var headers = new List<IHtmlContent>();
    headers.Add(th(i("index")));
    headers.AddRange(df.Columns.Select(c => (IHtmlContent) th(c.Name)));
    var rows = new List<List<IHtmlContent>>();
    var take = 100;
    for (var i = 0; i < Math.Min(take, df.Rows.Count); i++)
    {
        var cells = new List<IHtmlContent>();
        cells.Add(td(i));
        foreach (var obj in df.Rows[i])
        {
            cells.Add(td(obj));
        }
        rows.Add(cells);
    }
    var t = table(
        thead(
            headers),
        tbody(
            rows.Select(
                r => tr(r))));
    writer.Write(t);
    writer.Write(df.Rows.Count + " x "+df.Columns.Count);
}, "text/html");

Formatter<DataFrameRow>.Register((dataFrameRow, writer) =>
{
    var cells = new List<IHtmlContent>();
    cells.Add(td(i));
    foreach (var obj in dataFrameRow)
    {
        cells.Add(td(obj));
    }
    var t = table(
        tbody(
            cells));
    writer.Write(t);
}, "text/html");
Create the DataFrame
DataFrameColumn
A DataFrame can be created by passing the list of DataFrameColumn objects to the DataFrame's constructor.
| public DataFrame(params DataFrameColumn[] columns); public DataFrame(IEnumerable<DataFrameColumn> columns); |
The following code creates a DataFrame that has 200 rows and 2 columns. The first column contains dates and the second column contains random integer numbers. It calls the PrimitiveDataFrameColumn constructor to create the DataFrameColumn instances.
var start = new DateTime(2009,1,1);
Random rand = new Random();
var numDataPoint = 200;

PrimitiveDataFrameColumn<DateTime> date = new PrimitiveDataFrameColumn<DateTime>("Date",
    Enumerable.Range(0, numDataPoint)
          .Select(offset => start.AddDays(offset))
          .ToList());
PrimitiveDataFrameColumn<int> data = new PrimitiveDataFrameColumn<int>("Data",
    Enumerable.Range(0, numDataPoint)
                        .Select(r => rand.Next(100))
                        .ToList());
var df = new DataFrame(date, data);
df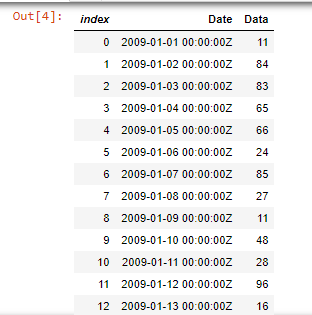
CSV File
The DataFrame can also be created from a CSV file by calling the DataFrame.LoadCsv static method.
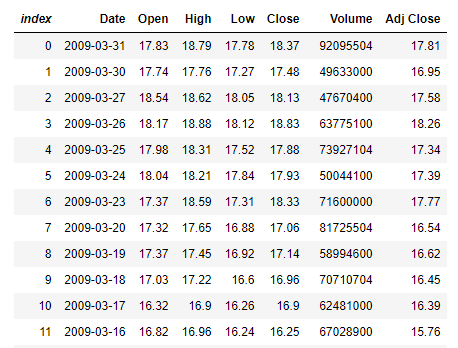
The following code creates a DataFrame from the ohcldata.csv file. This file is downloaded from 5.30. Example - Basic OHLC (Open, High, Low, Close) Financial Plot website. This file contains the daily Open, High, Low, Close financial data.
var df1 = DataFrame.LoadCsv("ohlcdata.csv");
df1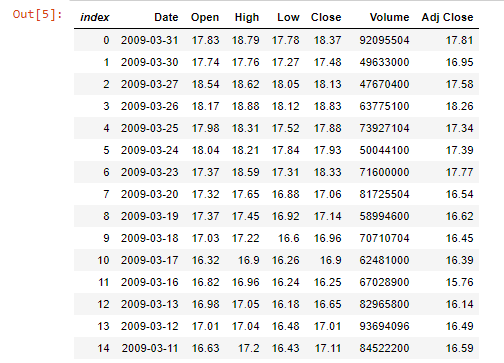
Then, the Info method can be used to generate a summary of each column in the DataFrame.
df1.Info()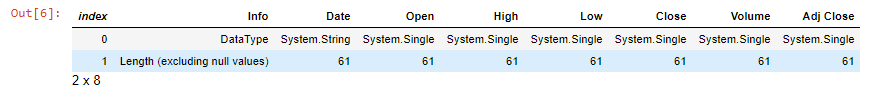
Access the DataFrame
Access Data by Indices
A row index and column index can be used to access the specific data in the DataFrame. The index is zero-based numbering.
The below code access data in the first row and the second column.
df[0,1]![Out[7]: 11; First Row, Second Column](https://dz2cdn1.dzone.com/storage/temp/14769905-result4.png)
After that, a new value can be assigned to the DataFrame.
The below code increases the data in the first row and the second column by 10.
df[0,1] = int.Parse(df[0,1].ToString()) + 10;
df.Head(10)![Out[8]: Chart; Increase Data by 10](https://dz2cdn1.dzone.com/storage/temp/14769908-result5.png)
Access Row Data
The entire row can be accessed by using a row index. The index is zero-based numbering.
The below code accesses the tenth row in the DataFrame.
df1.Rows[9]
The column index can also be used to access the specific column in the row.
The below accesses the fourth column in the tenth row.
df1.Rows[9][5]
Then, the new value can also be assigned to the column.
The below code assigns 50000000 to the sixth column.
df1.Rows[9][5] = 50000000f;
df1.Head(10)![Out[11]: Chart; Access Row Data](https://dz2cdn1.dzone.com/storage/temp/14769988-result8.png)
Access Column Data
The entire column can be accessed by using a column name or index. The index is zero-based numbering.
The below code accesses the column named Data (the second column) in the DataFrame.
//df.Columns["Data"] or df.Columns[1]
df.Columns["Data"] ![Out[12]: Chart; Access Column Data](https://dz2cdn1.dzone.com/storage/temp/14769990-result9.png)
The data in the column can be changed by using the DataFrame's overloaded operators.
The below code increases all data in the column by ten.
 df.Columns["Data"]= df.Columns["Data"]+10;
df![Out[13]: Chart; Increase All Data By 10](https://dz2cdn1.dzone.com/storage/temp/14769994-result10.png)
Insert Data
Add a New Column
The DataFrame maintains a list of DataFrameColumns in the DataFrameColumnCollection. A new column can be added to the DataFrameColumnCollection.
The below code adds a new integer column to the DataFrame.
df.Columns.Add(new PrimitiveDataFrameColumn<int>("Data1", df.Rows.Count()));
df![Out [14]: Chart; Add a New Column](https://dz2cdn1.dzone.com/storage/temp/14769997-result11.png)
The data in the new column is set to null.
The following code fills null values in the new column (Data1) with 10.
df.Columns["Data1"].FillNulls(10, true);
df![Out[15]: Chart; Fill Null Values](https://dz2cdn1.dzone.com/storage/temp/14769999-result12.png)
Append a New Row
The Append method can be used to append new rows to the DataFrame.
The following code creates a list of KeyValuePair instances and then adds it to the DataFrame.
df.Append(new List<KeyValuePair<string, object>>() {
    new KeyValuePair<string, object>("Date", DateTime.Now),
    new KeyValuePair<string, object>("Data", 12),
    new KeyValuePair<string, object>("Data1", 50)
}, true);
df.Tail(10)![Out [16]: Chart; Append a New Row](https://dz2cdn1.dzone.com/storage/temp/14770002-result13.png)
Manipulate the DataFrame
Sort the DataFrame
The OrderBy or OrderByDescending method can be used to order the DataFrame by a specified column.
The following code sorts the DataFrame by the column named Data.
df.OrderBy("Data")![Out [17]:Chart; Sort DataFrame](https://dz2cdn1.dzone.com/storage/temp/14770005-result14.png)
Group the DataFrame
The GroupBy method can be used to group the rows of the DataFrame by unique values in the column.
The following code groups the DataFrame by the column named Data and then counts the number of values in each group.
var groupByData = df.GroupBy("Data");
groupByData.Count().OrderBy("Data")
![Out[18]: Chart; Group the DataFrame](https://dz2cdn1.dzone.com/storage/temp/14770010-result15.png)
Filter the DataFrame
The Filter method can be used to filter the DataFrame by row indices or boolean values.
The following code filters the DataFrame by returning rows that have the values in the column named Data greater than fifty.
df.Filter(df.Columns["Data"].ElementwiseGreaterThan(50))![Out[19]: Chart; Filter the DataFrame](https://dz2cdn1.dzone.com/storage/temp/14770011-result16.png)
Merge the DataFrame
The Merge method can be used to merge two DataFrames with a database-style join.
The following code joins two DataFrames by using the Date column contained in both DataFrames. First, it converts the data type in the Date column of the df1 from the string type to the DataTime type. Then, it calls the Merge method to join the DataFrames.
df1.Columns["Date"] = new PrimitiveDataFrameColumn<DateTime>("Date",
    df1.Columns["Date"]
                .Cast<object>()
                .ToList()
                .Select(x => DateTime.ParseExact(x.ToString(), "yyyy-MM-dd", System.Globalization.CultureInfo.InvariantCulture))
                .Cast<DateTime>());

df1.Merge<DateTime>(df, "Date", "Date")![Out[20]: Chart; Merge the DataFrame](https://dz2cdn1.dzone.com/storage/temp/14770017-result17.png)
Plot Charts by Using XPlot.Ploty
XPlot.Ploty is a cross-platform data visualization package for the F# and .NET programming languages. It is based on Plotly which is the popular JavaScript charting library.
The following examples demonstrate how to use XPlot.Ploty to plot charts by using the data in the DataFrame.
Line Chart
The following code plots a line chart from the Open column in the DataFrame.
var chart1 = Chart.Plot(
    new Graph.Scatter
    {
        x = df1.Columns["Date"],
        y = df1.Columns["Open"],
        mode = "lines+markers"
    }
);
var chart1_layout = new Layout.Layout{
    title="Open Price",
    xaxis =new Graph.Xaxis{
        title = "Date"
        },
    yaxis =new Graph.Yaxis{
    title = "Price (USD)"
        }
    };
chart1.WithLayout(chart1_layout);
chart1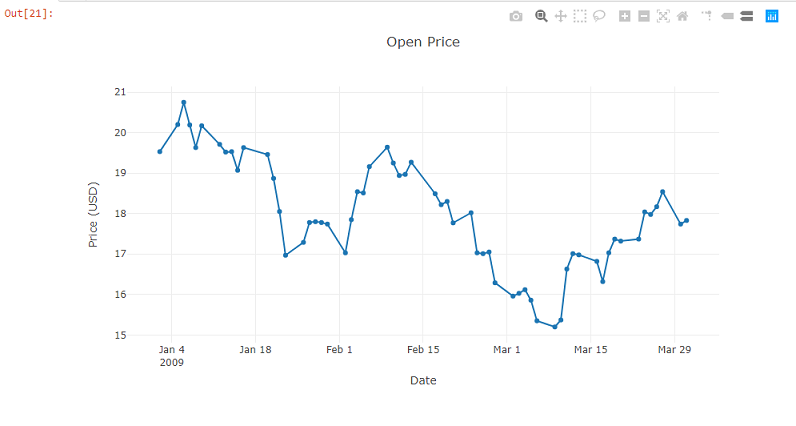
Line Chart With Mulitple Lines
The following code plots the Open, and Close columns in a line chart.
var chart2_list = new List<Graph.Scatter>
{
    new Graph.Scatter
    {
         x = df1.Columns["Date"],
        y = df1.Columns["Open"],
        name="Open",
        mode = "lines"
    },
    new Graph.Scatter
    {
        x = df1.Columns["Date"],
        y = df1.Columns["Close"],
        name="Close",
        mode = "lines"
    }

};

var chart2 = Chart.Plot(
    chart2_list
);

var chart2_layout = new Layout.Layout{
    title="Open and Close Price",
    xaxis =new Graph.Xaxis{
        title = "Date"
        },
    yaxis =new Graph.Yaxis{
    title = "Price (USD)"
        }
    };
chart2.WithLayout(chart2_layout);
chart2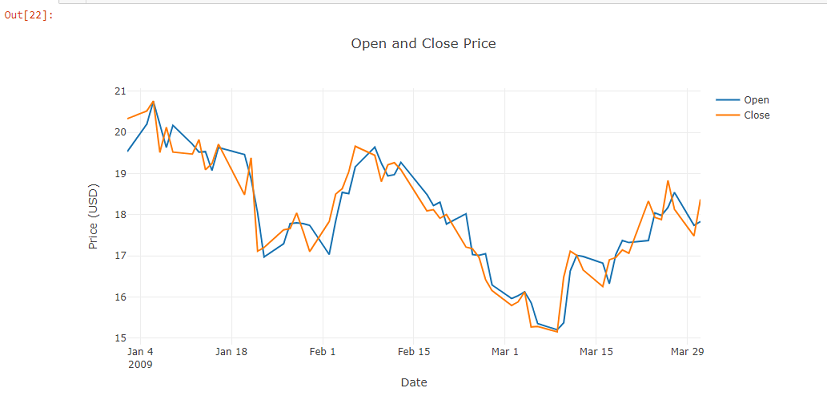
Bar Chart
The following code plots a bar chart from the Volume column in the DataFrame.
var chart3 = Chart.Plot(

    new Graph.Bar
    {
        x = df1.Columns["Date"],
        y = df1.Columns["Volume"],
        marker = new Graph.Marker{color = "rgb(0, 0, 109)"}
    }
);
var chart3_layout = new Layout.Layout{
    title="Volume",
    xaxis =new Graph.Xaxis{
        title = "Date"
        },
    yaxis =new Graph.Yaxis{
    title = "Unit"
        }
    };
chart3.WithLayout(chart3_layout);
chart3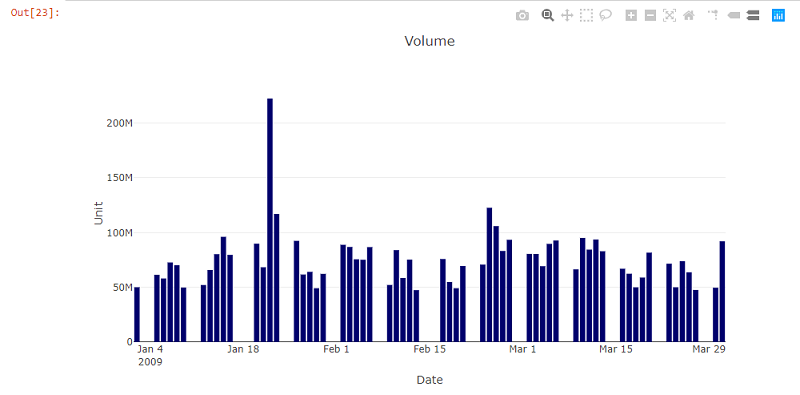
Candlestick Chart
The following code plots a candlestick chart from the Open, High, Low, Close columns in the DataFrame.
var chart4 = Chart.Candlestick(df1.OrderBy("Date").Rows.Select(row => new Tuple<string, double, double, double, double>(
                 ((DateTime)row[0]).ToString("yyyy-MM-dd"),
                 double.Parse(row[1].ToString()),
                 double.Parse(row[2].ToString()),
                 double.Parse(row[3].ToString()),
                 double.Parse(row[4].ToString())
                )));
chart4.WithLayout(new Layout.Layout{
    title="OHLC",
    xaxis =new Graph.Xaxis{
        title = "Date"
        },
    yaxis =new Graph.Yaxis{
    title = "Price (USD)"
        }
    });
chart4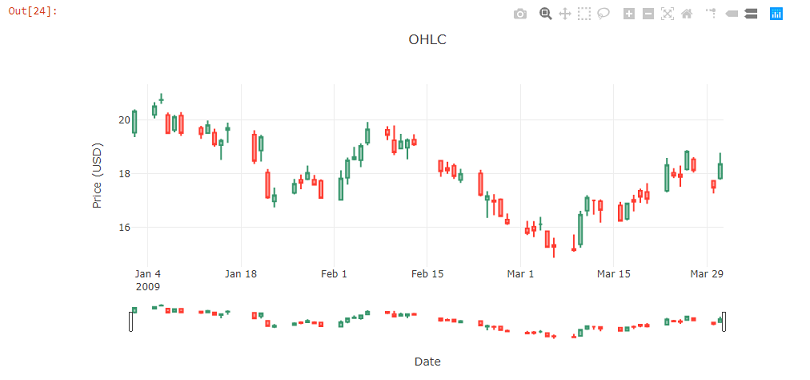
References
- Phplot.sourceforge.net. n.d. 5.30. Example - Basic OHLC (Open, High, Low, Close) Financial Plot. [online] Available at: http://phplot.sourceforge.net/phplotdocs/ex-ohlcbasic.html [Accessed 6 May 2021].
- Bluemountaincapital.github.io. n.d. Deedle: Exploratory data library for .NET. [online] Available at: https://bluemountaincapital.github.io/Deedle/ [Accessed 6 May 2021].
- Govindarajan, P., 2019. An Introduction to DataFrame | .NET Blog. [online] .NET Blog. Available at: https://devblogs.microsoft.com/dotnet/an-introduction-to-dataframe/ [Accessed 6 May 2021].
- Sequeira, J., 2020. dotnet/interactive: Magic Commands. [online] GitHub. Available at: https://github.com/dotnet/interactive/blob/main/docs/magic-commands.md [Accessed 6 May 2021].
- Winnington, E., 2019. Eric Winnington - Tips and tricks for C# Jupyter notebook. [online] Ewinnington.github.io. Available at: https://ewinnington.github.io/posts/jupyter-tips-csharp [Accessed 6 May 2021].
- Fslab.org. n.d. XPlot - F# Data Visualization Package. [online] Available at: https://fslab.org/XPlot/index.html [Accessed 6 May 2021].
- Phuriphanvichai, J., 2021. Using .NET Core in Jupyter Notebook | Refinitiv Developers. [online] Developers.refinitiv.com. Available at: https://developers.refinitiv.com/en/article-catalog/article/using--net-core-in-jupyter-notebook.html [Accessed 10 May 2021].
Opinions expressed by DZone contributors are their own.
Comments