How Java Profilers Work
Learn more about how Java profilers work.
Join the DZone community and get the full member experience.
Join For FreeOne of the best tools we have today for understanding application behavior and troubleshooting performance issues are Java profilers. Java profilers monitor JVM execution at the bytecode level and can provide information on thread execution and locks, heap memory usage, garbage collection, hot methods, exceptions, class loading, and more.
How Java Profilers Work
Profilers inspect the state of a JVM either by passively listening for events from the JVM or by actively querying the JVM for its state. Profilers can also modify the bytecode of classes to add instrumentation code, like inserting a methodEntered and methodExit event at the beginning and end of a method or inserting an objectCreated event into a constructor.
There are lots of events that are generated by the JVM, and these can be categorized into two types: instant events and duration events. Instant events are one-time events that have a timestamp and the event data. Examples include exception events, class load events, and object allocation events. Instant events let us know that something has occurred and can be reacted to or simply watched and analyzed. Duration events have a start time and an end time and are therefore used to provide timing for some activity. Examples include garbage collection, which tells you the start and end time of garbage collection, monitor wait which tells you how long a thread waited on an object, and monitor contended, which tells you how long a thread was waiting on a lock to be released.
In addition to the generated events, the JVM also has profiling functions that return data about its internal state. Some commonly used ones are the thread functions like GetThreadState and GetAllThreads, and the stack trace functions like GetStackTrace and GetAllStackTraces. This internal state data is queried periodically by the profiler in a process known as sampling and the sampling period is how often the functions get called to fetch the data. For example, every 20 milliseconds.
Performance Analysis Using Java Profilers
When analyzing application performance, there are a number of profiling activities that are commonly performed by programmers and analysts. These include CPU profiling, memory profiling, and thread profiling. In some cases, depending on the type of application, I/O Profiling becomes important as well, but the majority of applications are most concerned with the aforementioned 3.
CPU profiling is primarily concerned with the frequency and length of time of method execution. With CPU profiling, you can find out what methods run the most frequently, therefore, eat up the most CPU time. These are commonly referred to as "hot methods." This gives you an indication of what methods or areas of the code you should focus on optimizing.
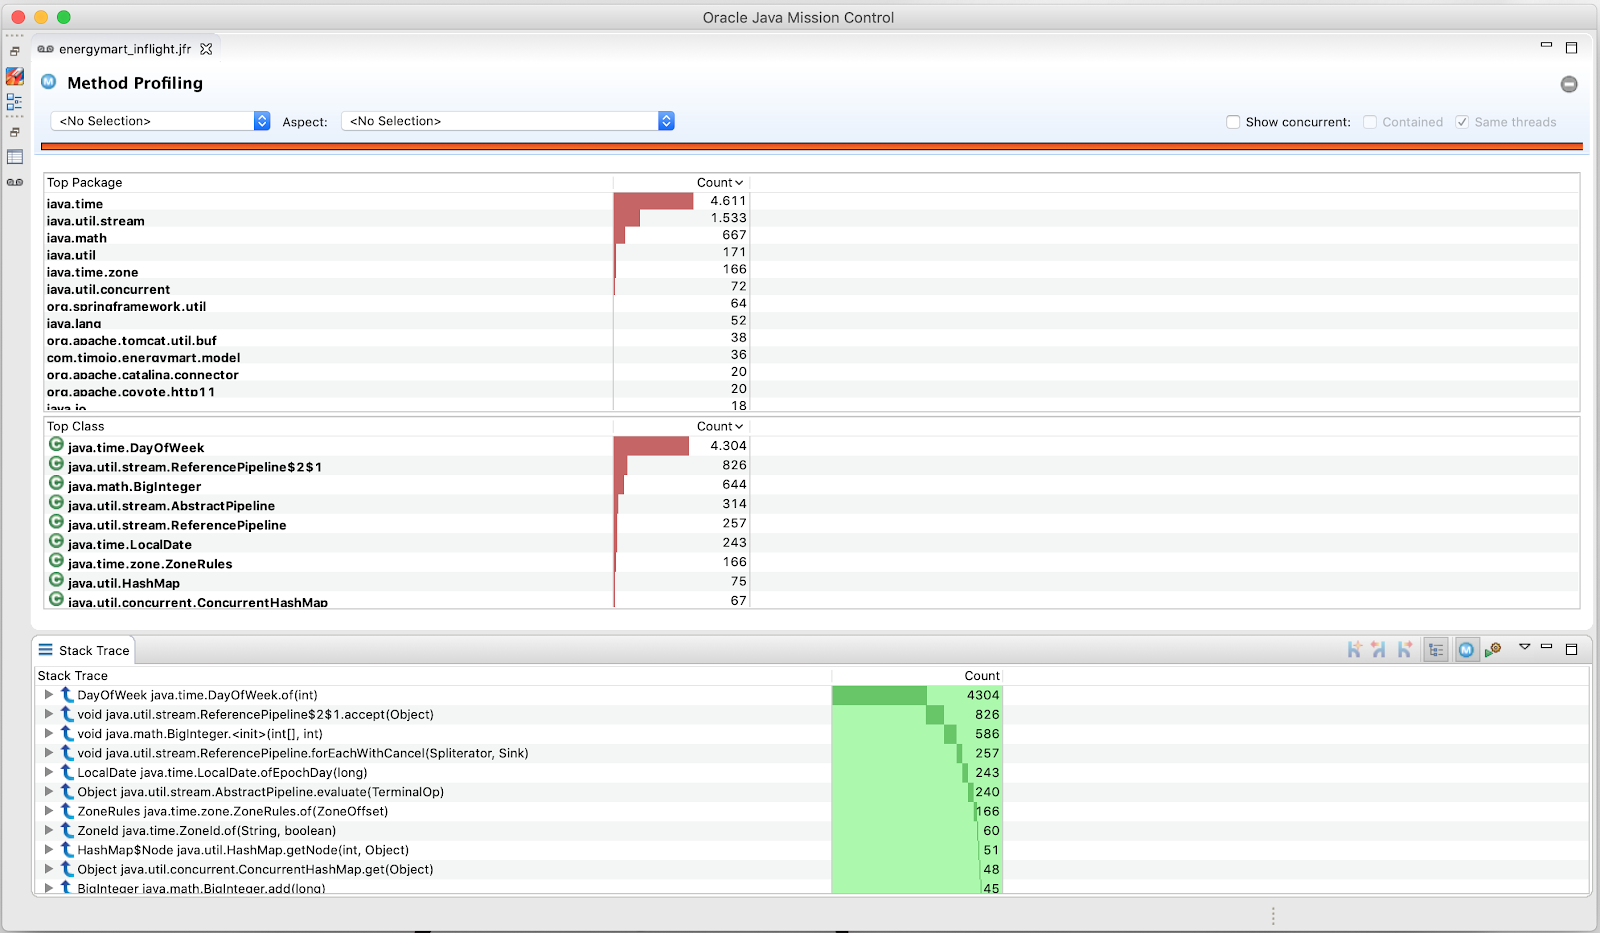
There are two ways in which CPU profilers get method execution information; by sampling or by instrumentation.
Sampling profilers work by periodically querying the JVM for all the running threads and getting the stack trace for each thread. It then determines what method each thread was executing when the sample was taken and compares the samples to determine how much time was spent in that method. Profiling by sampling has the least amount of overhead and is, therefore, suitable for production use. However, because it's an indirect way of measuring method execution, it can be error-prone or inaccurate depending on the execution flow of the application and how often the profiler samples. To minimize sampling errors, your options are to profile over a longer period of time, reduce the interval between samples, or both. However, reducing the interval between samples results in increasing the overhead on the JVM, therefore, there's a trade-off that has to be made between accuracy and overhead.
Instrumenting profilers work by modifying the application's bytecode and inserting code for counting invocations or timing methods. This makes them more accurate in determining method invocation counts and potentially more accurate in determining method timing. However, instrumenting application bytecode has a higher potential for introducing performance differences for two reasons. One is that the instrumentation code will likely have some overhead attached to it and the other is that; depending on how the instrumentation is done there may be some optimizations that could have been applied to the non-instrumented code that can't be applied to the instrumented code.
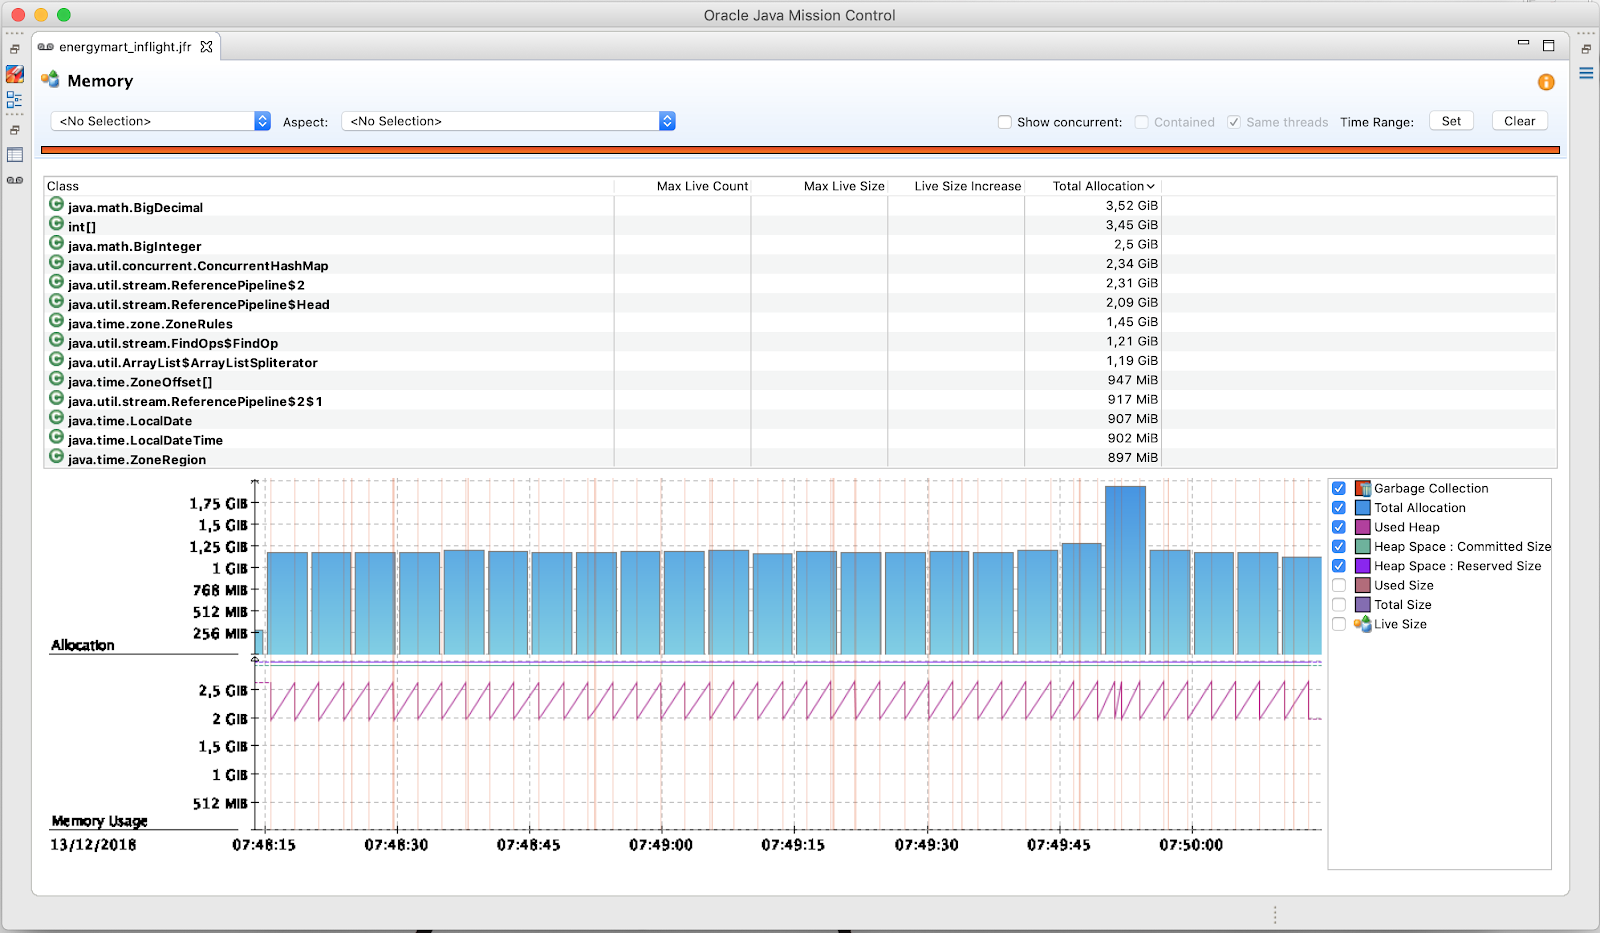
The next common profiling activity is memory profiling. Memory profiling is primarily concerned with understanding what objects are using up memory and how memory is being freed by garbage collection. With memory profiling, you can monitor the memory usage of your class objects over a period of time, find out what objects are growing and shrinking in size, and where in your code these allocations are taking place. You can also analyze garbage collections. You can see the number and types of garbage collections that have occurred, the length of the pause times for each garbage collection, and how much memory they were able to free.
The third common profiling activity is thread profiling. Thread profiling is primarily concerned with understanding what states threads are in and why. With thread profiling, you can see if your threads are able to run in parallel or not, find out what how much time your threads spend sleeping, waiting, blocked, or executing, and find and analyze cases of high lock contention. Thread profiling is useful when your application is not as performant as it should be yet its CPU usage is low. In this case, your application performance could be hindered by locking, and thread profiling helps you find that out.
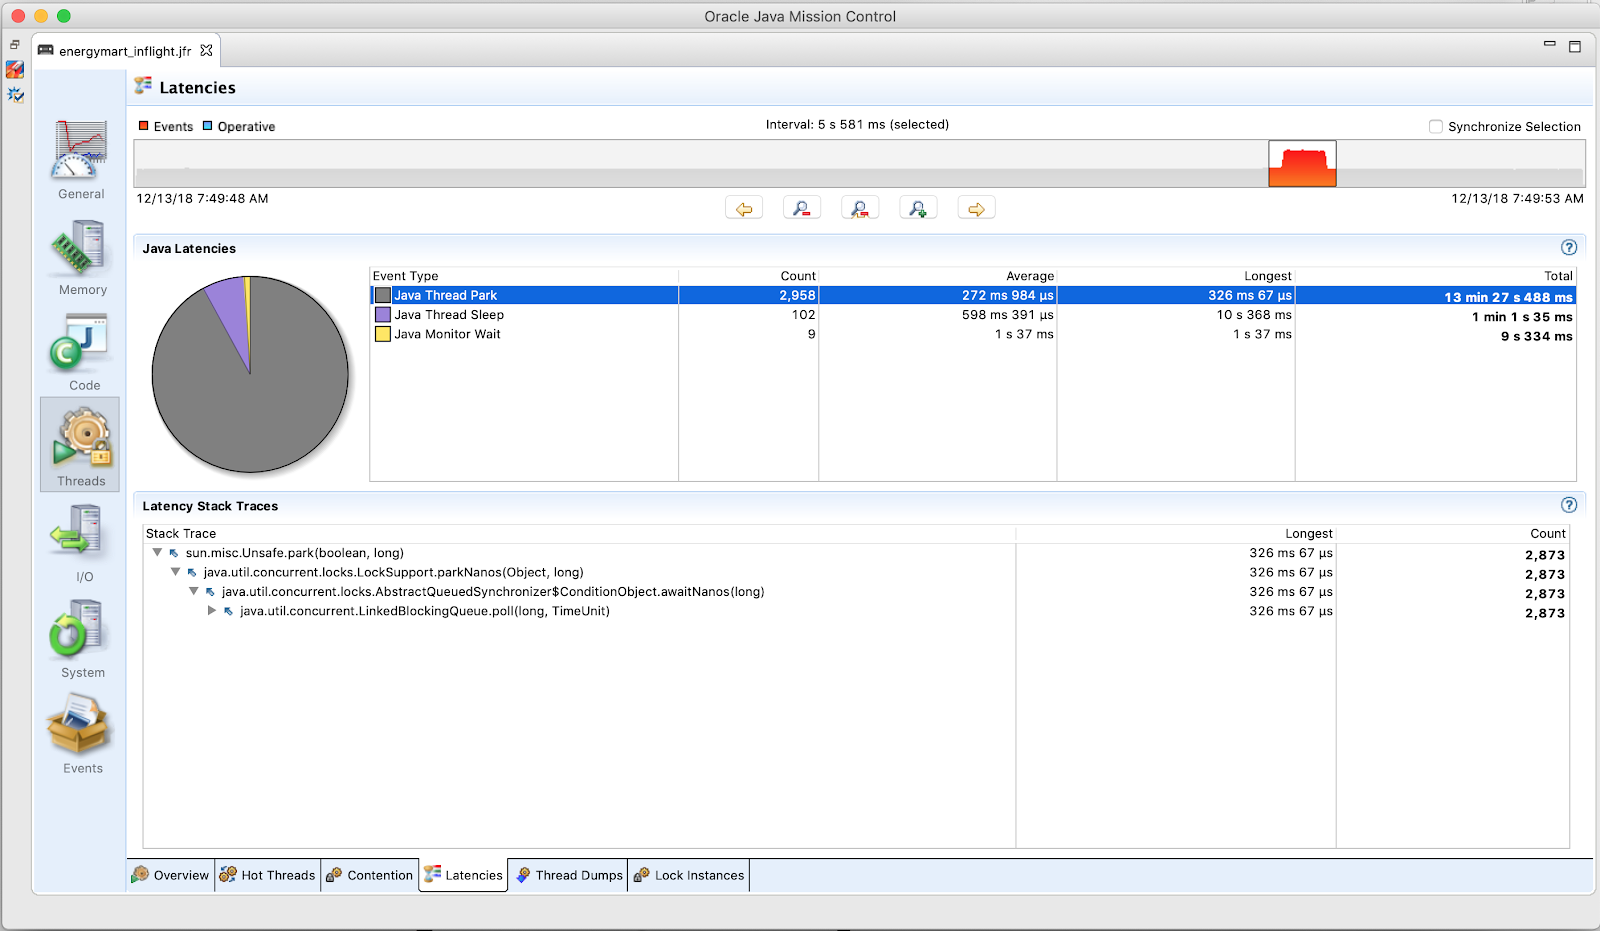
There are lots of different Java profilers available today. The screenshots in this article are from Java Flight Recorder, a Java profiler developed, and recently open-sourced by Oracle. To get started with Java Flight Recorder, you can check out this Youtube video from Oracle.
For more information on how to tune your Java application for optimal performance, including an example where I use a profiler on a Spring application, discover some hidden performance flaws, and make some tweaks, check out my Pluralsight course: Java Performance Tuning. In there, I cover tools and techniques for analyzing and troubleshooting Java performance issues, JVM tuning topics, Java profiling, and best practices for writing high-performance application code.
Published at DZone with permission of Tim Ojo. See the original article here.
Opinions expressed by DZone contributors are their own.
Comments