How to Make Successful Marketing Decisions With Data Analysis
Make successful marketing decisions with data analysis.
Join the DZone community and get the full member experience.
Join For FreeAs market conditions become more complex, companies face increasing challenges in marketing decisions. Establishing a scientific marketing data support system is an important foundation for ensuring the scientific decision-making of enterprises. This article makes a modular analysis of marketing decision from the perspective of data analysis, including six modules: indicator decomposition, management cockpit, marketing KPI system, dealer and store management, competing product analysis, and predictive analysis, which has a good guiding significance for the planning and construction of corporate marketing decision analysis.
1. Indicator Decomposition
1.1 Indicator
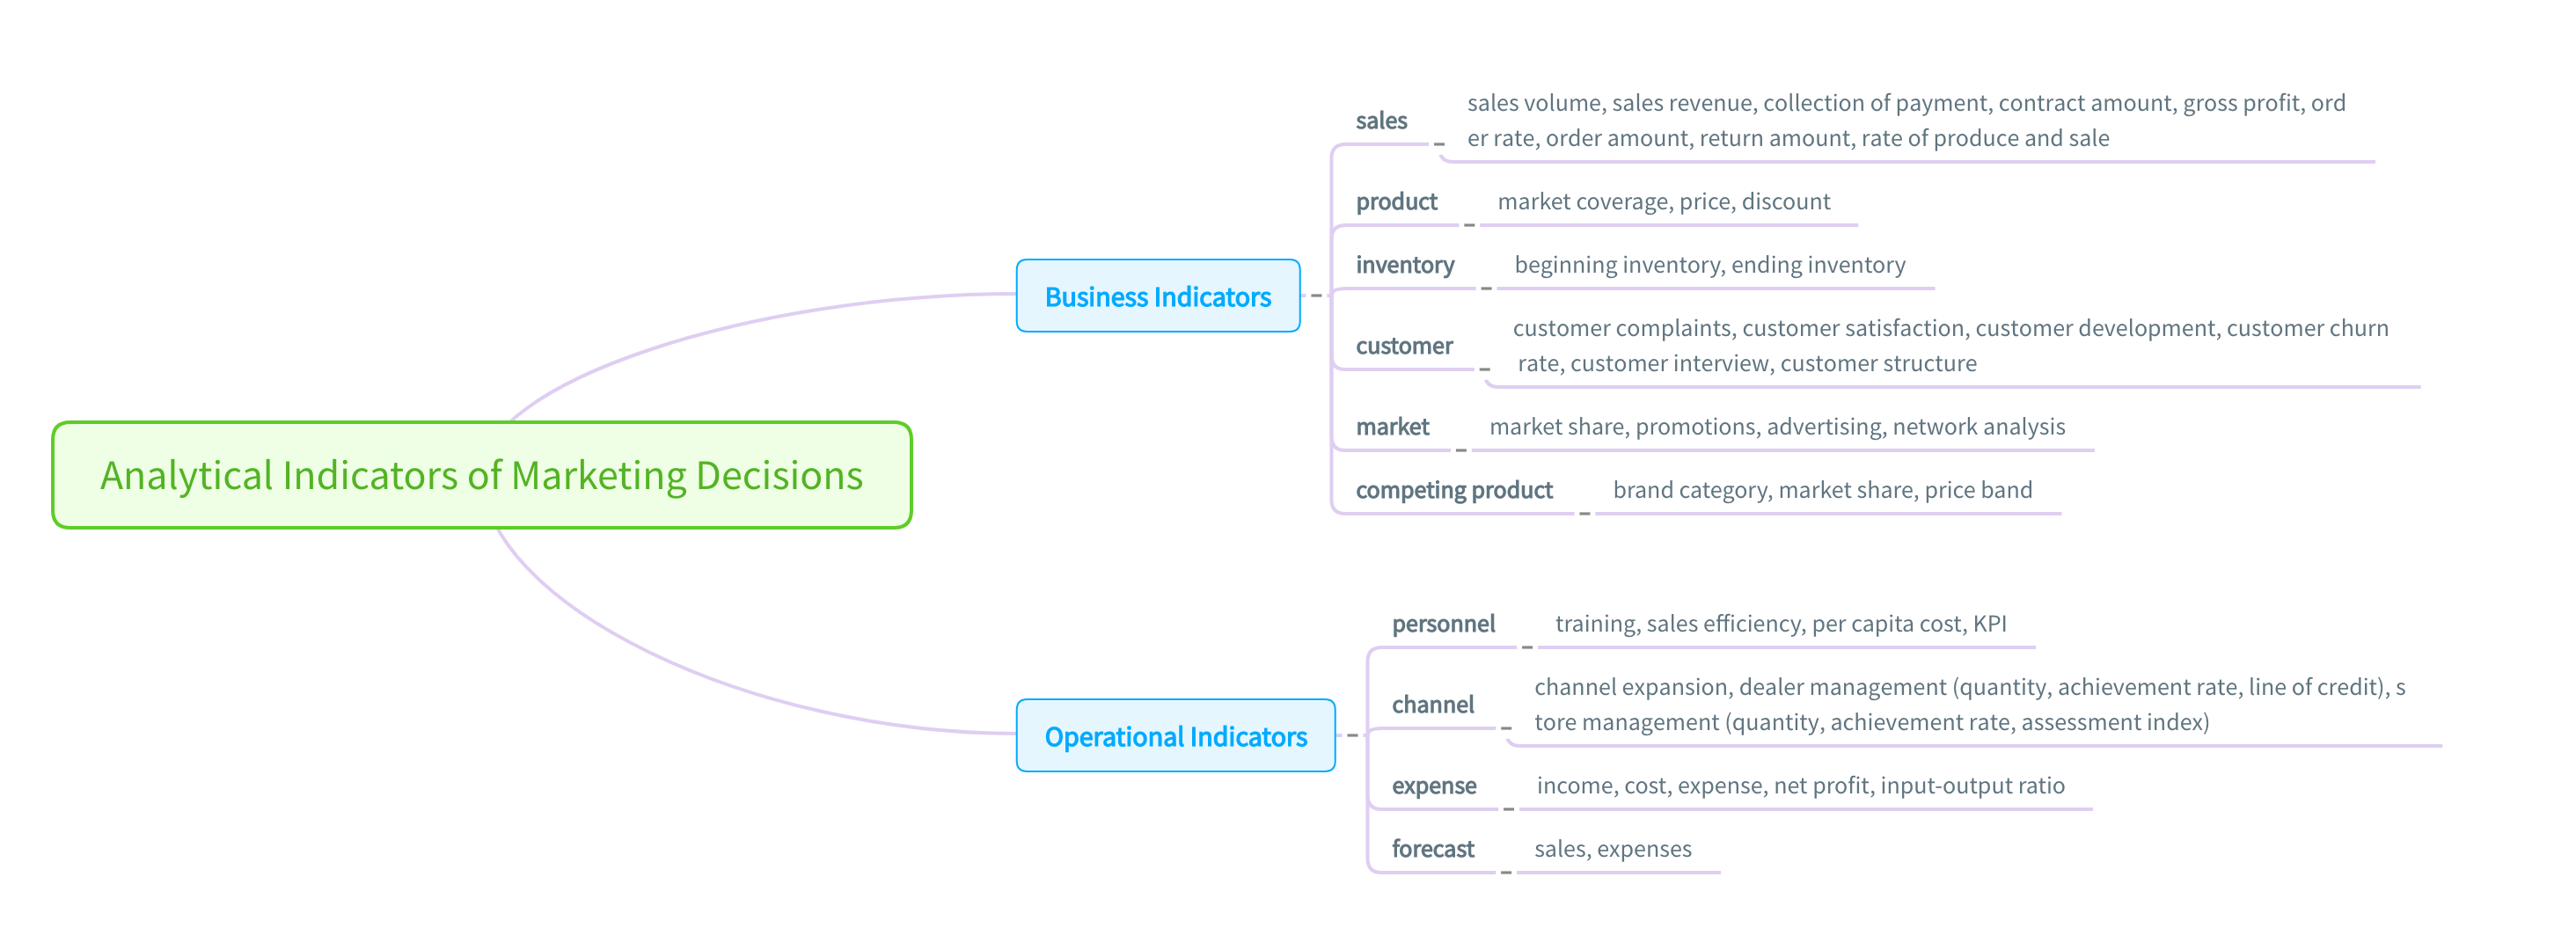
There are many ways to decompose indicators of marketing decisions. Here, I only focus on the two cores: business and operation module.
The business module contains indicators in the entire marketing process, such as sales, orders, contracts, shipments, returns, etc., as well as indicators for the front end and the terminal of business process, such as product prices, inventory, customer satisfaction, market share, and so on.
The operation module contains relevant analysis indicators, such as personnel, channels, expenses, and forecasts involved in the marketing process. These are the prerequisites or media for the realization of the business process and the results of the implementation.
The specific indicators can be seen in the following picture.
1.2 Dimension
With indicators, there is a basis for performing analysis. And then, we must select the appropriate dimensions and methods to analyze these indicators. The combing of dimensions not only helps us master the data analysis work faster, but more importantly, it can guide the data warehouse modeling of IT staff in the implementation process.
In the analysis of marketing decision-making, the commonly used analysis dimensions are: department (headquarters, various business divisions, etc.), region (South, North, etc.), category (product category), series (product segmentation), channels (dealers, direct selling, agents, etc.), customers (generally graded by importance), time (day, month, quarter, year, etc.), and some custom dimensions within the enterprise.
1.3 Method
The indicator is presented in a certain dimension, and the selection of the presentation way involves the analysis method.
The analysis methods commonly used in the marketing system are: accumulation, proportion, ranking, comparison, trend, average, and so on. The information expressed by the analysis reports made by different analysis methods is different. In the early stage of needs assessment and business logic communication, the analysis method should be determined, which will often get twice the result with half the effort, and the effect is remarkable.
After the key indicators are determined, the following decision analysis modules are planned, including five: management cockpit, marketing KPI system, dealer and store management, competing product analysis, and predictive analysis. The dimensions and methods of analysis are based on the purpose of analysis by different modules. I will describe the contents of each module in detail below.
2. Management Cockpit
The management cockpit is proposed for marketing leaders. The purpose is to let them grasp the overall marketing overview and the abnormality of key indicators in real-time. It is a typical multi-indicator and multi-dimensional linkage drilling analysis.
Based on the above business indicators and operational indicators, we can produce the following cockpit reports.
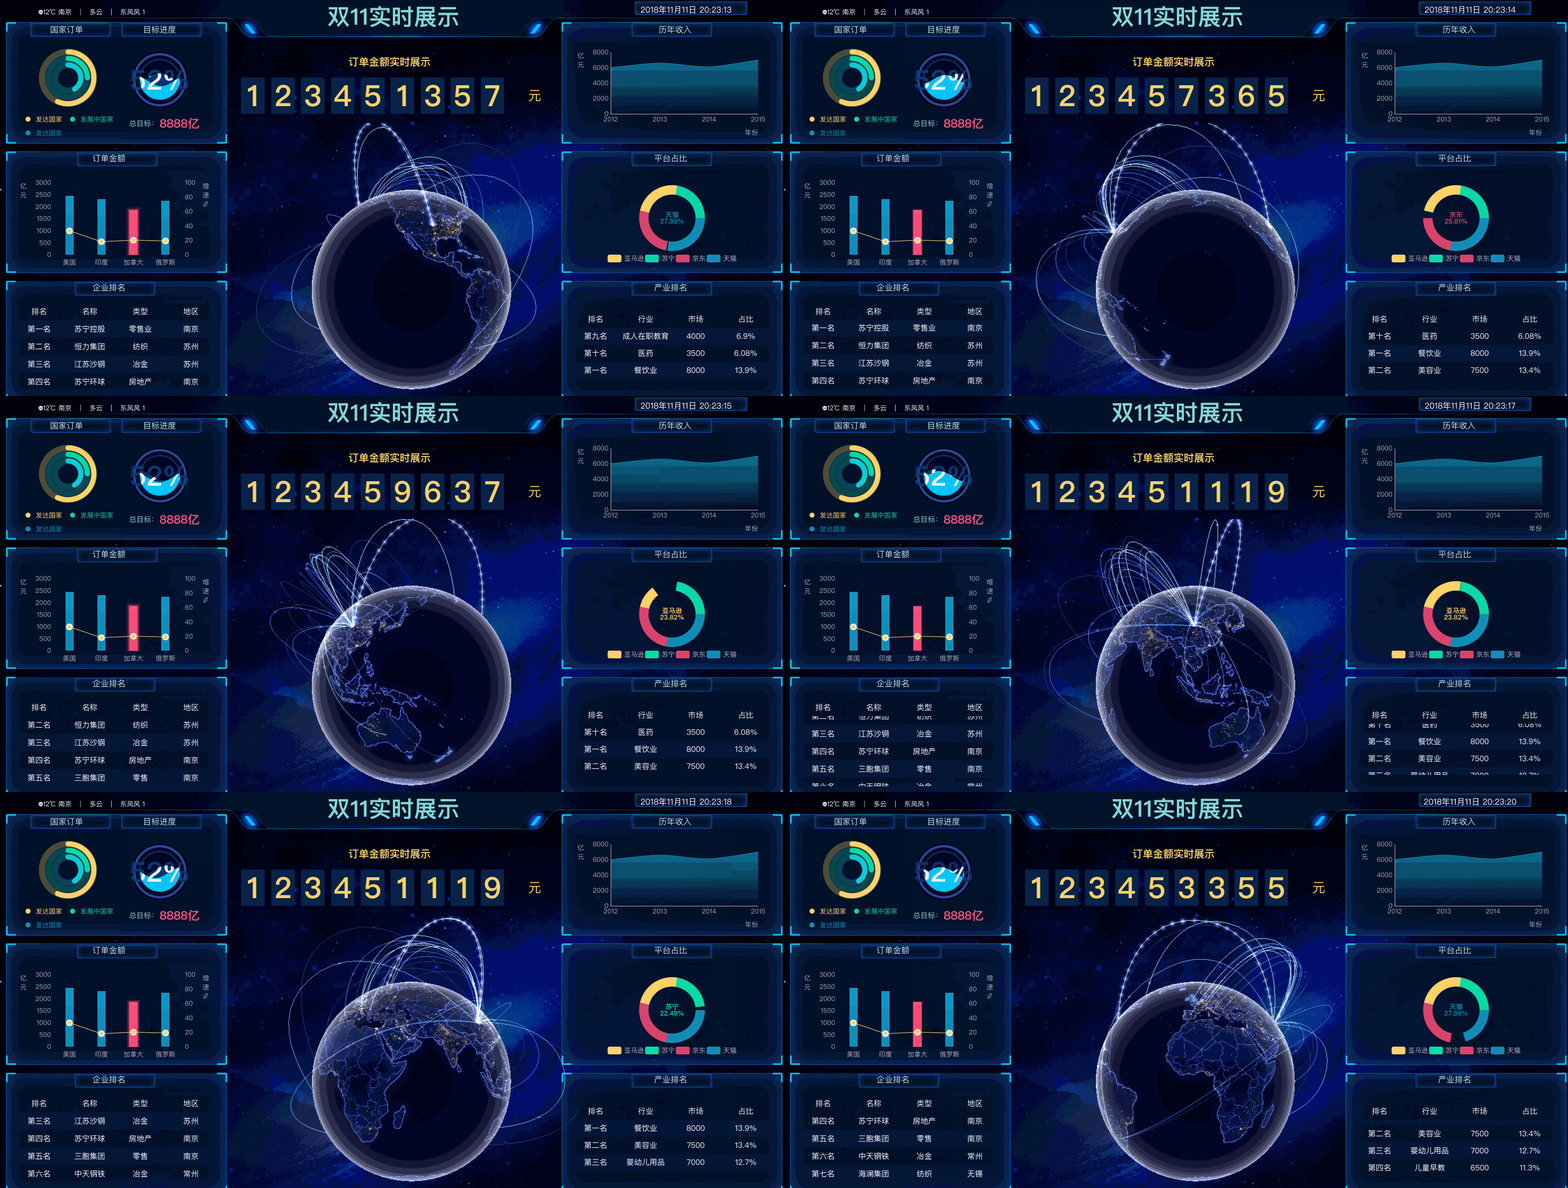
2.1 Report of Marketing Real-time Operations
In order to grasp the real-time overview of marketing, it is more intuitive and clearer to display the data of the regional dimension with a heat map. Set the top ranking of the region and use pressure competition to increase the value of the business. The proportion of variety categories is to understand the proportion of sales. And key indicators can be displayed by a dashboard or numerical value. Detailed data can be presented in the form of linkage or drilling; it is recommended to use drilling. If there are too many elements on a single page, users will feel visual fatigue.
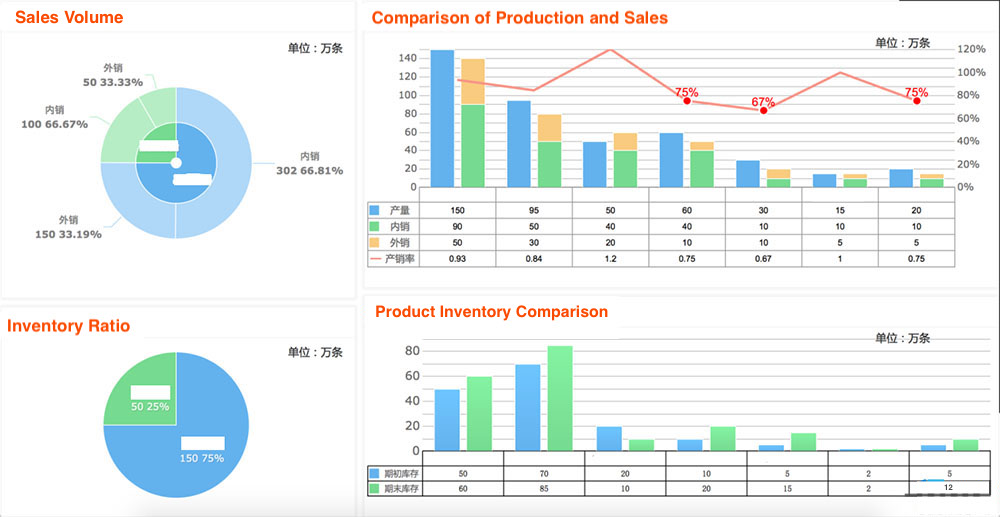
2.2 Report of Production, Sales, and Inventory
The basis of marketing is to maintain a good balance of production, sales, and inventory. There should be no out-of-stocks or excess supply of goods. Compare the quantity of production online with the quantity and sales volume of finished products, monitor the beginning and ending inventory, set the inventory warning line, and predict the out-of-stock risk and the backlog cycle. It is best to directly locate the responsible department or individual and to push the abnormal data to the leader to achieve a good cycle of PDCA (plan, do, check, and act).
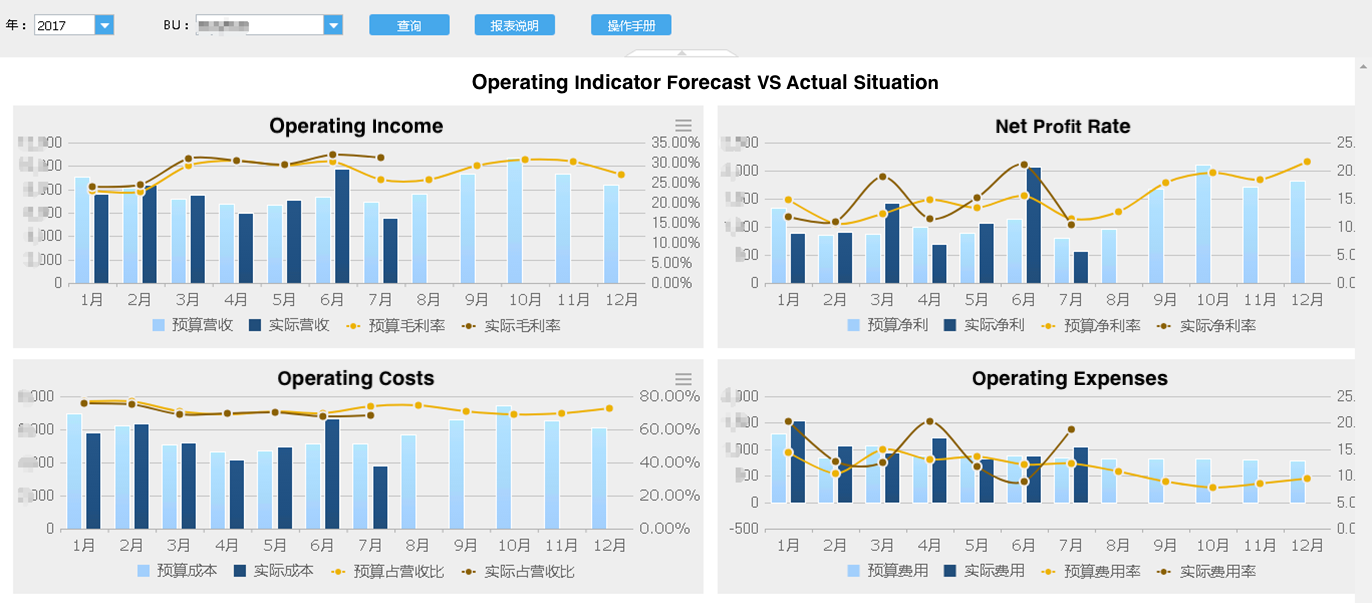
2.3 Comparison of Reality and Prediction
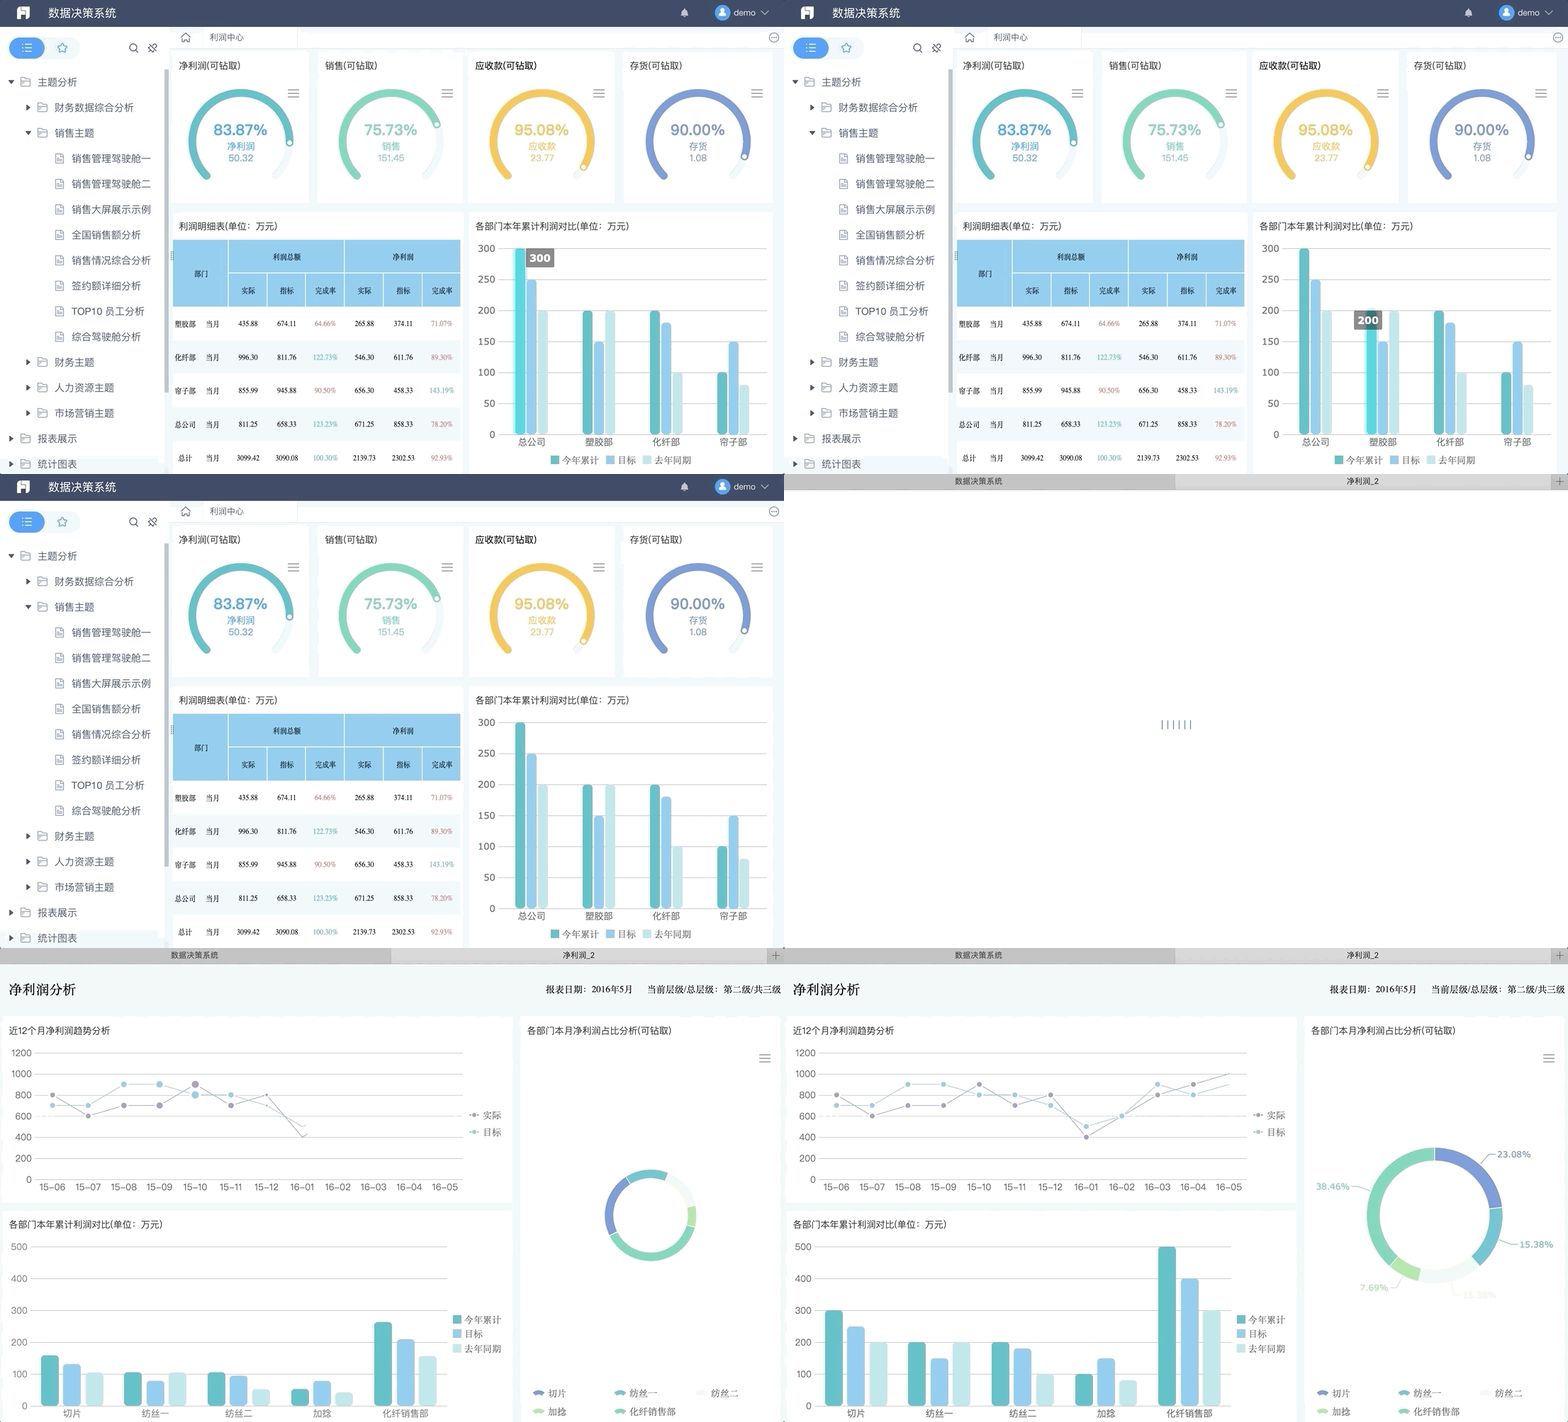
For marketing operations, the main indicators are sales, sales costs, expenses, and profits. The following case diagrams show the analytical value. Comparing the monthly budget with the actual value, you can see the accuracy of the predictive work. For example, the prediction for the net interest rate in June was too low because the cost increase in June was not predicted in May. We further drill down the data to analyze, and we find that the company may increase a lot of manpower. The reason for the inaccuracy of prediction may be the deviation of information exchange between personnel and finance, so that we can solve the problem in a targeted manner.
2.4 Report of Monthly Key Indicators Overview
The cockpit of the business overview and operational overview is required. Present several key operational indicators that leaders are concerned with in different ways, such as dealer store rankings, regional sales profit rankings, net profit trends, overall target achievement, etc.
3. Marketing KPI System
In the marketing operation, people's efficiency and input and output are more important. Therefore, it is necessary to establish a perfect marketing KPI system. Assign some indicators into specific individuals or a certain department and region as performance evaluation indicators. This will cause a supervisory and incentive effect.
3.1 KPI System
The key indicators of marketing are sales, customer number, return amount, profit margin, efficiency, achievement rate, growth rate, etc. Sales, customer number, return amount, and profit rate are key indicators for measuring the personal business ability of marketing personnel, and efficiency (value/cost) is used to measure the efficiency of his work. The achievement rate is compared with the planned value to measure the ability to resist stress. The growth rate is an indicator that many companies ignore. It is unreasonable to evaluate the performance of employees only from the data of a given month.
The KPI system should be constructed from three perspectives: comparative incentives, regulatory reports, and meeting reviews.
- Comparative incentives are the process of horizontal and vertical comparison between employees or departments (the most typical sales ranking, target achievement rate), which motivates employees through comparisons.
- The regulatory report focuses on the accurate presentation of data, historical archiving, and hierarchical reporting processes to achieve a top-down monitoring and management system.
- The meeting review is to praise the good aspects, summarize the shortcomings, and test the rationality of the marketing strategy from other dimensions.
3.2 KPI Report
KPI reports should be developed separately according to different objects, which are considered in three dimensions: individual, region or department, and totality.
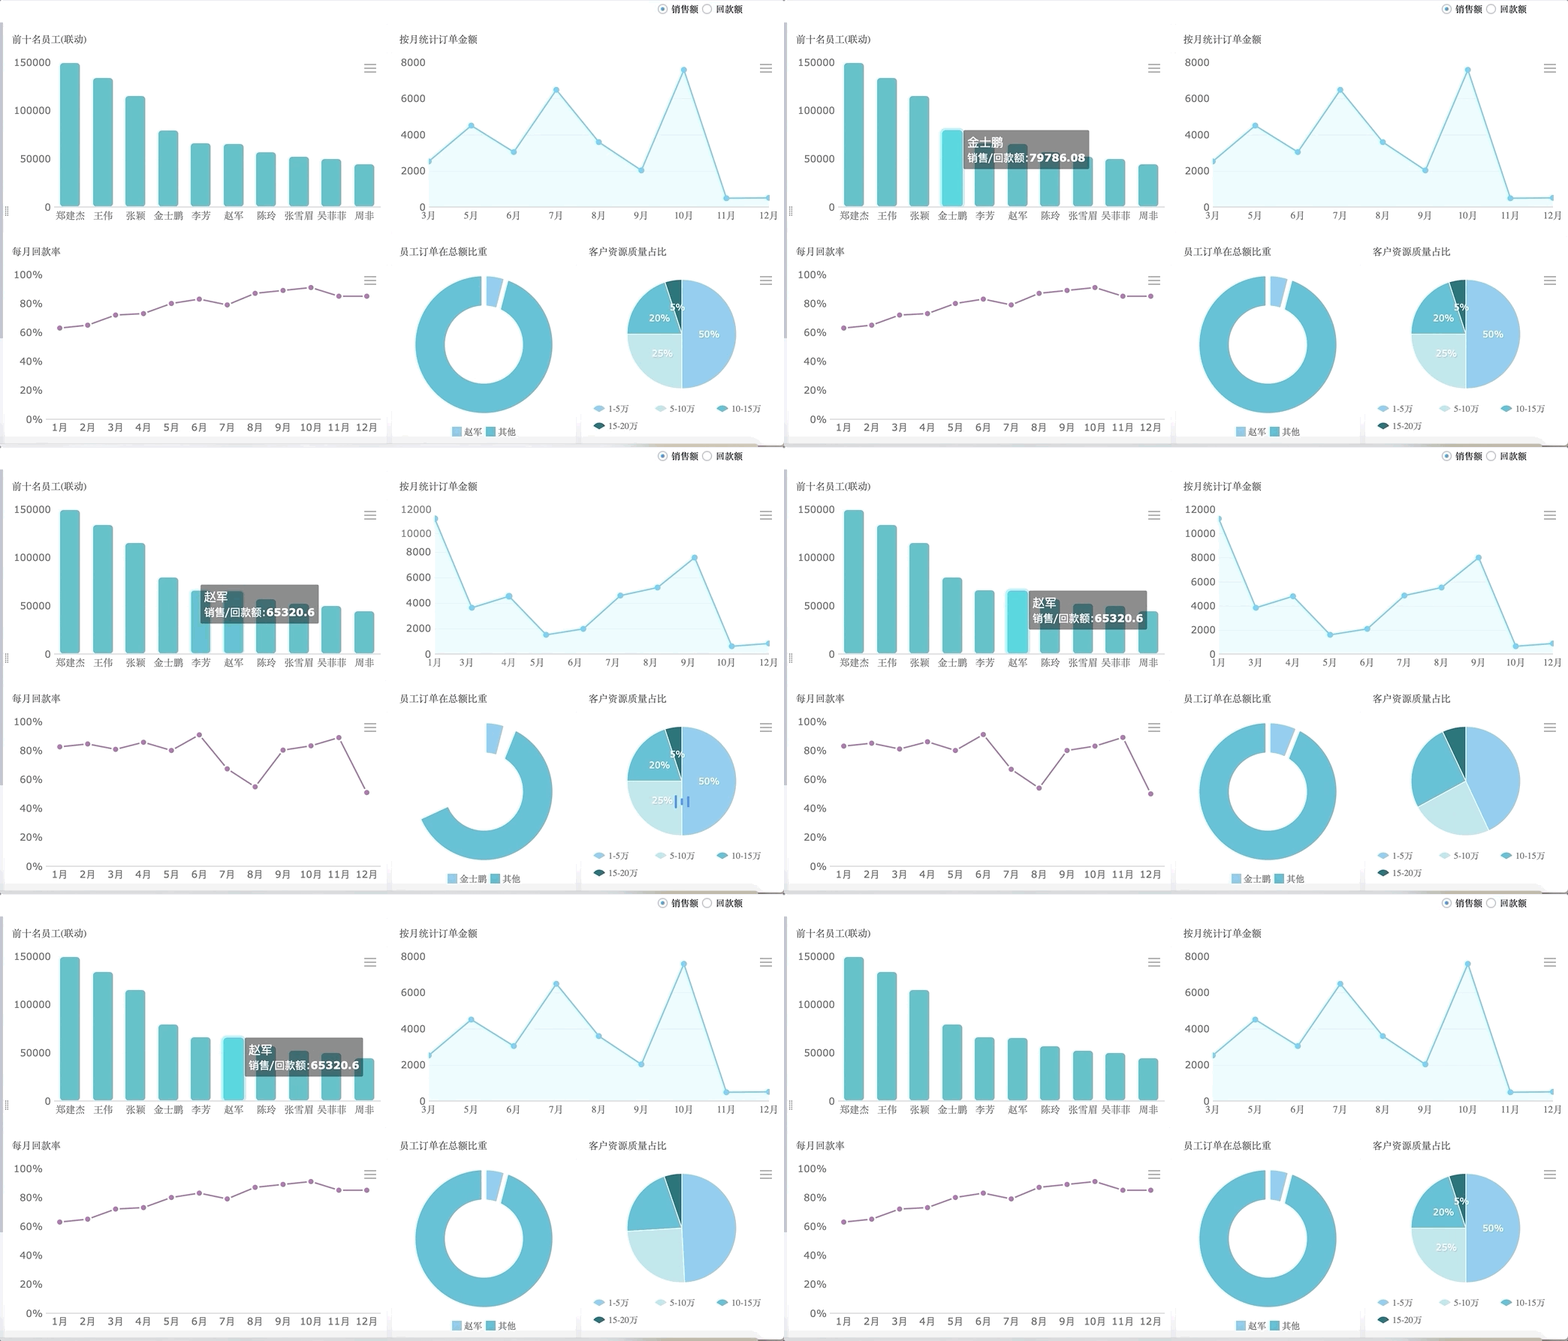
Individual: Self-Motivation
The KPI of the individual should be intuitive and clear and directly show the sales, cost of sales, expenses, and net profit generated by the individual. There should also be comparisons with others; these comparisons are best in the form of a histogram ranking, allowing each regional or department head to monitor the performance of their own employees.
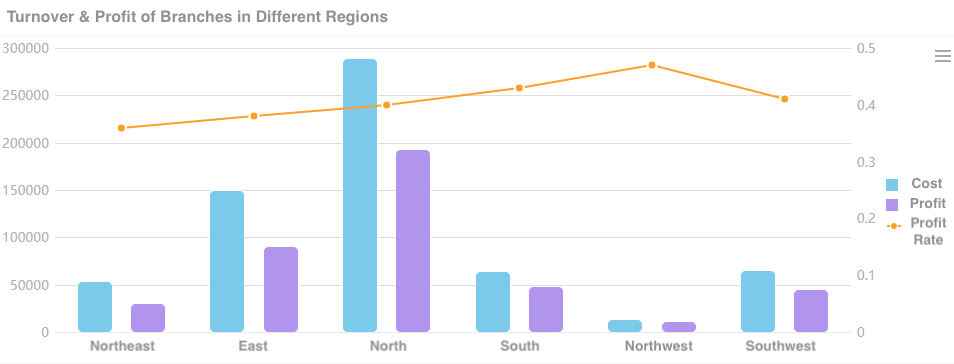
Region or Department: Team Competition
Market conditions in different regions vary. Different departments are responsible for different products or regions. It is unreasonable to just use sales as an indicator. The profit rate can eliminate this irrationality under certain circumstances. However, there may be cases where sales in some regions are too low and business changes are large. Therefore, it is reasonable to measure the performance of different regions or departments by profit and profit rate.
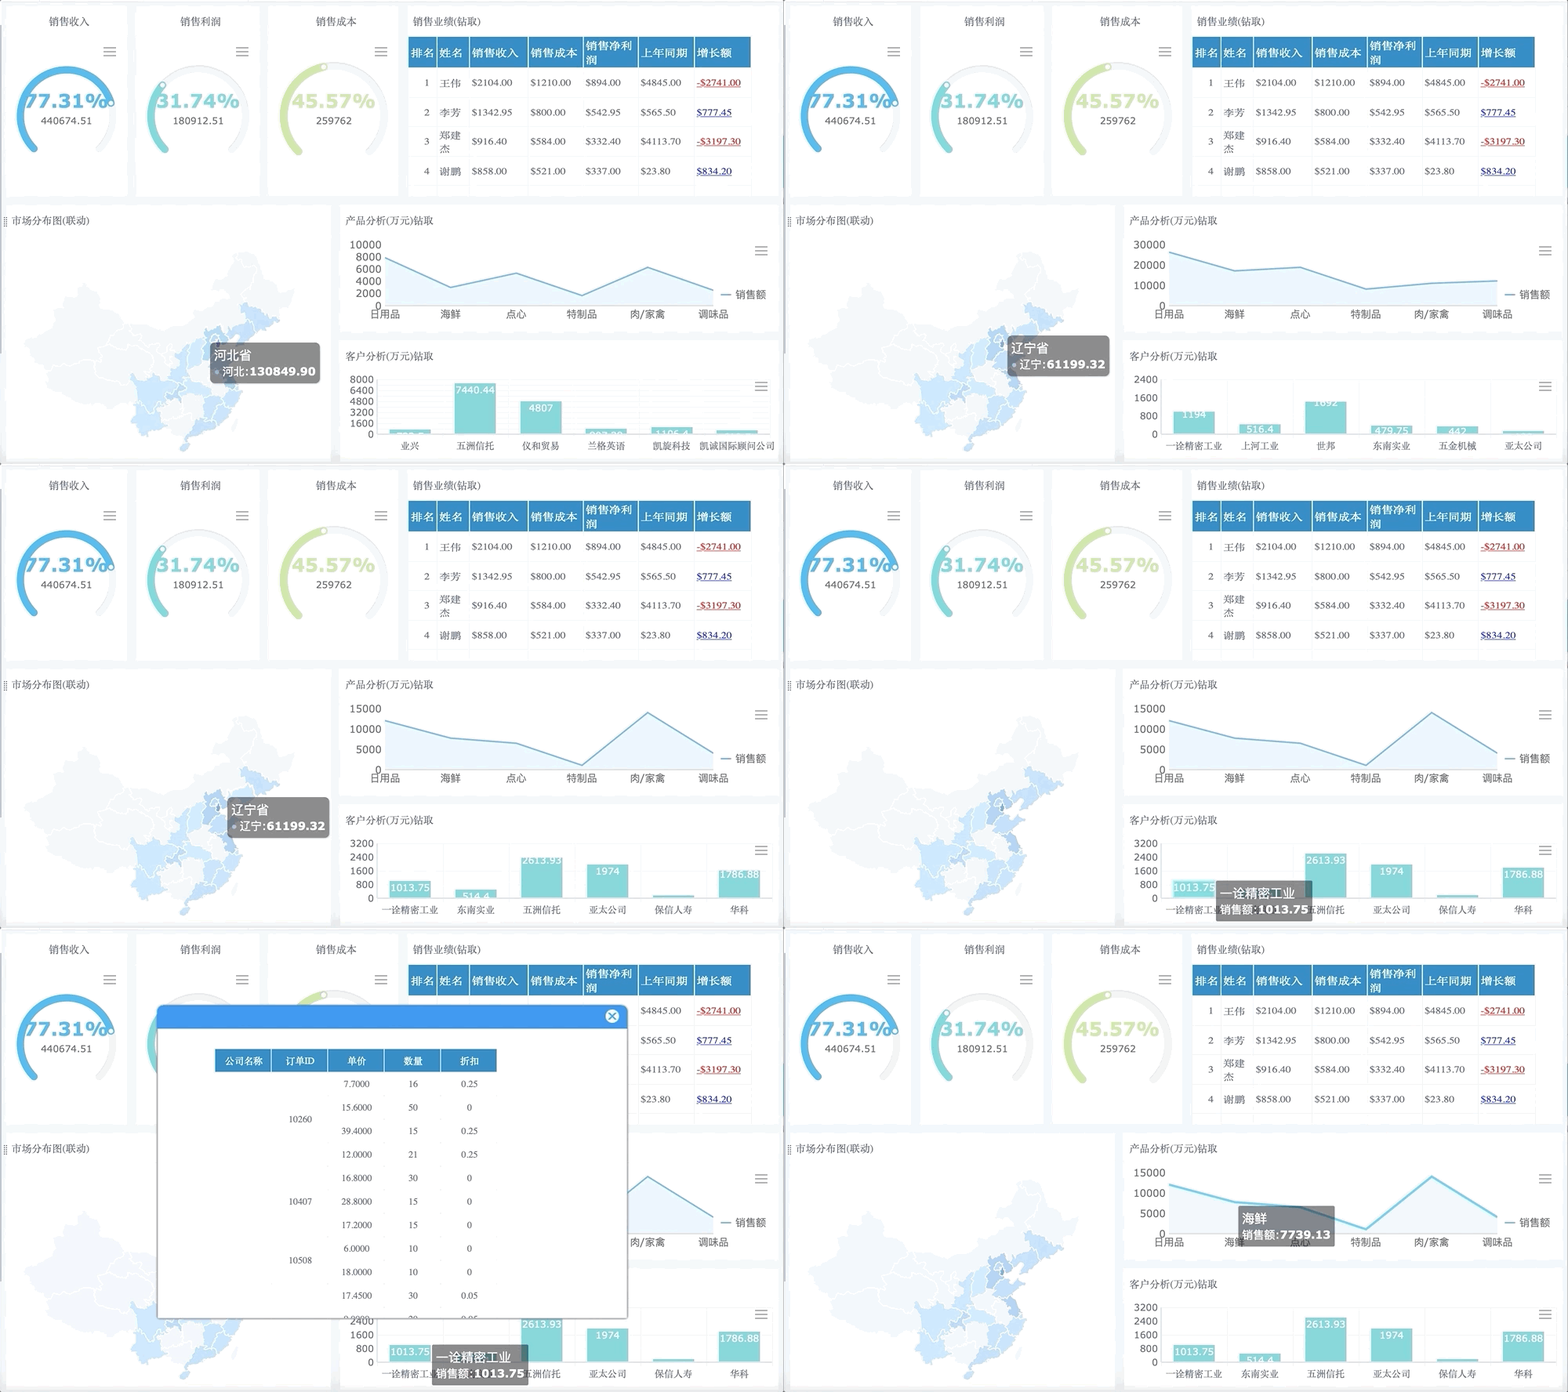
Totality: Self-Assessment and Reporting
It is necessary to measure the KPI from the perspective of marketing as a whole. The self-assessment can be used as a reference for the next stage of the plan, and there is also a database for reporting to a higher level. The self-assessment is also a display of sales, profit, and other indicators, but the purpose and focus are different. We should analyze from the plan completion rate, and the trend analysis should be done according to the time dimension, reflecting whether the department is continuously increasing income or losing money. Finally, we should calculate the per capita benefit from the overall perspective and judge whether the resource is released reasonably.
4. Dealer and Store Management
For the home appliance industry, there are more dealers and stores in the normal marketing model (I will talk about the exceptions like e-commerce in the competing product analysis), so the management of dealers and stores is especially important. We have to analyze them from two angles.
4.1 Overall Situation: Unified Management of Enterprise
The data of all dealers and stores are regularly aggregated to the corporate headquarters. The headquarters performs a unified data cleaning and conversion operation, which can be made into a cockpit-style dashboard, including information on the number of all dealers or stores, total orders, total sales, and total inventory.
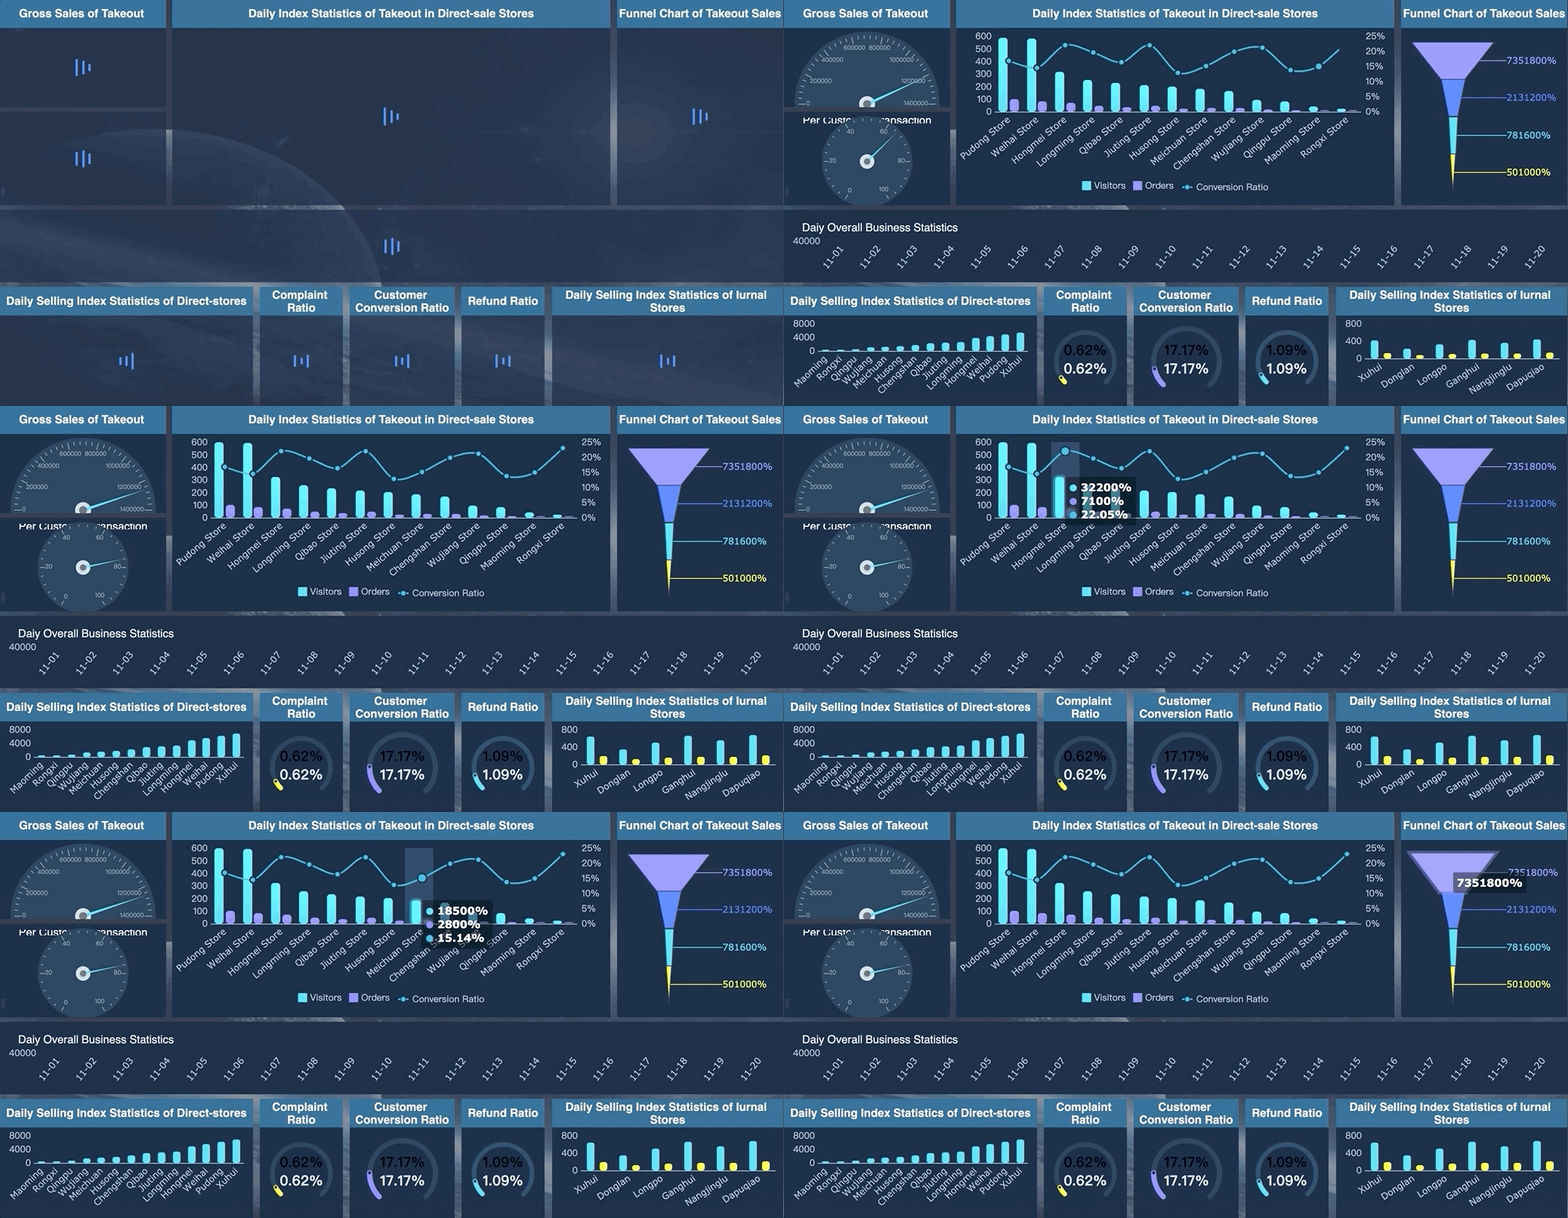
4.2 Single Case: Self-Management for Each Dealer or Store
For the data provided by each dealer or store, make some targeted reports, and then strictly control the permissions. Only open these reports to them to facilitate their internal management. The presentation form of the reports is similar to that of the management cockpit. It is also divided into two parts: business and operation. However, some indicators are not necessarily given to dealers or stores, such as profits. In the early stage, this model can be started from several dealers with better cooperation, which is convenient for horizontal promotion in the later period.
5. Competing Product Analysis
Knowing yourself as well as the enemy is also the focus of the marketing strategy. I will use the data of the e-commerce platform as the analysis object and talk about it in detail in the next article. If the company has other data sources, we can also discuss the corresponding analysis plan.
6. Predictive Analysis
A very important part of marketing operations is forecasting, including market trend forecasting, sales forecasting, and cost forecasting. It is used to develop marketing strategies and guide regional marketing work in advance to promote the achievement of plans and goals. Then, compare the predicted value with the actual value and continue to correct it to provide the data foundation for the KPI.
6.1 Method of Prediction
Forecasts made through data are generally quantitative analyses. However, the analysis of external factors, such as demand changes, economic changes, horizontal competition trends, government policies, and changes in consumer attitudes cannot be quantified. Therefore, forecasting work generally has no established formula. It needs to be combined with the manager's thinking, and the predicted value will be stored in the database through data filling and entry, so that the forecasting work can affect the order planning and production scheduling and sales plan for the next month.
Trend Prediction
The historical data is weighted and averaged according to time dimension. The weighting coefficient can be adjusted according to the influence of seasons or holidays and then multiplied by the historical average rate of growth to obtain the predicted value of the next period in the current trend. Next, verify the result with the previous year's value.
Causal Forecasting
Use the regression analysis method to perform a regression calculation on the relevant set of data. Then, you can obtain the predicted values of the next time node, such as the range hood and the range hood set, which are highly relevant.
6.2 Forecast Report
The predicted value enters the database by means of report entry, and then it is displayed at the front end through the reporting tool. It can be compared with the actual value to judge whether the actual sales target is up to standard. It can also be used as the basis for KPI assessment. In addition, it helps to judge the accuracy of the prediction and the rationality of the planning.
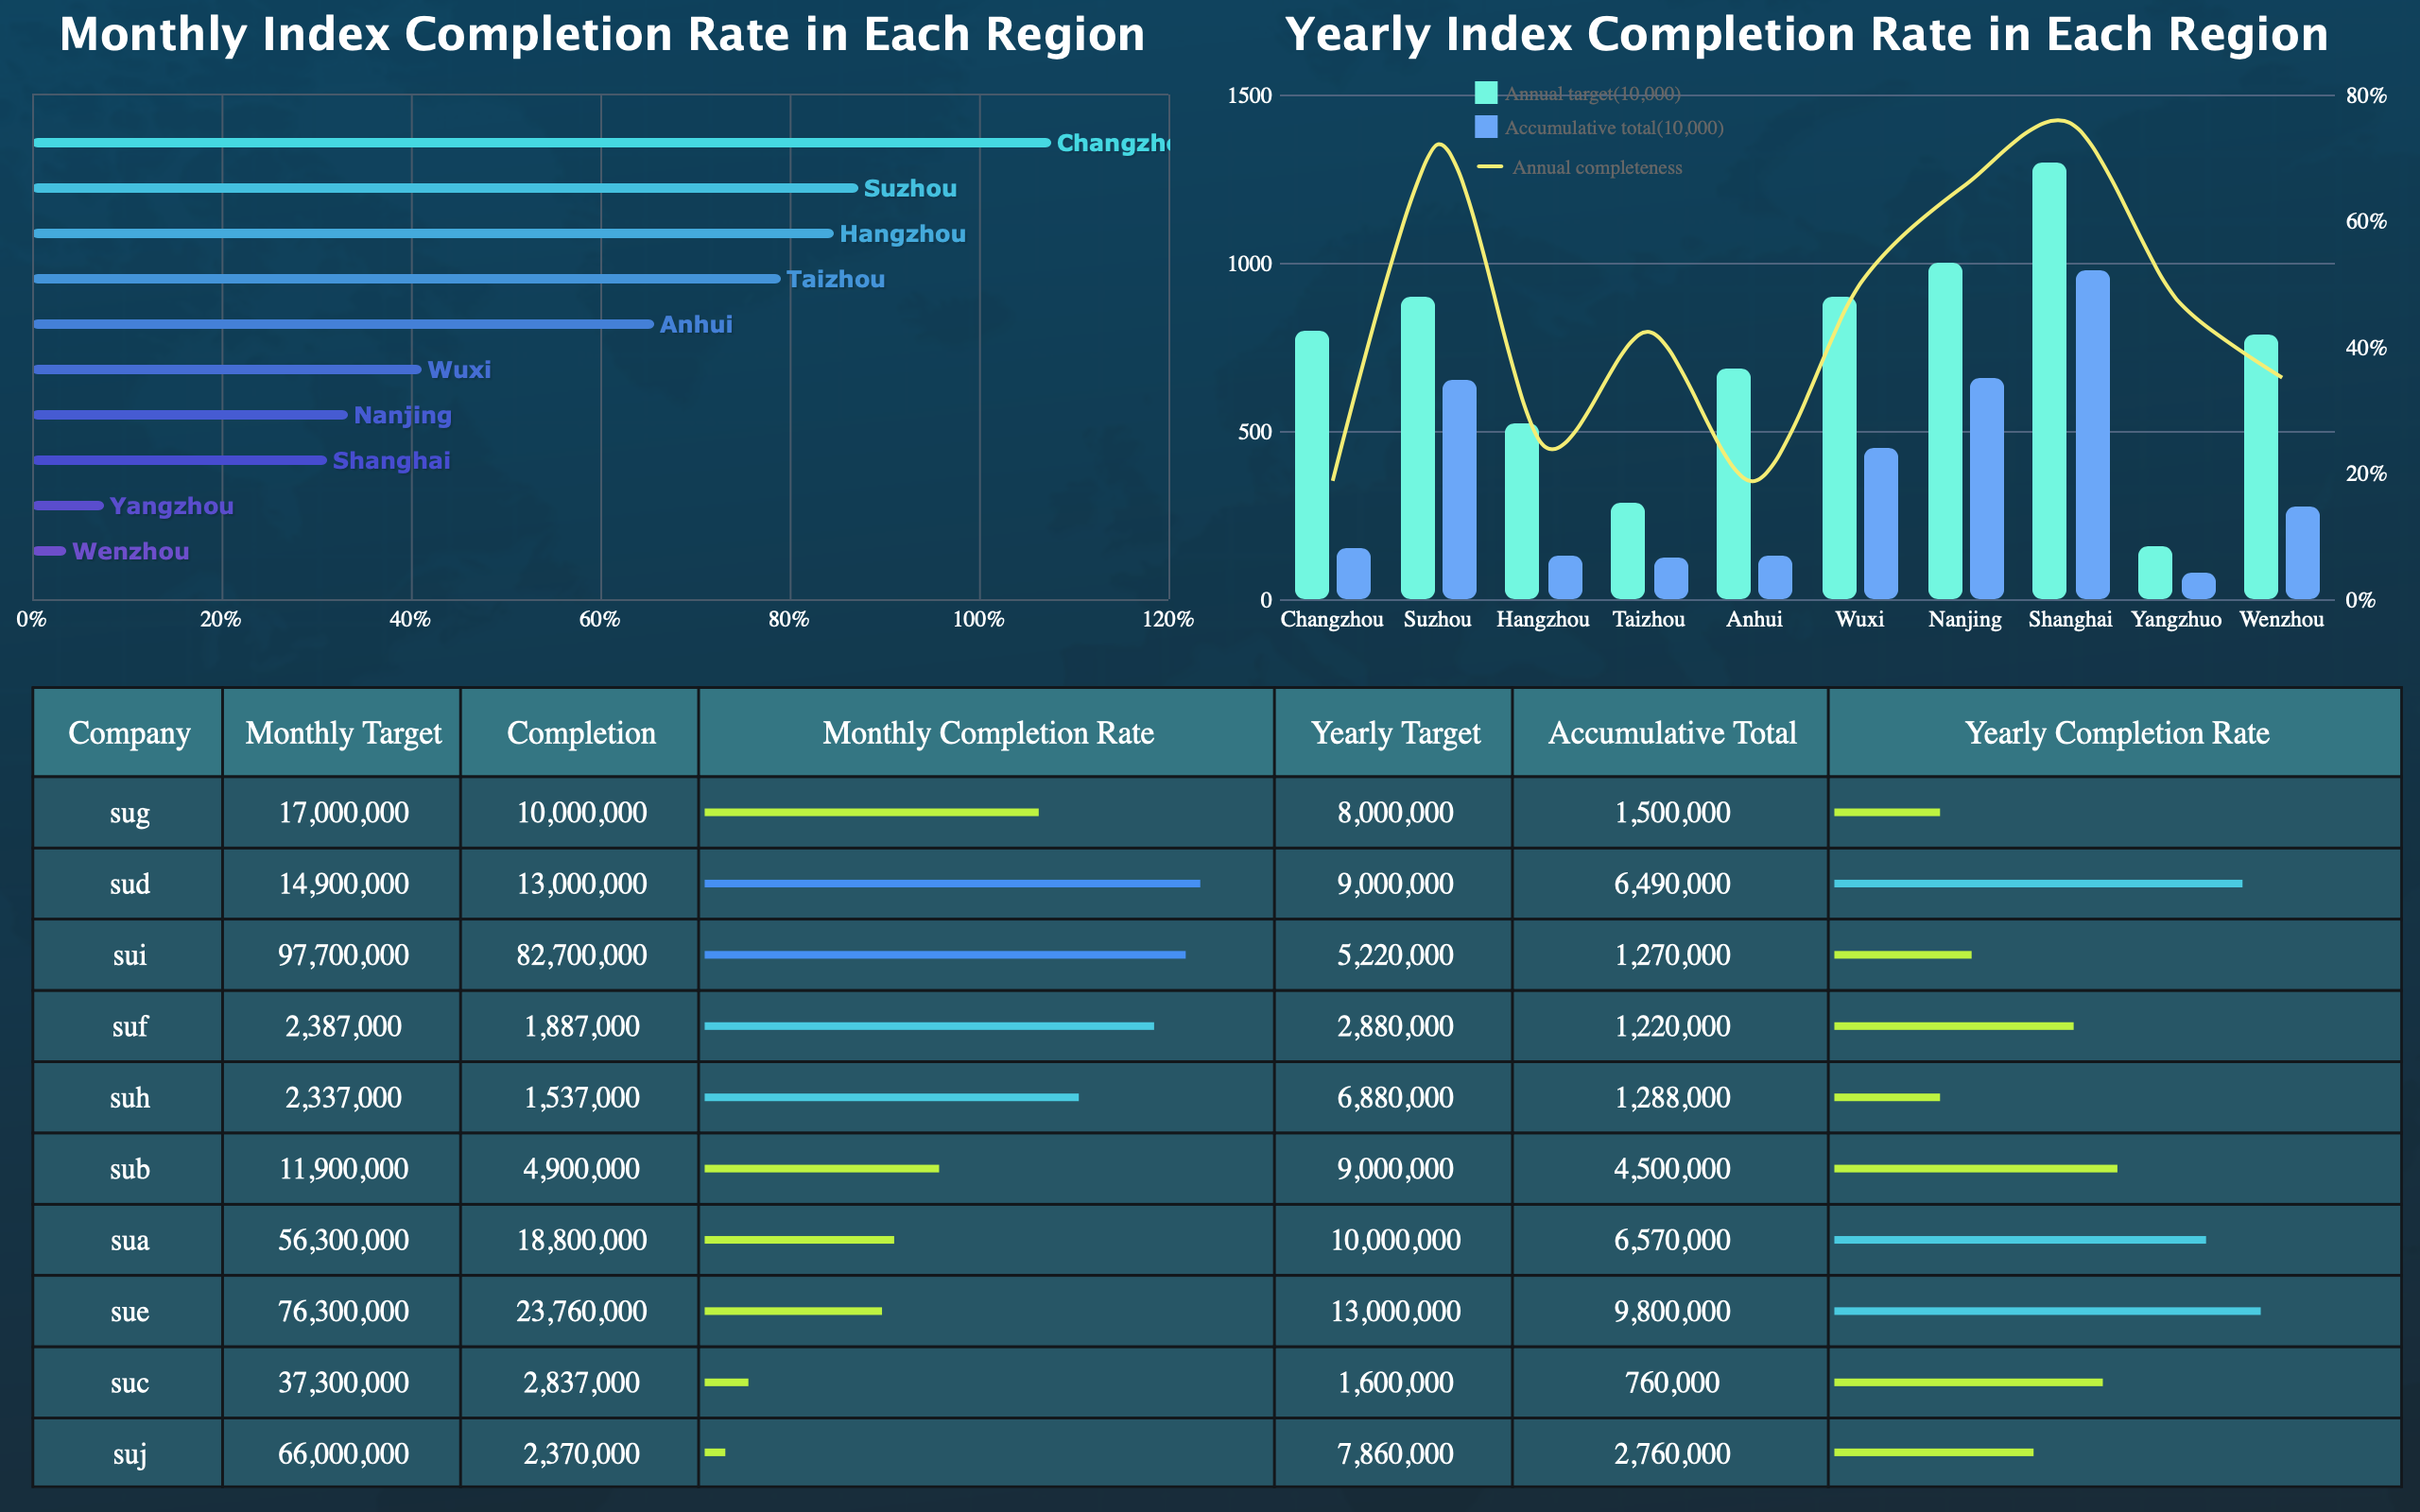
7. Get Started with Marketing Decision Analysis
After reading this article, I believe you have a general understanding of the entire marketing decision analysis system, then you need to choose a simple and practical tool to practice. The reports in all of the above examples are created with the professional reporting tool FineReport.
Other common tools are Tableau, Qlikview, PowerBI, etc., which have their own advantages in data analysis. I have covered some of the tool types like analysis tools and code tools in the article What Data Analysis Tools Should I Learn to Start a Career as a Data Analyst?. For business analysts and technical analysts, the requirements and the tools they use are quite different. But anyway, you can choose the tool you are familiar with or you are good at to make marketing decision analysis, the most important thing is to act now!
Published at DZone with permission of Lewis Chou. See the original article here.
Opinions expressed by DZone contributors are their own.

Comments