How to View JMeter Test Results in Real-Time
The standard way to use JMeter is in non-GUI mode (CLI). By running in CLI mode, users save resources and ensure their test results are reliable. Using the JMeter GUI is meant only for test recording, development and debugging.
Join the DZone community and get the full member experience.
Join For FreeThe standard way to use JMeter is in non-GUI mode (CLI). By running in CLI mode, users save resources and ensure their test results are reliable. Using the JMeter GUI is meant only for test recording, development and debugging.
The Problem: JMeter Limits Viewing Test Results in Real-Time
However, running JMeter in CLI mode may limit users who want to understand what is going on in their test in real-time, as CLI mode prevents incorporating Listeners during the test run. Any Listeners you happened to have in your test plan were probably GUI-mode-specific and don’t send anything to non-GUI mode.
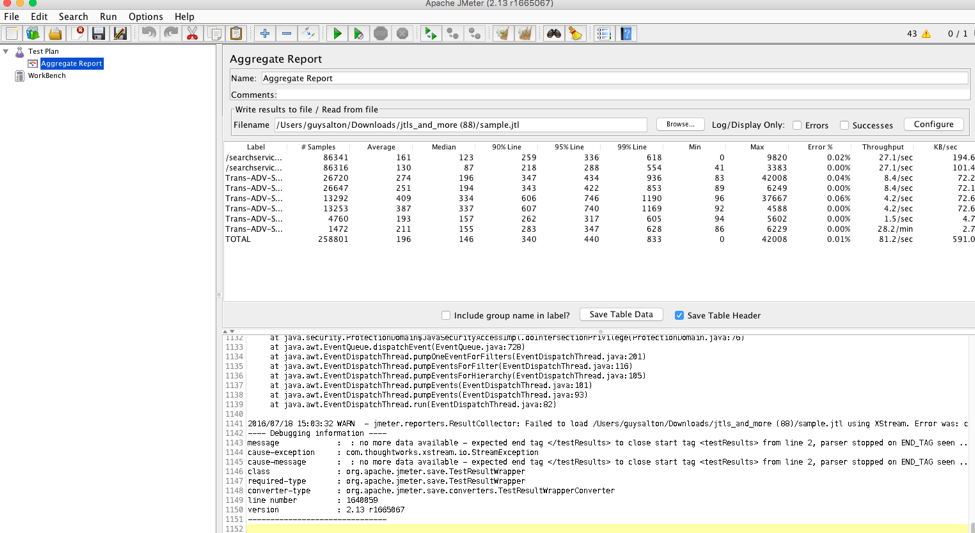
Today, when users want to understand what happened in their test, they have to wait for the test to finish running. Then, they take the sample.jtl file that their load test produced, open the JMeter GUI and add their desired listener to the test plan. They can then load the sample.jtl file into the Listener and see the reports/graph.
The Solution - Viewing Reports in Real-time with BlazeMeter and Taurus
BlazeMeter has a solution for you. By using Taurus, an open-source test automation tool, users can run their existing JMX scripts in CLI mode from the command line (or create new JMeter scripts in a simple YAML format) and view the test reports in real-time, as a means for ensuring everything is going smoothly.
Using Taurus and BlazeMeter for this purpose is available to everyone and doesn’t require signing up.
How to Run JMeter Tests on Taurus
For a detailed explanation, see here.
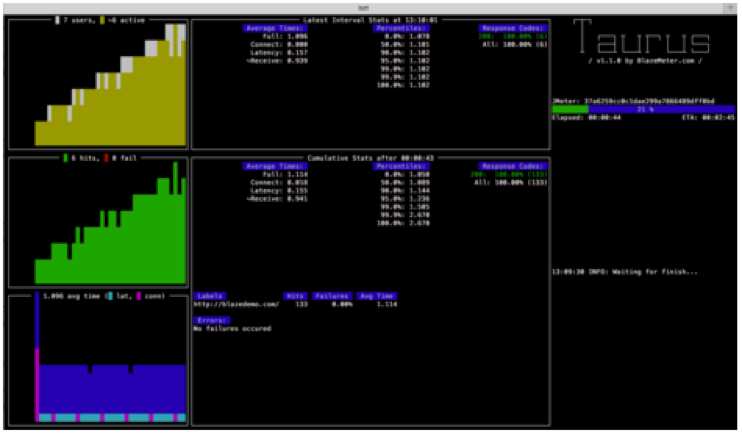
2. To run your JMX file, use the bzt command and then the JMX path. For example, bzt example.jmx. After a few seconds, you will see the Taurus dashboard and its reports with KPIs and statistics.
See the detailed explanation for learning how to create a JMeter script with YAML and adding JMeter properties to your script.
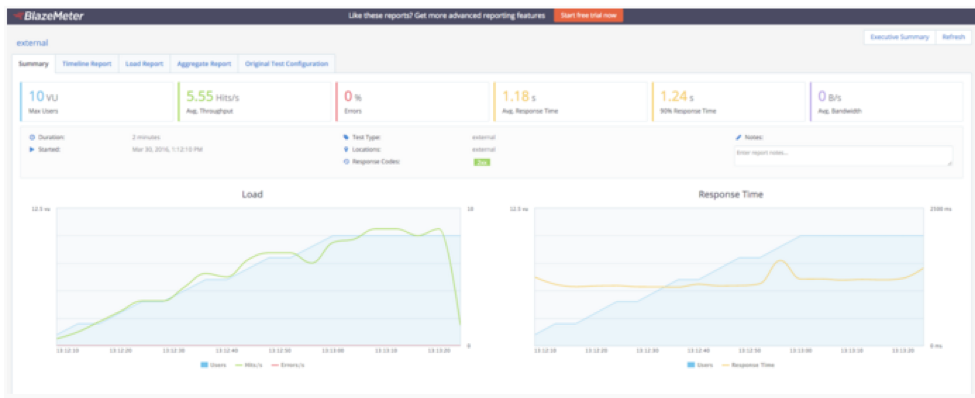
Running your JMeter script on Taurus also enables you to view and analyze your test results on BlazeMeter. BlazeMeter reports are easy to use, compare different executions, monitor trends over time and enable collaboration. Type -report and your tests will be sent to BlazeMeter.
Congratulations! You can now easily run your JMeter scripts in CLI mode without using the JMeter GUI and still view all the analytics you need in a visualized and friendly format. Click here to go to Taurus and learn more.
Published at DZone with permission of Guy Salton. See the original article here.
Opinions expressed by DZone contributors are their own.
Comments