Implementing Real-Time Datadog Monitoring in Deployments
Implementing real-time monitoring during deployments can significantly reduce potential impact during incidents.
Join the DZone community and get the full member experience.
Join For FreeIn today's tech landscape, where application systems are numerous and complex, real-time monitoring during deployments has transitioned from being a luxury to an absolute necessity. Ensuring that all the components of an application are functioning as expected during and immediately after deployment while also keeping an eye on essential application metrics is paramount to the health and functionality of any software application. This is where Datadog steps in — a leading monitoring and analytics platform that brings visibility into every part of the infrastructure, from front-end apps to the underlying hardware. In tandem with this is Ansible, a robust tool for automation, particularly in deployment and configuration management. In this article, we will discover how Datadog real-time monitoring can be integrated into Ansible-based deployments and how this integration can be leveraged during deployments. This concept and methodology can be applied to similar sets of monitoring and deployment tools as well.
Why Integrate Real-Time Monitoring in Deployments?
In the ever-evolving realm of DevOps, the line between development and operations is continuously blurring. This integration drives a growing need for continuous oversight throughout the entire lifecycle of an application, not just post-deployment. Here's why integrating Datadog with your deployment processes and within your deployment scripts is both timely and essential:
- Immediate Feedback: One of the primary benefits of real-time monitoring during deployments is the instant feedback loop it creates. When an issue arises after deploying to a host or hosts during a rolling deployment, the real-time monitoring data can be immediately used to make a decision to pause or initiate a deployment rollback. This quick turnaround can mean the difference between a minor hiccup and a major catastrophe, especially for applications where even a 1-minute downtime can result in a substantial number of errors and lost revenue.
- Resource and Performance Oversight: As new features or changes are deployed, there's always the risk of inadvertently impacting performance, resource utilization, and the associated costs. With such real-time monitoring, teams can get an immediate read on how these changes affect system performance and resource utilization, thereby determining any immediate remediations necessary to ensure that users continue to have an optimal experience.
- Proactive Issue Resolution: Rather than reacting to problems after they've affected end-users, integrating Datadog directly into the deployment process allows teams to proactively address and prevent potential issues from snowballing into a major outage. This proactive approach can increase uptime, more stable releases, and higher overall user satisfaction.
The Process of Implementing Real-Time Monitoring Into Deployment
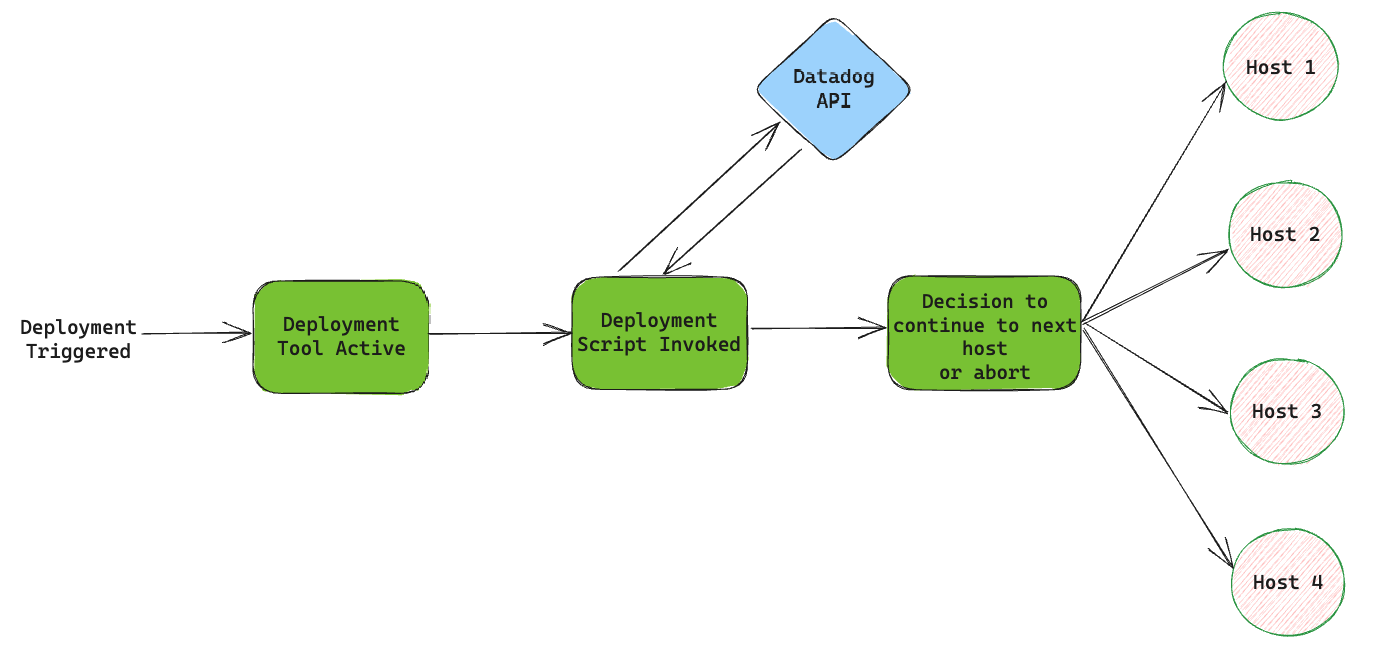
As soon as the deployment tool is triggered and the underneath scripts start to execute, we pre-determine an ideal place to perform monitoring checks based on our application needs and send one or more Datadog API requests querying either metrics, monitor data or any other information that helps us determine the health of deployments and the application in general. Then, we add logic in our scripts so that the API response from Datadog can be parsed and an appropriate decision can be made whether to roll forward to the next group or not. For example, if we determine that there are too many errors and the monitors are firing, we parse that information accordingly and decide to abort the deployment from going forward to the next group, thereby reducing the blast radius of a potential production incident. The below flowchart is a representation of how the process typically works. However, the stages need to be tweaked based on your application needs.
Utilizing Datadog and Its API Interface for Real-Time Queries
Beyond the foundational monitoring capabilities, Datadog offers another pivotal advantage that empowers DevOps teams: its robust API interface. This isn't just a feature; it's a transformative tool. With the ability to query metrics, traces, and logs programmatically, teams can dynamically integrate Datadog deeper into their operations. This allows for tailored monitoring configurations, automated alert setups, and on-the-fly extraction of pertinent data. This real-time querying isn't just about fetching data; it's about informing deployment decisions, refining application performance, and creating a more synergetic tech ecosystem. By leveraging Datadog's API, monitoring becomes not just a passive observation but an active driver of optimized deployment workflows.
Datadog monitors are tools that keep an eye on your tech setup, checking things like performance and errors. They give quick updates, so if something goes wrong, you get alerted right away. This helps teams fix problems faster and keep everything running smoothly. In this implementation, we're going to query the monitor's data to check for any alerts that are firing. Alternatively, we can also query metrics and other similar data that help determine the health of the application.
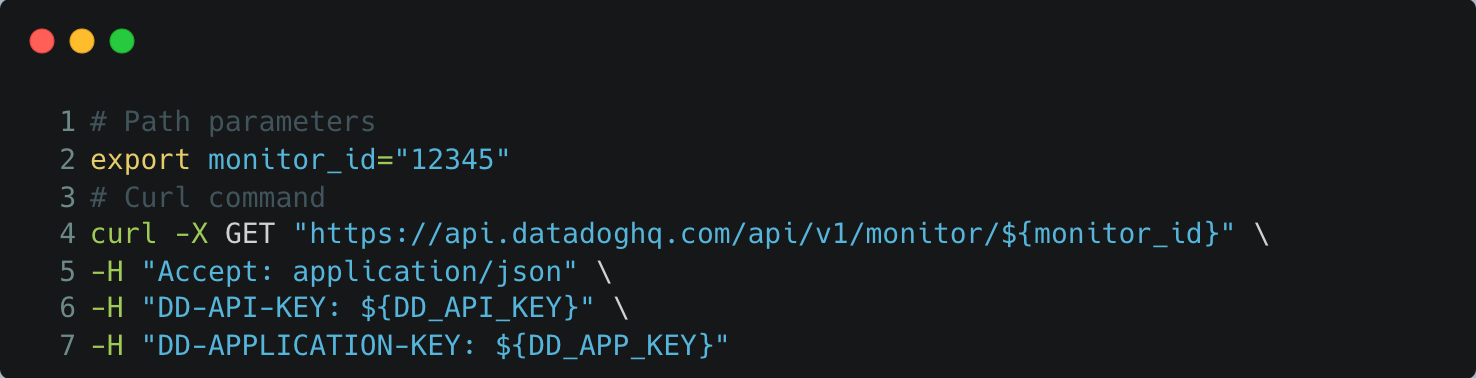
The following is a sample example to fetch the details of a particular monitor (obtained from Datadog's API reference sheet).
Using Ansible as an Example in Deployment Automation
As we delve deeper into sophisticated monitoring with tools like Datadog, it's essential to understand the deployment mechanisms that underpin these applications. We're going to use Ansible in our case as an example. This open-source automation tool stands out for its simplicity and power. Ansible uses declarative language to define system configurations, making it both human-readable and straightforward to integrate with various platforms and tools. In the context of deployments, Ansible ensures consistent and repeatable application rollouts, mitigating many of the risks associated with manual processes. When coupled with real-time monitoring solutions like Datadog, Ansible not only deploys applications but also guarantees they perform optimally post-deployment. This synergy between deployment automation and real-time monitoring underscores a robust, responsive, and resilient deployment ecosystem. The code snippets below show how we can implement Datadog querying in Ansible.
Querying monitors with a tag called 'deployment_priority: blocker' as an example: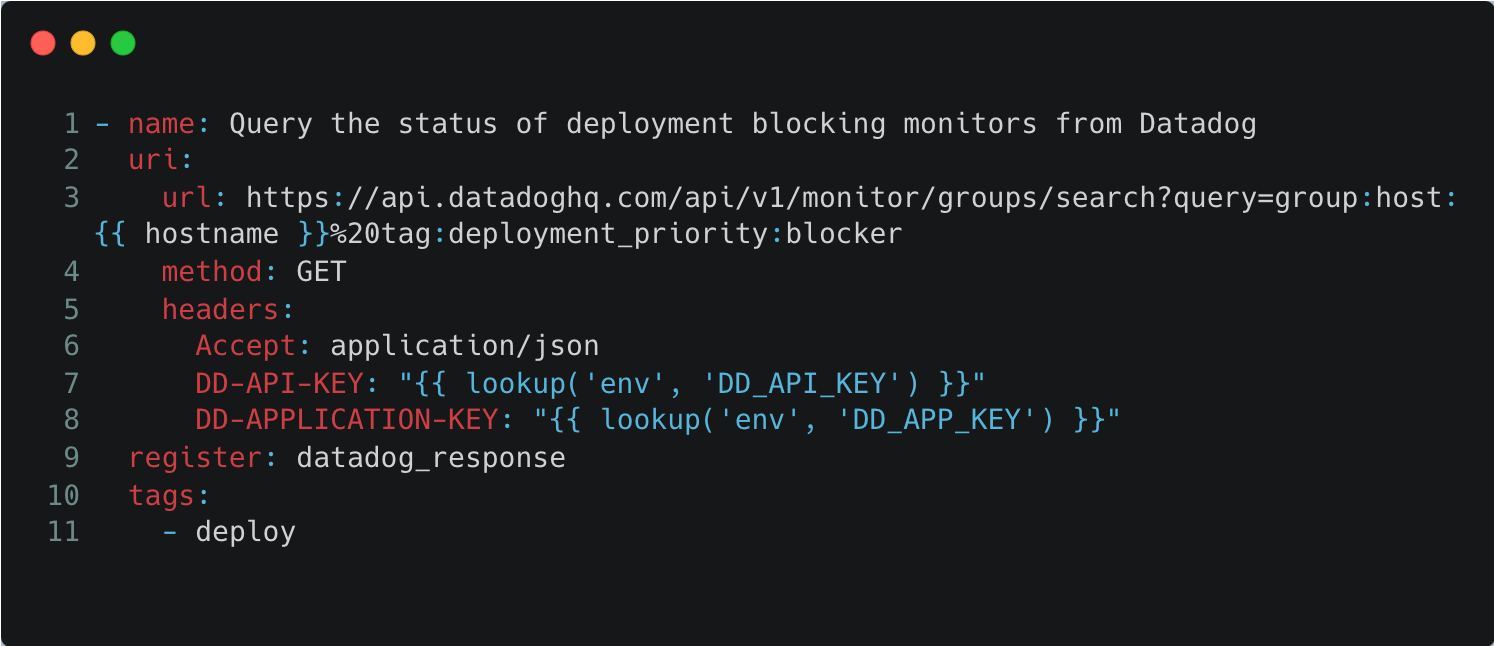
Next, parsing the status of all such monitors returned from Datadog and making a decision whether to abort or continue to the next host or group of deployments.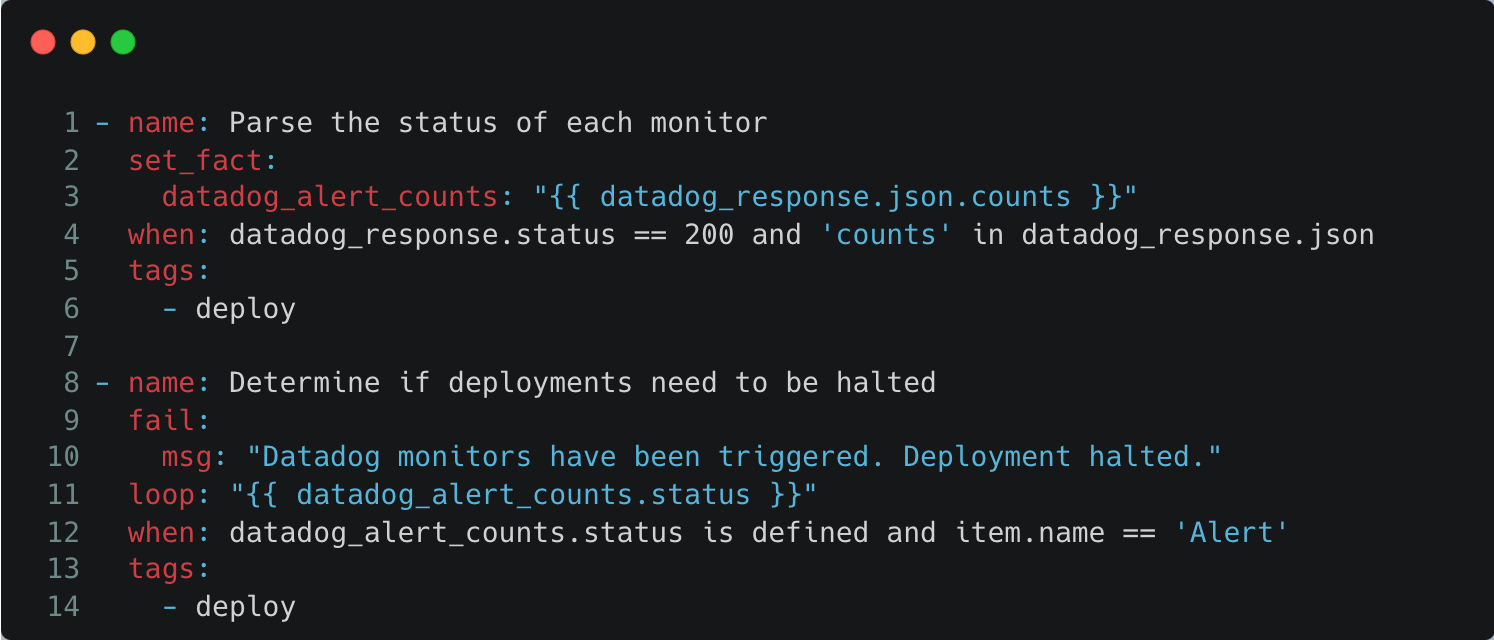
We now have the capability to parse Datadog monitoring information and make informed decisions in our deployment process. This concludes the implementation portion.
Summary
The intersection of deployment automation and real-time monitoring is where modern DevOps truly shines. In this exploration, we've used Ansible as a prime example of the power of deployment tools, emphasizing its capacity to deliver consistent and reliable rollouts. When combined with the granular, real-time insights of a platform like Datadog, we unlock operational efficiency and reliability. As the tech landscape continues to evolve, tools like Ansible and Datadog stand as a testament to the potential of integrated, intelligent DevOps practices. Whether you're a seasoned DevOps professional or just beginning your journey, there's immense value in understanding and employing such synergies for a future-ready and resilient tech ecosystem.
Opinions expressed by DZone contributors are their own.
Comments