Interesting Application Garbage Collection Patterns
The garbage collection pattern helps you instantly detect the health and performance of your application. In this post, I'll share a few interesting patterns with you!
Join the DZone community and get the full member experience.
Join For Free
As the author of GCeasy – Garbage collection logs analysis tool, I get to see a few interesting Garbage Collection Patterns again and again. Based on the Garbage collection pattern, you can detect the health and performance characteristics of the application instantly. In this post, let me share a few interesting Garbage collection patterns that have intrigued me.
1. Healthy Saw-Tooth Pattern
![Fig 1: Healthy saw-tooth GC pattern]()
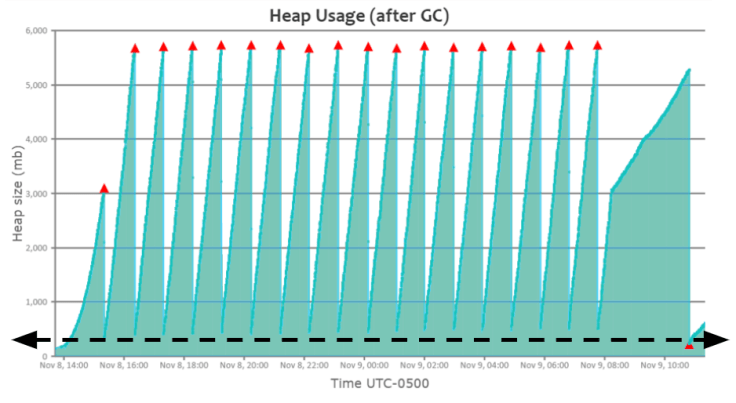
You will see a beautiful saw-tooth GC pattern when an application is healthy, as shown in the above graph. Heap usage will keep rising; once a ‘Full GC’ event is triggered, heap usage will drop all the way to the bottom.
In Fig 1, You can notice that when the heap usage reaches ~5.8GB, the ‘Full GC’ event (red triangle) gets triggered. When the ‘Full GC’ event runs, memory utilization drops all the way to the bottom i.e., ~200MB. Please see the dotted black arrow line in the graph. It indicates that the application is in a healthy state & not suffering from any sort of memory problems.
2. Heavy Caching Pattern
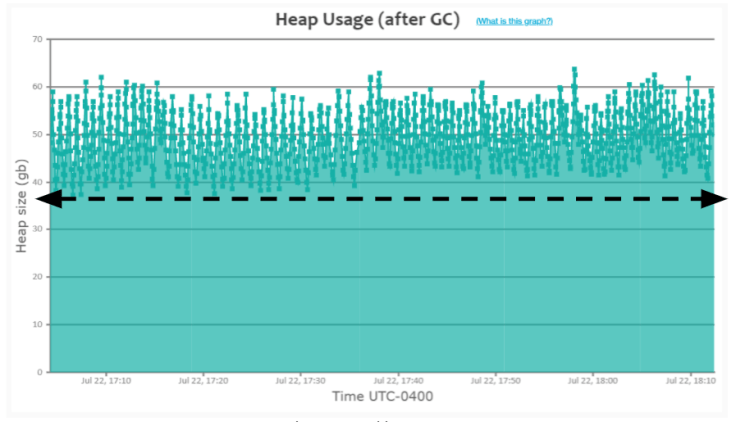
When an application is caching many objects in memory, ‘GC’ events wouldn’t be able to drop the heap usage all the way to the bottom of the graph (like you saw in the earlier ‘Healthy saw-tooth pattern).
In Fig 2, you can notice that heap usage keeps growing. When it reaches around ~60GB, the GC event (depicted as a small green square in the graph) gets triggered. However, these GC events aren’t able to drop the heap usage below ~38GB. Please refer to the dotted black arrow line in the graph. In contrast, in the earlier ‘Healthy saw-tooth pattern’, you can see that heap usage dropping all the way to the bottom ~200MB. When you see this sort of pattern (i.e., heap usage not dropping till all the way to the bottom), it indicates that the application is caching a lot of objects in memory.
When you see this sort of pattern, you may want to investigate your application’s heap using heap dump analysis tools like yCrash, HeapHero, Eclipse MAT and figure out whether you need to cache these many objects in memory. Several times, you might uncover unnecessary objects to be cached in the memory.
Here is the real-world GC log analysis report, which depicts this ‘Heavy caching’ pattern.
3. Acute Memory Leak Pattern
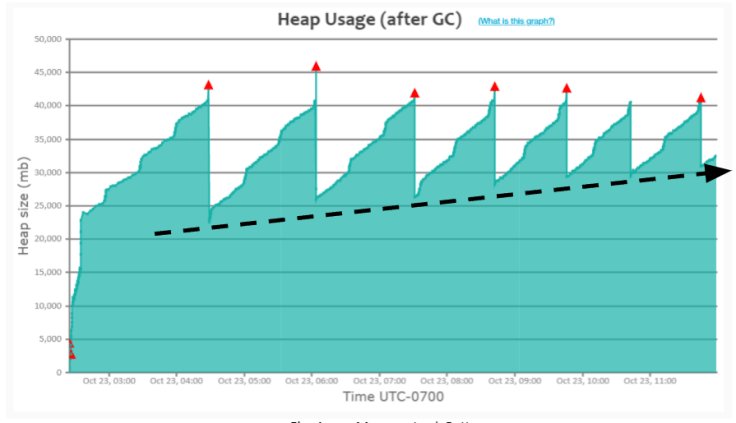
Several applications suffer from this ‘Acute memory leak pattern’. When an application suffers from this pattern, heap usage will climb up slowly, eventually resulting in OutOfMemoryError.
In Fig 3, you can notice that the ‘Full GC’ (red triangle) event gets triggered when heap usage reaches around ~43GB. In the graph, you can also observe that amount of heap that full GC events could recover starts to decline over a period of time, i.e., you can notice that:
a. When the first Full GC event ran, heap usage dropped to 22GB
b. When the second Full GC event ran, heap usage dropped only to 25GB
c. When the third Full GC event ran, heap usage dropped only to 26GB
d. When the final full GC event ran heap usage dropped only to 31GB
Please see the dotted black arrow line in the graph. You can notice the heap usage gradually climbing up. If this application runs for a prolonged period (days/weeks), it will experience OutOfMemoryError (please refer to Section #5 – ‘Memory Leak Pattern’).
Here is the real-world GC log analysis report, which depicts this ‘Acute memory leak’ pattern.
4. Consecutive Full GC pattern
![Fig 4: Consecutive Full GC pattern]()
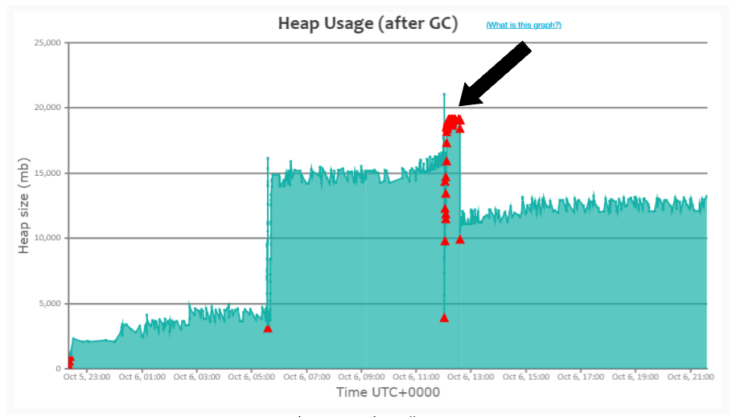
When the application’s traffic volume increases more than JVM can handle, this Consecutive full GC pattern will become pervasive.
In Fig 4, please refer to the black arrow mark in the graph. From 12:02 pm to 12:30 pm on Oct’ 06, Full GCs (i.e., ‘red triangle’) are consecutively running; however, heap usage isn’t dropping during that time frame. It indicates that traffic volume spiked up in the application during that time frame, thus the application started to generate more objects, and Garbage Collection couldn’t keep up with the object creation rate. Thus, GC events started to run consecutively. Please note that when a GC event runs, it has two side effects:
a. CPU consumption will go high (as GC does an enormous amount of computation).
b. Entire application will be paused; no customers will get a response.
Thus, during this time frame, 12:02 pm to 12:30 pm on Oct’ 06, since GC events are consecutively running, the application’s CPU consumption would have been skyrocketing and customers wouldn’t be getting back any response. When this kind of pattern surfaces, you can resolve it using one of the solutions outlined in this post.
Here is the real-world GC log analysis report, which depicts this ‘Consecutive Full GC’ pattern.
5. Memory Leak Pattern
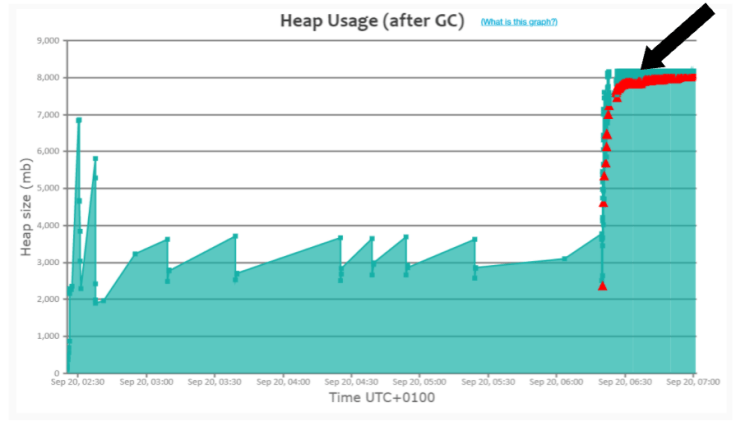
This is a ‘classic pattern’ that you will see whenever the application suffers from memory problems. In Fig 5, please observe the black arrow mark in the graph. You can notice that Full GC (i.e., ‘red triangle’) events are continuously running. This pattern is similar to the previous ‘Consecutive Full GC’ pattern, with one sharp difference. In the ‘Consecutive Full GC’ pattern, the application would recover from repeated Full GC runs and return back to a normal functioning state, once traffic volume dies down. However, if the application runs into a memory leak, it wouldn’t recover, even if traffic dies. The only way to recover the application is to restart the application. If the application is in this state, you can use tools to diagnose memory leaks.
Here is the real-world GC log analysis report, which depicts this ‘Memory Leak’ pattern.
Conclusion
You can also consider enabling your application’s Garbage collection log (as it doesn’t add any measurable overhead to your application) and study the garbage collection behavior. It may reveal insightful views/perspectives about your application that you weren’t aware of before.
Video
Opinions expressed by DZone contributors are their own.
Comments