Java Thread: retained memory analysis
By
 ·
·
Interview
·
·
Interview
Likes
(3)
Likes
There are no likes...yet! 👀
Be the first to like this post!
It looks like you're not logged in.
Sign in to see who liked this post!
Comment
Save
27.8K Views
Join the DZone community and get the full member experience.
Join For Free
This article will provide you with a tutorial allowing you to determine how much and where Java heap space is retained from your active application Java threads. A true case study from an Oracle Weblogic 10.0 production environment will be presented in order for you to better understand the analysis process.
We will also attempt to demonstrate that excessive garbage collection or Java heap space memory footprint problems are often not caused by true memory leaks but instead due to thread execution patterns and high amount of short lived objects.
Background
As you may have seen from my past JVM overview article, Java threads are part of the JVM fundamentals. Your Java heap space memory footprint is driven not only by static and long lived objects but also by short lived objects.
OutOfMemoryError problems are often wrongly assumed to be due to memory leaks. We often overlook faulty thread execution patterns and short lived objects they “retain” on the Java heap until their executions are completed. In this problematic scenario:
- Your “expected” application short lived / stateless objects (XML, JSON data payload etc.) become retained by the threads for too long (thread lock contention, huge data payload, slow response time from remote system etc.)
- Eventually such short lived objects get promoted to the long lived object space e.g. OldGen/tenured space by the garbage collector
- As a side effect, this is causing the OldGen space to fill up rapidly, increasing the Full GC (major collections) frequency
- Depending of the severity of the situation this can lead to excessive GC garbage collection, increased JVM paused time and ultimately OutOfMemoryError: Java heap space
- Your application is now down, you are now puzzled on what is going on
- Finally, you are thinking to either increase the Java heap or look for memory leaks…are you really on the right track?
In the above scenario, you need to look at the thread execution patterns and determine how much memory each of them retain at a given time.
OK I get the picture but what about the thread stack size?
It is very important to avoid any confusion between thread stack size and Java memory retention. The thread stack size is a special memory space used by the JVM to store each method call. When a thread calls method A, it “pushes” the call onto the stack. If method A calls method B, it gets also pushed onto the stack. Once the method execution completes, the call is “popped” off the stack.
The Java objects created as a result of such thread method calls are allocated on the Java heap space. Increasing the thread stack size will definitely not have any effect. Tuning of the thread stack size is normally required when dealing with java.lang.stackoverflowerror or OutOfMemoryError: unable to create new native thread problems.

Case study and problem context
The following analysis is based on a true production problem we investigated recently.
- Severe performance degradation was observed from a Weblogic 10.0 production environment following some changes to the user web interface (using Google Web Toolkit and JSON as data payload)
- Initial analysis did reveal several occurrences of OutOfMemoryError: Java heap space errors along with excessive garbage collection. Java heap dump files were generated automatically (-XX:+HeapDumpOnOutOfMemoryError) following OOM events
- Analysis of the verbose:gc logs did confirm full depletion of the 32-bit HotSpot JVM OldGen space (1 GB capacity)
- Thread dump snapshots were also generated before and during the problem
- The only problem mitigation available at that time was to restart the affected Weblogic server when problem was observed
- A rollback of the changes was eventually performed which did resolve the situation
The team first suspected a memory leak problem from the new code introduced.
Thread dump analysis: looking for suspects…
The first analysis step we did was to perform an analysis of the generated thread dump data. Thread dump will often show you the culprit threads allocating memory on the Java heap. It will also reveal any hogging or stuck thread attempting to send and receive data payload from a remote system.
The first pattern we noticed was a good correlation between OOM events and STUCK threads observed from the Weblogic managed servers (JVM processes). Find below the primary thread pattern found:
<10-Dec-2012 1:27:59 o'clock PM EST> <Error> <BEA-000337>
<[STUCK] ExecuteThread: '22' for queue:
'weblogic.kernel.Default (self-tuning)'
has been busy for "672" seconds working on the request
which is more than the configured time of "600" seconds.

As you can see, the above thread appears to be STUCK or taking very long time to read and receive the JSON response from the remote server. Once we found that pattern, the next step was to correlate this finding with the JVM heap dump analysis and determine how much memory these stuck threads were taking from the Java heap.
Heap dump analysis: retained objects exposed!
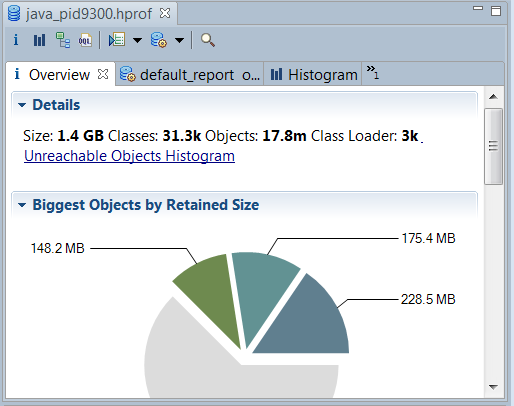
The Java heap dump analysis was performed using MAT. We will now list the different analysis steps which did allow us to pinpoint the retained memory size and source.
1. Load the HotSpot JVM heap dump
2. Select the HISTOGRAM view and filter by “ExecuteThread”
* ExecuteThread is the Java class used by the Weblogic kernel for thread creation & execution *
* ExecuteThread is the Java class used by the Weblogic kernel for thread creation & execution *
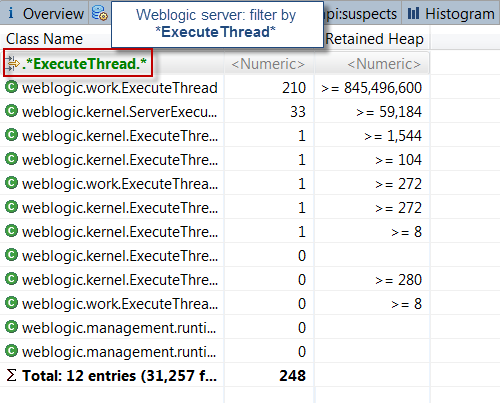
As you can see, this view was quite revealing. We can see a total of 210 Weblogic threads created. The total retained memory footprint from these threads is 806 MB. This is pretty significant for a 32-bit JVM process with 1 GB OldGen space. This view alone is telling us that the core of the problem and memory retention originates from the threads themselves.
3. Deep dive into the thread memory footprint analysis
The next step was to deep dive into the thread memory retention. To do this, simply right click over the ExecuteThread class and select: List objects > with outgoing references.

As you can see, we were able to correlate STUCK threads from the thread dump analysis with high memory retention from the heap dump analysis. The finding was quite surprising.
3. Thread Java Local variables identification
The final analysis step did require us to expand a few thread samples and understand the primary source of memory retention.
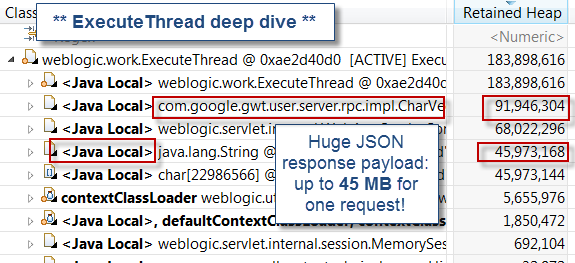
As you can see, this last analysis step did reveal huge JSON response data payload at the root cause. That pattern was also exposed earlier via the thread dump analysis where we found a few threads taking very long time to read & receive the JSON response; a clear symptom of huge data payload footprint.
It is crucial to note that short lived objects created via local method variables will show up in the heap dump analysis. However, some of those will only be visible from their parent threads since they are not referenced by other objects, like in this case. You will also need to analyze the thread stack trace in order to identify the true caller, followed by a code review to confirm the root cause.
Following this finding, our delivery team was able to determine that the recent JSON faulty code changes were generating, under some scenarios, huge JSON data payload up to 45 MB+. Given the fact that this environment is using a 32-bit JVM with only 1 GB of OldGen space, you can understand that only a few threads were enough to trigger severe performance degradation.
This case study is clearly showing the importance of proper capacity planning and Java heap analysis, including the memory retained from your active application & Java EE container threads.
Learning is experience. Everything else is just information
I hope this article has helped you understand how you can pinpoint the Java heap memory footprint retained by your active threads by combining thread dump and heap dump analysis. Now, this article will remain just words if you don’t experiment so I highly recommend that you take some time to learn this analysis process yourself for your application(s).
Please feel free to post any comment or question.
Java (programming language)
Memory (storage engine)
garbage collection
Published at DZone with permission of Pierre - Hugues Charbonneau. See the original article here.
Opinions expressed by DZone contributors are their own.
Comments