jhsdb: A New Tool for JDK 9
Another JDK, another command line tool. Here, we delve into jhsdb, which you can use to launch a postmortem debugger to analyze the data from crashed JVMs.
Join the DZone community and get the full member experience.
Join For FreeI like to use the command-line tools provided with the JDK in the early steps of analyzing performance and other issues with Java-based applications and have blogged on tools such as jcmd, jps, jstat, jinfo, jhat and jmap, jrunscript, jstack, and jdeps. JDK 9 is bringing new command-line tools with multiple tools specifically related to new JDK 9 features such as modularity (jlink and jmod) and enhanced deprecation (jdeprscan). In this post, I focus on a new command-line tool delivered with JDK 9 for dealing with performance and serviceability issues: jhsdb.
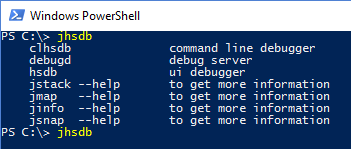
The jhsdb tool is described on its Oracle JDK 9 Documentation Early Access page, "You use the jhsdb tool to attach to a Java process or to launch a postmortem debugger to analyze the content of a core-dump from a crashed Java Virtual Machine (JVM)." The tool comes with several "modes" and several of these modes correspond in name and function with individual command-line tools available in previous JDK distributions. The jhsdb tool not only provides a single tool that encompasses functionality of multiple other tools, but it also provides a single, consistent approach to applying these different functions. For example, the jhsdb command-line syntax for getting help for each of the "modes" is identical.
The jhsdb tool can be attached and applied to a running JVM (including one that is hanging) via its process identifier (PID) similar to how several other tools (including jcmd) work. The jhsdb tool can also be used to analyze core information associated with a crashed JVM if the core file and executable are provided. As an example of the consistency jhsdb provides, all of its mode support the "common options" --pid (to specify target JVM's process ID), --exe (to specify target executable), --core (to specify target core dump file), and --help (to display options specific to each mode).
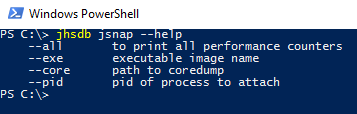
The next series of snapshots demonstrates use of the --help option with the main jhsdb command and with each of several of jhsdb's "modes." One observation that can be made is that the common options --pid, --core, and --exe are offered by all the modes. The obvious inference from this is that the specific functions supported in each mode are those other than those "common" options.
jhsdb "jstack" Mode
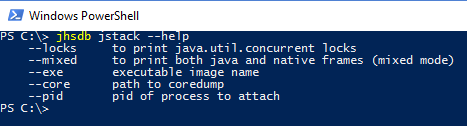
The --help for the jhsdb mode jstack has two specific functionality options: --locks and --mixed. These are demonstrated in the following two screen snapshots.
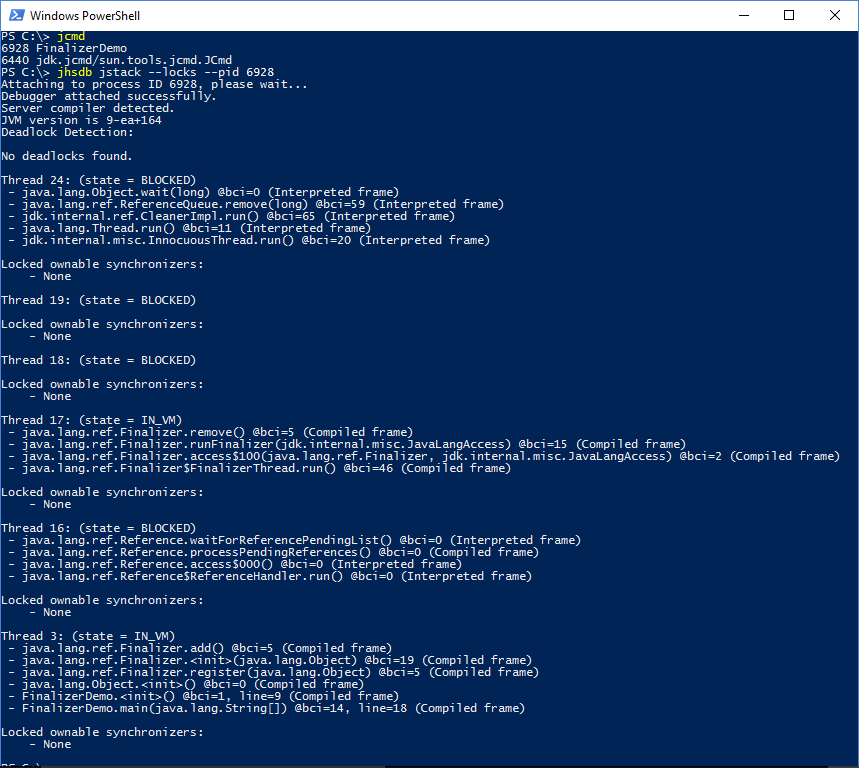
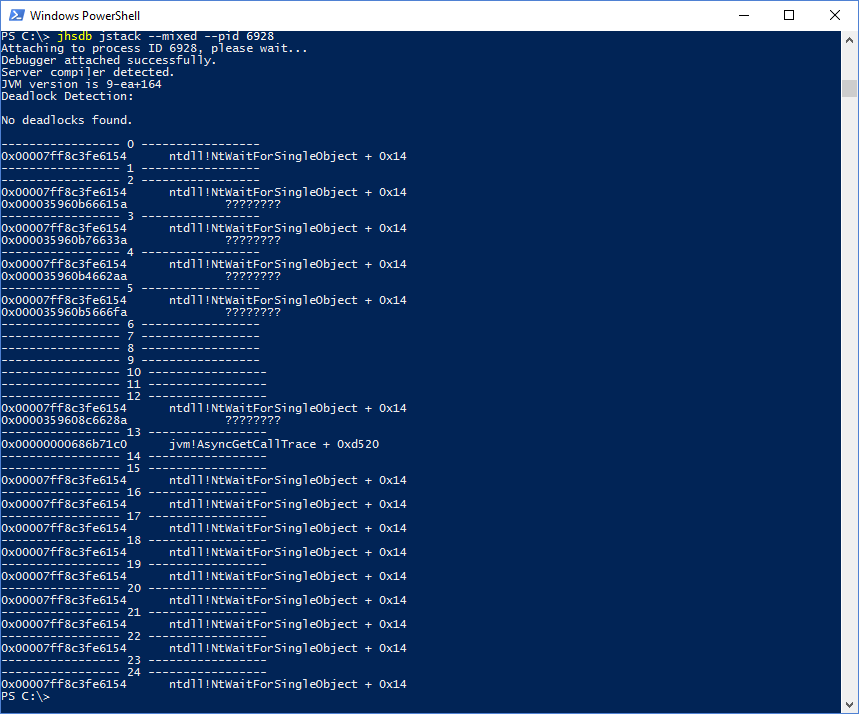
The screen snapshots just shown demonstrate that the jstack mode of the jhsdb tool provides us with deadlock detection details, information on thread locks, and an overview of the native frames and Java frames.
jhsdb "jmap" Mode
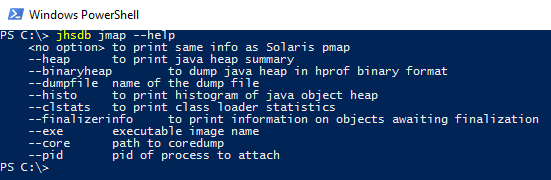
The --help for jhsdb mode jmap shows several functions supported by that mode. When jhsdb jmap is executed with only the --pid or only with the --exe/--core combination, the output is similar to that provided by the Linux pmap command.
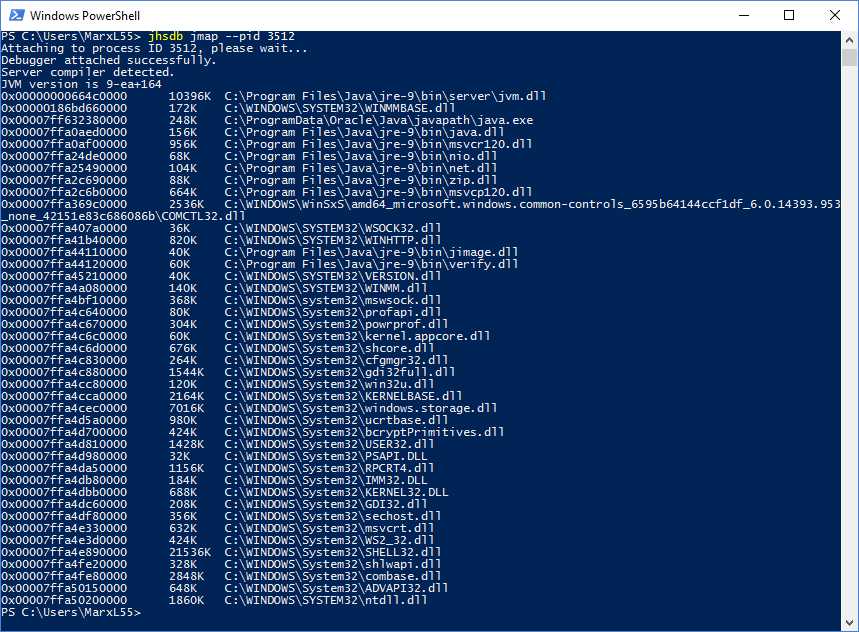
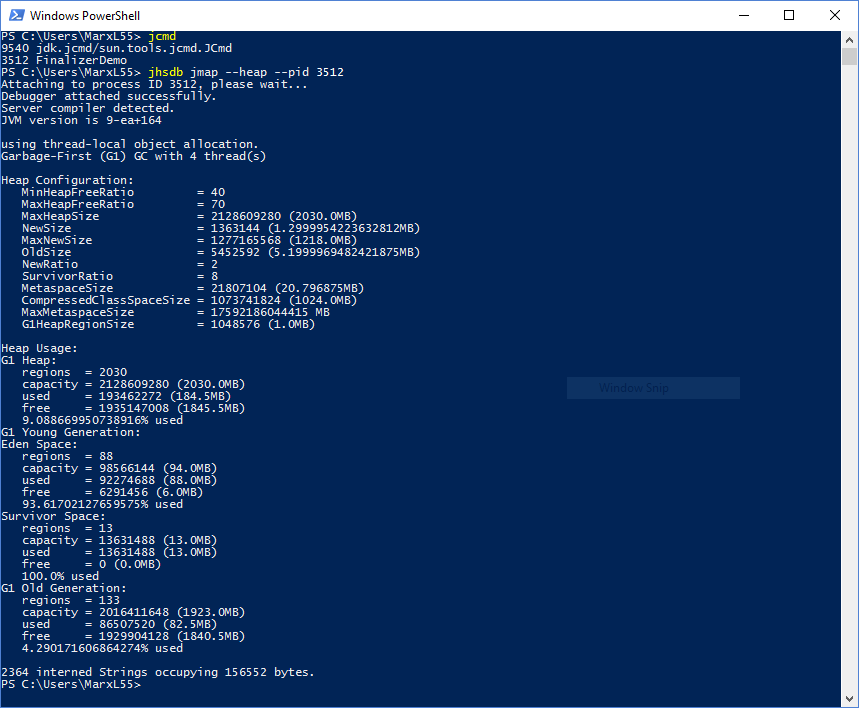
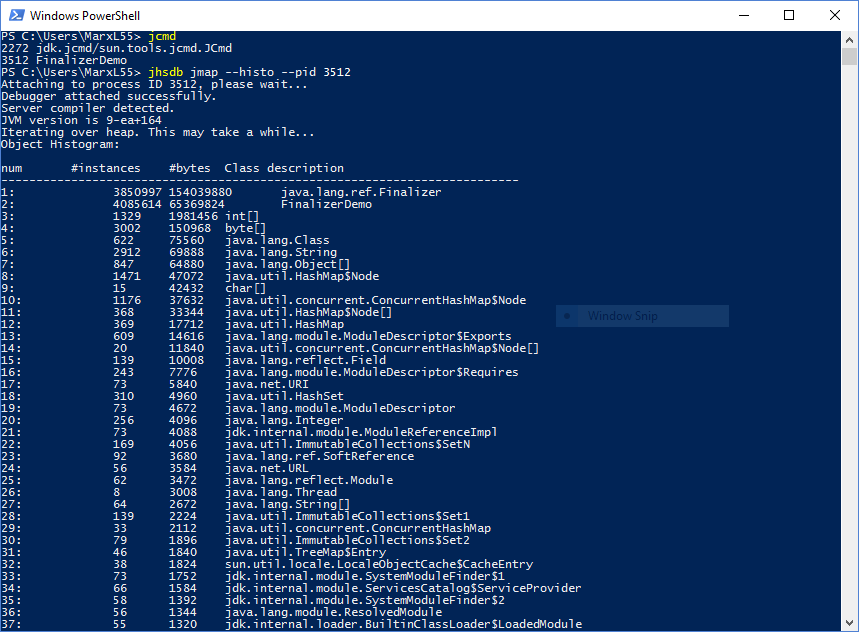
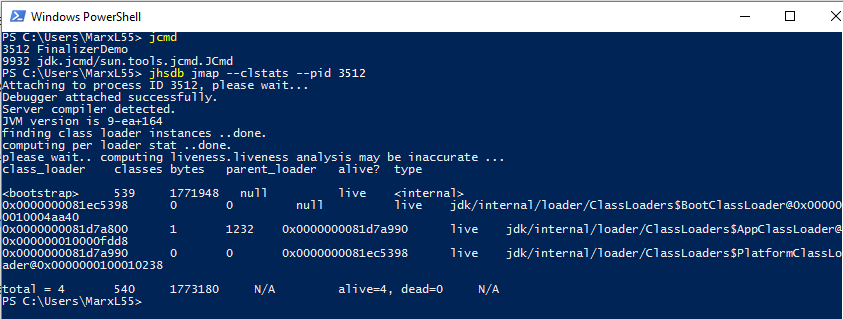
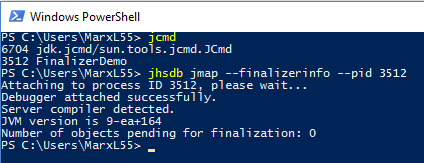
As one would expect, the jmap mode of the jhsdb provides functions similar to those provided by the separate but similarly named jmap command. These include heap dump (--heap), class histogram (--histo), classloader statistics (--clstats), and finalizer information (--finalizerinfo) and are demonstrated in the following four screen snapshots.
jhsdb "jinfo" Mode
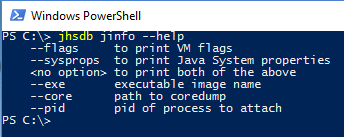
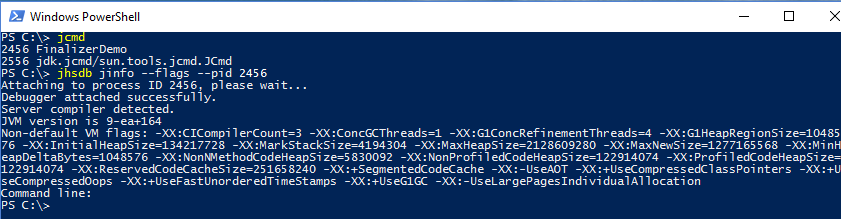
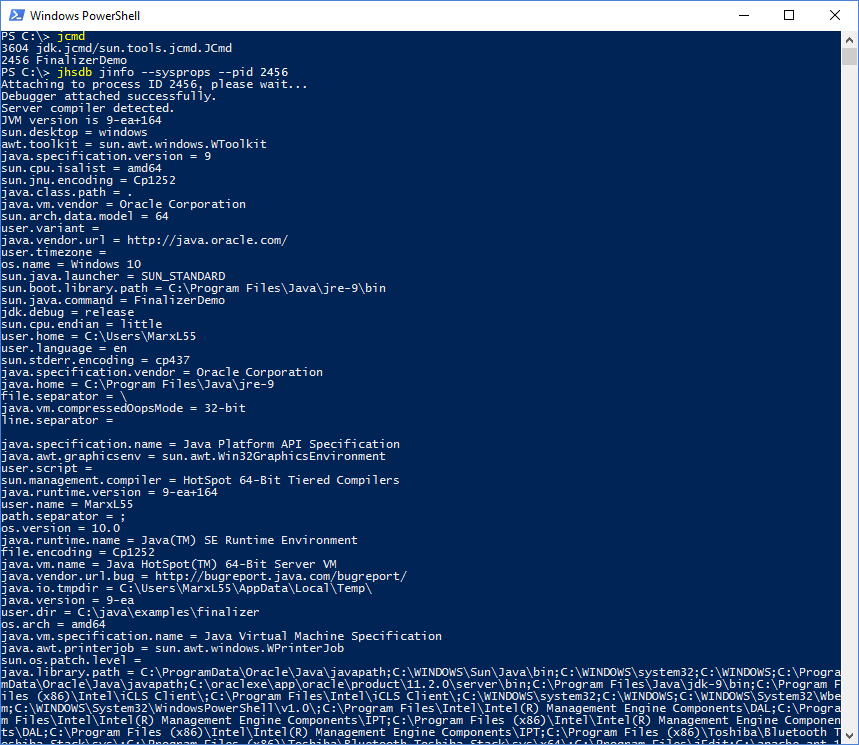
Not surprisingly, the jinfo mode of the jhsdb command provides functionality that overlaps with that provided by the jinfo command. Specifically, the jhsdb's jinfo mode allows one to see the targeted JVM's flags and system properties.
There are three main options used with jhsdb jinfo: --flags to see JVM flags, --sysprops to see the system properties, or no argument to see both the flags and the system properties. The next two screen snapshots demonstrate use of jhsdb jinfo --flags and jhsdb jinfo --sysprops. Running jhsdb jinfo without any arguments shows the system properties first followed by the flags, but is not shown here.
jhsdb "jsnap" Mode
The jhsdb mode jsnap provides access to information previously provided by the internal class sun.jvm.hotspot.tools.JSnap which was previously available in lib/sa-jdi.jar and which has been added to jhdsdb for JDK 9. There are two options for output from jhsdb jsnap based on whether no mode-specific argument is provided or if the --all mode-specific argument is provided. The next two screen snapshots demonstrate these two options.
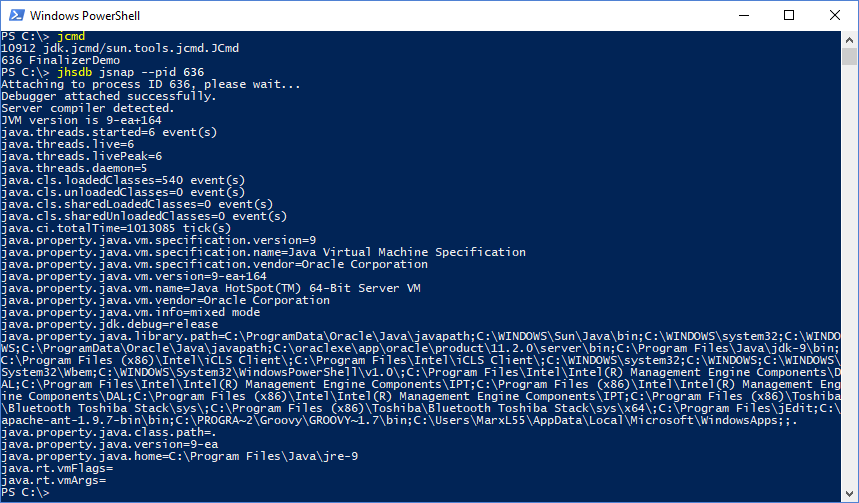
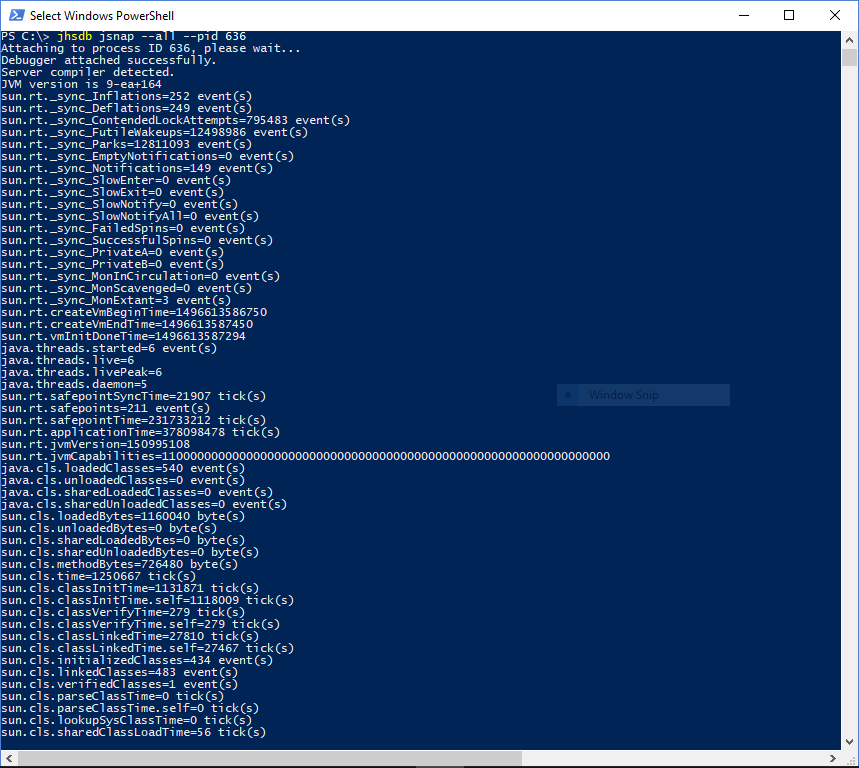
These screenshots demonstrate that jhsdb jsnap with no mode-specific option lists information such as events related to threads and class loading/unloading along with core JVM properties. Adding the --all option lists these same properties, but in addition adds far more properties and, according to the documentation, "Prints all performance counters."
By the way, Marcus Hirt's Using the JVM Performance Counters provides an interesting look at how to apply JMX and custom MBeans to achieve a tool "similar to the PerformanceCounters MBean available in JRockit." I believe that jhsdb jsnap --all brings simple ability to see the same type of information in HotSpot as Hirt talked about being available in JRockit with jrcmd -l.
jhsdb Debug Modes
The three jhsdb modes hsdb (graphical user interface for interactive debugging), clhsdb (command-line interface for interactive debugging), and debugd (remote debug server) are related to debug operations. I may take a closer look at these modes in a future post, but for now I simply show some screen snapshots that demonstrate the graphical interaction using jhsdb hsdb. The GUI was started with jhsdb hsdb --pid <pid> and most of the options displayed here were run by selecting the specific menu option under "Tools".
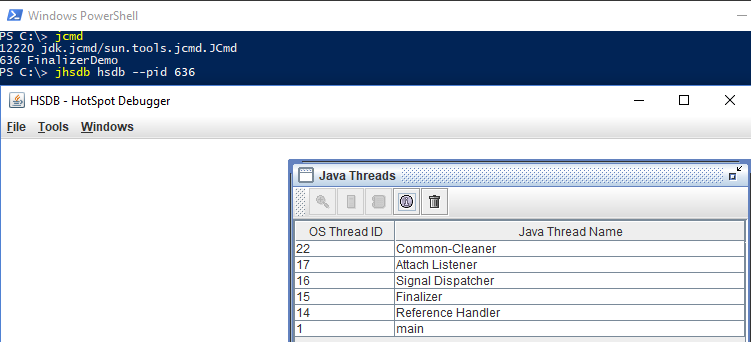
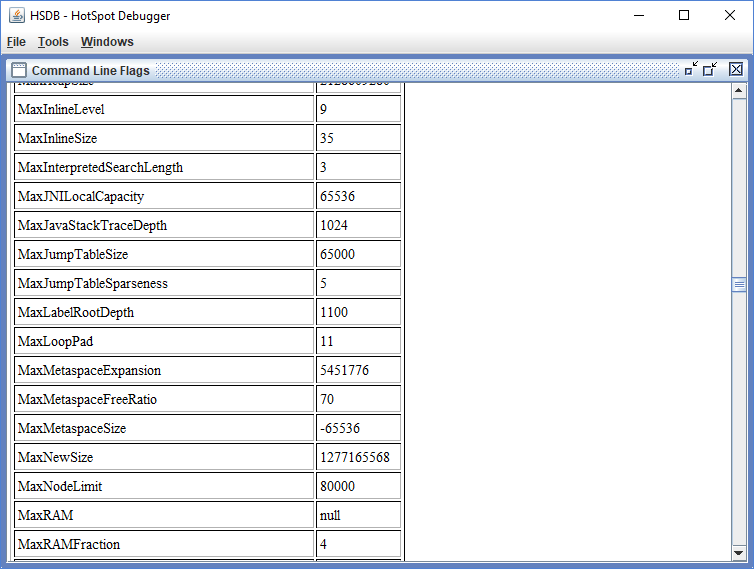
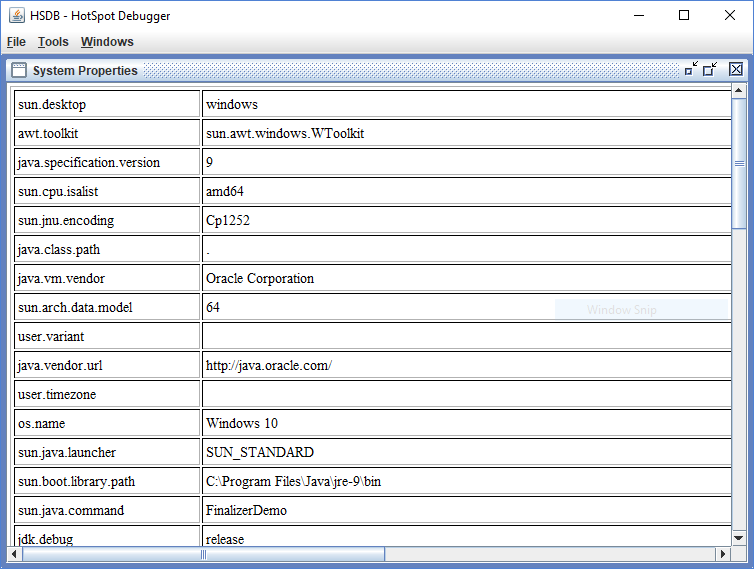
As can be seen in the article HotSpot's Hidden Treasure, the serviceability debugger GUI has been available before JDK 9 and jhsdb, but this article also shows how much more difficult it was to find and start this tool before JDK 9's introduction of jhsdb.
Relationship of jhsdb to jcmd and to Other Command-Line JDK Tools
I summarized the relationship of general-purpose tool jcmd to other JDK-provided command-line tools in the blog post jcmd: One JDK Command-Line Tool to Rule Them All. I adapt that table here to add jhsdb to the mix.
| Functionality | jhsdb | jcmd | Similar Tool |
|---|---|---|---|
| Listing Java Processes | N/A1 | jcmd |
jps -lm |
| Heap Dumps | jhsdb jmap --binaryheap |
jcmd <pid> GC.heap_dump |
jmap -dump <pid> |
| Heap Usage Histogram | jhsdb jmap --histo |
jcmd <pid> GC.class_histogram |
jmap -histo <pid> |
| Thread Dump | jhsdb jstack --locks(subset of locked thread frames) |
jcmd <pid> Thread.print |
jstack <pid> |
| List System Properties | jhsdb jinfo --sysprops |
jcmd <pid> VM.system_properties |
jinfo -sysprops <pid> |
| List VM Flags | jhsdb jinfo --flags |
jcmd <pid> VM.flags |
jinfo -flags <pid> |
1 You use jcmd or jps -lm to identify PID upon which to have jhsdb, jcmd, and many other tools act if working against a running JVM. I used jcmd in this post to identify the PID, but the current jhsdb documentation demonstrates using jps to acquire the JVM PID.
The jhsdb tool is a mostly command-line tool that does also have an optional interactive GUI available that supports reporting of many of the commonly desired attributes of a JVM that is hung or has crashed. It provides a consistent interface across its modes and the command-line interaction allows for interactive help requests such that very little syntax must be known or remembered before applying the tool. If one can remember "jhsdb", one can start using the tool effectively. The jhsdb tool is new to JDK 9, but brings functionality into one tool that was previously available from several different tools.
Published at DZone with permission of Dustin Marx. See the original article here.
Opinions expressed by DZone contributors are their own.
Comments