JVM Memory Architecture and GC Algorithm Basics
Overview of JVM memory management (Heap, Stack and MetaSpace) and different Garbage Collection Algorithms
Join the DZone community and get the full member experience.
Join For FreePurpose
This article discusses the basic concept of JDK8 and upwards memory management with heap and stack memory. and the basics of GC and its Algorithms.
Importance of Memory Management
Java garbage collector doesn't ensure that the heap memory will be completely free, and also, for a developer, it is not possible to force a garbage collector to run at a specific time. So it is helpful to know how memory management in Java works.
Understanding memory management helps with writing an optimized memory efficient code and helps to avoid any memory-related issues in the program, which can cause application slowness and help to avoid errors like StackOverFlowError and OutOfMemoryError.
Stack Memory
Stack is a linear data structure and is a static memory allocation by Java to store heap object references and also stores Java primitive type values. Stack accesses the memory in a last in, first out (LIFO) order and stack is faster than heap memory.
Each thread creates its own stack in the memory, which in turn makes the stack memory thread safe.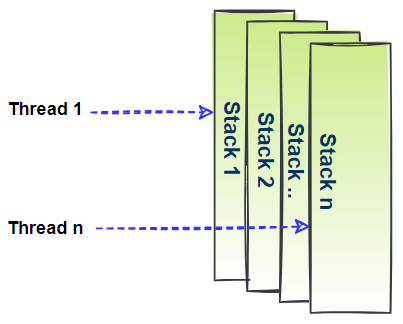
A method in Java only accesses the objects from the stack memory which are within the method body (within the method scope). When the method execution is complete, the corresponding block to this method gets cleared from the stack.
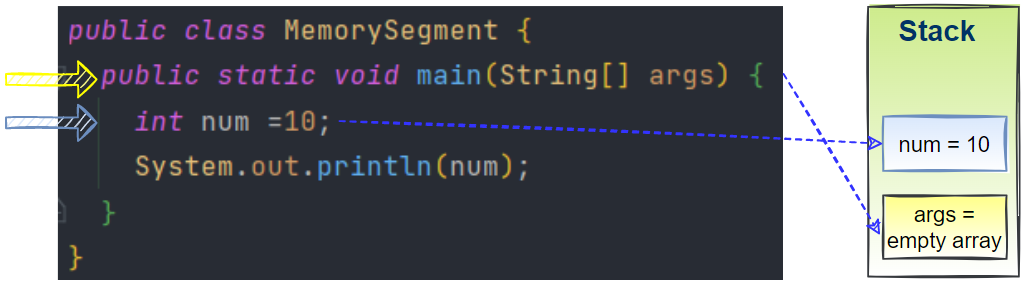
In the above program, we can see that when the control reaches to the main method, there will be an entry of the args in the stack. And then when the control is in the next line, a new entry is added to the stack.
When the control is out of the scope of the method, the reference gets deleted from the stack.
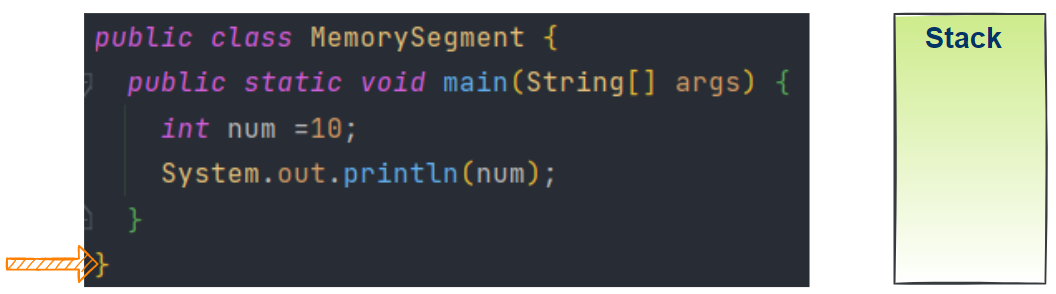
In case the stack memory gets full, JVM throws a StackOverFlowError.
Heap Memory
Heap is used for dynamic memory allocation by JVM for Java objects at runtime. Any new object gets stored in heap and the reference(example variables) of the object is stored on the stack. You can see in the example below how the variables for the sample code are stored in the heap and stack.
int age = 5;
String name = "Sherine";
List<String> subjectLst = new ArrayList<String>();
subjectLst.add("English");
subjectLst.add("Science");
List<String> finalLst;
finalLst = subjectLst;
Below is the memory allocation in the heap for the above code snippet.

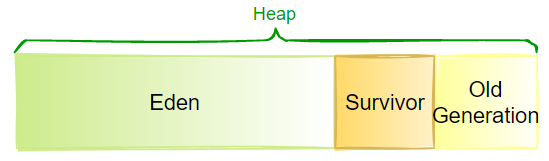
Heap memory can be broken down into smaller parts called generations, which are young, old/tenured, and permanent generations.
Young Generation
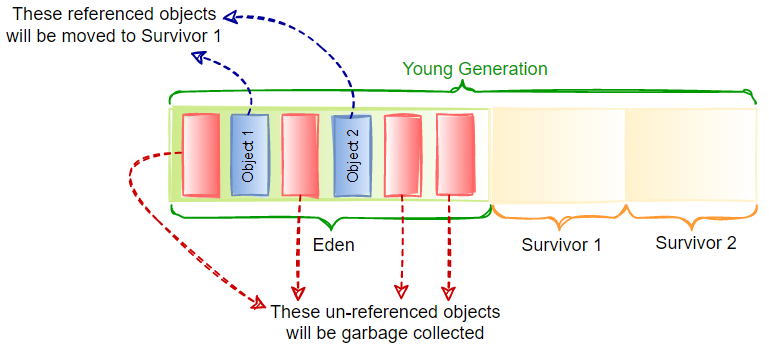
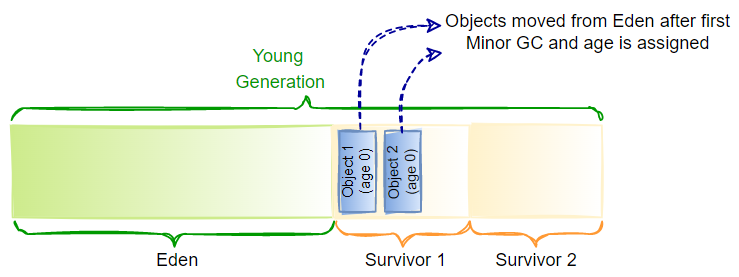
All new objects get allocated in this memory segment. The young generation consists of Eden and two Survivor spaces. When Eden fills up, the garbage collection happens on the young generation and that is called Minor GC. Referenced objects from the young generation are moved to Survivor space #1 during Minor GC and the age of the object gets incremented.
For example in the image below "Object 1" and "Object 2" will move to Survivor space #1 after the first Minor GC and they will have an assigned age. If the "Object 1" survives first Minor GC, then the age is zero. Now if the "Object 1" survives next Minor GC also, then it will be moved to Survivor space 2 and the age will be incremented again.
During the second Minor GC, objects (which have a reference) residing in Survivor space #1 will be moved to Survivor #2, and the age will be incremented (i.e. the age will become from zero to one as per the example). And all the un-referenced objects from full Young Generation space will be deleted.
The size of the young generation can be contolled by NewRatio. If we set -XX:NewRatio=4 then it means that the young and old/tenured genartion ration will be 1:4 and the combined space of Eden and Survivor space will 1/5th of the total heap size. You can also set the young generation size by using NewSize and MaxNewSize JVM option.
Old Generation
The old generation is the place where the long-lived objects (most aged objects) are stored. Young generation objects have an upper limit or threshold for age. Once an object reaches that upper limit, then the object is moved to old or tenured generation.
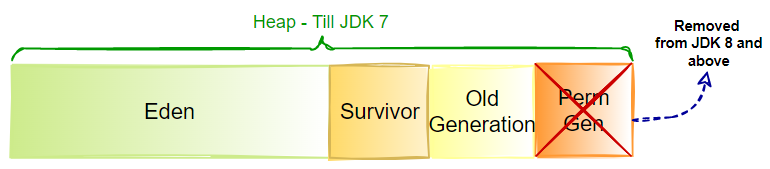
Permanent Gen
This part of heap memory is used to store metadata for runtime classes and methods. This part of the memory has been removed completely from JDK 8 onwards by Java and replaced by Metaspace concept. You can still set the --XX:PermSize and -XX:MaxPermSize configuration. But you will get a warning during runtime if you run the application on JDK 8 or a higher version.
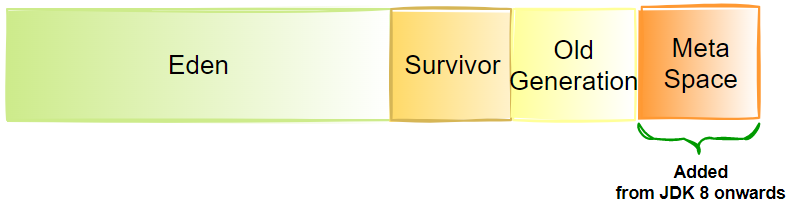
Metaspace
This was introduced from JDK 8 version onwards, and it is a resizable memory area and allocated out of native memory. Metaspace holds the class metadata and it is not a contiguous memory location.
Whenever Metaspace reaches its maximum size allocated for the Metaspace, Java triggers automatic GC to free up Metaspace memory.
Metaspace options are -XX:MetaspaceSize=size and -XX:MaxMetaspaceSize=size
Garbage Collection
The Java program compiles and changes into byte code and runs on a JVM (Java Virtual Machine). Objects of a Java program get created on the dedicated heap memory for that program. Over time, more objects get created and some of the objects (un-referenced and de-scoped) are no longer needed by the program. Garbage collection is the process of Java that performs automatic memory management and frees up memory space by removing the un-referenced objects.
JVM incorporates different algorithms for garbage collection. The garbage collection algorithm checks for each referenced object in memory and the rest of the objects are considered to be garbage collected.
Types of GC Algorithm
Below are the 4 types of GC algorithm availble for JVM.
- Parallel GC
- Serial GC
- Concurrent Mark and Seep
- G1 Garbage First
Parallel GC
Designed for muti-threaded applications with medium or huge amount of data and works nicely in multiprocessor environment. But it freeze all the application thread during garbage collection. JVM option for this is -XX:+UseParallelGC and there is option for you to set number of parallel threads by using -XX:ParallelGCThreads=<NoOfThreads> .
Serial GC
Designed mainly to be used for single-threaded environments. Liek Parallel GC, it also freeze all the application thread during garbage collection. JVM option for this is -XX:+UseSerialGC.
Concurrent Mark and Seep(CMS)
This is a concurrent GC and is designed for shorter GC pause time and doesn't need to stop the running application to perform GC. That is the reason, why this process is slower compared to Serial or Parallel GC. It uses multi threading for garbage collection and can afford to share processor resources with the garbage collector. JVM option for this is -XX:+UseConcMarkSweepGC
G1 Garbage Collctor(G1GC)
This is another most efficient concurrent GC and designed for multiprocessor environment with larger amount of memory. JVM option for this is -XX:+UseG1GC
Parameters to Select a GC Algorithm
Until and unless you have some specific requirement on GC timing and need to put other specification, its always better to allow JVM to select the GC Algorithm by its own.
If you want to select and configure GC algorithms, then few parameters which need to be cosidered like Heap Size, No of CPU Core, Application Data Set Volume, Throughput, Pause time, Latency.
- Heap Size - The total amount of memory allocated to JVM. Bigger heap size means GC will take more time.Also bigger heap memory means triggering GC by JVM will not be so frequent compared to less heap memory. JVM Options for this is
-Xms=<n>and-Xmx=<n>where -Xms denotes minimum and -Xmx is the maximum. - CPU Core - GC Algorithm varies depending on number of CPU core. Some of them designed for Single core CPU and some designed for Multi-core CPU.
- Application Data Set - This refers to the number of obejcts the application uses. Creation of more number of new objects, results in filling up the young generation space and more GC time will be needed to free up memory.
- Throughput - It is the percentage of total time(out side GC) which is needed to complete application tasks. It is inversely proportional to the memory allocated for JVM.
- Pause time - Time taken by GC algorithm to stop the application during memory reclaim. It varies based on different GC algotihm. JVM Option for this is
-XX:MaxGCPauseMillis=<N> - Latency - It is the response time ofthe application and directly depends on the GC Pause time.
Depending on the above parameters, you have to choose which GC algorithm is best suit for your application. For example,
- Serial GC if the application is small and uses smaller dataset and runs on single processor with no pause-time requirement.
- Parallel GC if the applcation performance is the highest priority.
- G1GC or CMS when response time of the application matter as it will not hold application while running GC.
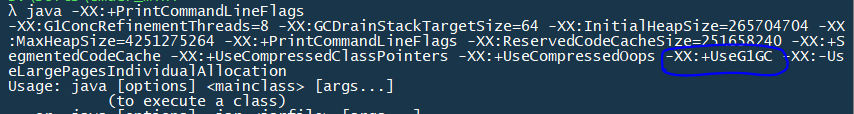
One way to check what is the default GC which JVM will select based on your Hardware configuration is to use -XX:+PrintCommandLineFlags option. Open your command line option and run java -XX:+PrintCommandLineFlags command.
The above PrintCommandLineFlags command show you the default GC selected by JVM based on your Hardware Configuration where you are running the command.
Opinions expressed by DZone contributors are their own.
Comments