Use Machine Learning to Observe API Metrics
Modern observability should have telemetry data stored in a single platform to apply correlation and causation. Here's how to observe with Elastic and Kuma.
Join the DZone community and get the full member experience.
Join For FreeThis blog was co-created by Ricardo Ferreira (Elastic) and Viktor Gamov (Kong).
We love our microservices, but without a proper observability (O11y) strategy, they can quickly become cold, dark places cluttered with broken or unknown features. O11y is one of those technologies deemed created by causation: the only reason it exists is that other technologies pushed for it. There wouldn't be a need for O11y if, for example, our technologies haven't gotten so complex across the years.

Suppose your microservices have turned into this dark, scary place. In that case, finding the root cause of specific problems across several microservices might cause you to get as frustrated as the character Charlie Kelly from It's Always Sunny in Philadelphia.
It’s difficult to pinpoint the root cause of issues when you have to scatter the issue over different machines, VMs, and containers and look through code written in other programming languages.
Monitoring Systems: Past and Present
Twenty years ago, we had a very singular approach to monitoring. Web applications consisted of a cluster of HTTP servers, where we could easily SSH them and look at the logs to search for problems. Now, we live in an era with highly distributed systems where the number of servers that build up our clusters is unknown from the top of our heads.
This is like the pet-versus-cattle analogy. It’s one thing to deal with many pets you know by name and understand their behaviors. You know what to expect from them. But coping with cattle is different. You don't know their names because they might pop up every second, and you don't know their behavior. It is like you are traveling in unknown territory with each of them.
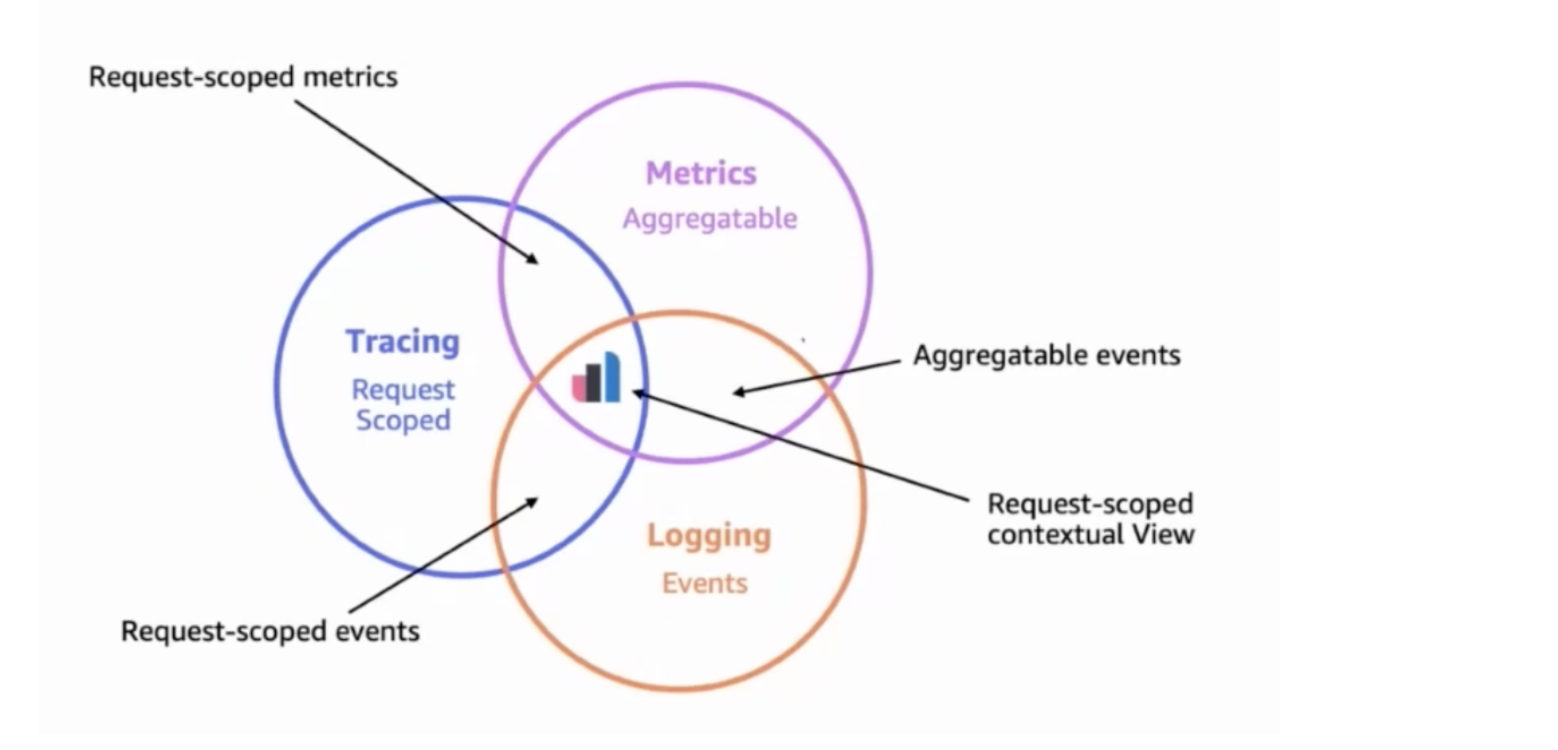
The most important aspect of a modern O11y strategy is having all this data, known as telemetry data, stored and consolidated into one single platform capable of harnessing their power by applying correlation and causation. Instead of treating each telemetry data as a pillar as most people do—you have to treat them as pipes that ingest data into a place that will make sense out of them. Elastic Observability is one of the platforms capable of this.
Elastic Observability and Kuma Service Mesh
This blog post will dive into the specific tasks you have to implement to have data from Kuma sent to Elastic Observability to enable the machine learning features to analyze them. This will allow you to accomplish two different objectives.
First, it allows you to eliminate the chaos created by other monitoring systems. By default, Kuma sends metrics to Prometheus/Grafana, traces to Jaeger, and logs to Logstash. You can replace all this with Elastic Observability. This simplifies the architecture, reduces the amount of plumbing, and reduces the operational footprint required to maintain Kuma.
After that, once all this data is sitting on Elastic Observability, users can use its built-in dashboards and applications to analyze data any time they want. But they can also leverage the platform's support for machine learning to deploy jobs that can do this work of continuously crushing the numbers for them to focus on the connectivity aspects of Kuma.
If you prefer video, watch the full recording of this Kong Summit 2021 session here.
Enabling Observability on Kuma
When we enable the Kuma service mesh code in our cluster, we’ll be able to do multiple things related to observability.
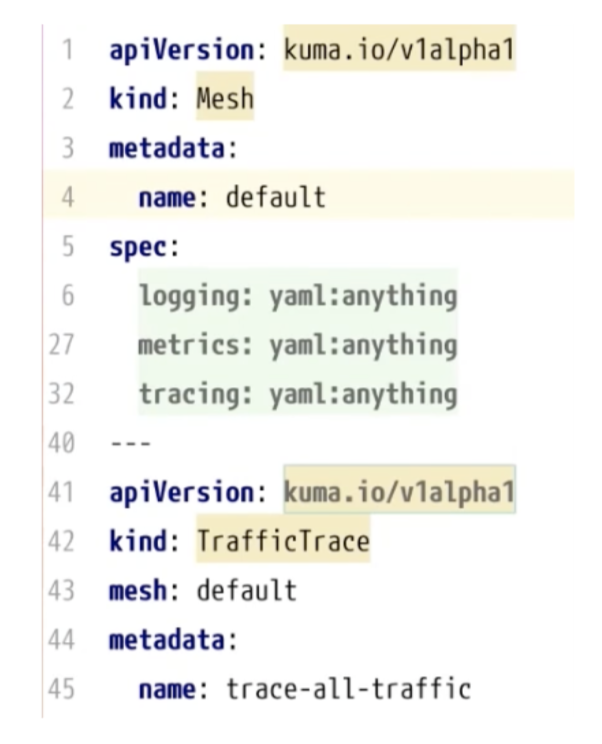
apiVersion: kuma.io/v1alpha1
kind: Mesh
metadata:
  name: default
spec:
  logging:
    # TrafficLog policies may leave the `backend` field undefined.
    # In that case the logs will be forwarded into the `defaultBackend` of that Mesh.
    defaultBackend: file
    # List of logging backends that can be referred to by name
    # from TrafficLog policies of that Mesh.
    backends:
      - name: logstash
        # Use `format` field to adjust the access log format to your use case.
        format: '{"start_time": "%START_TIME%", "source": "%KUMA_SOURCE_SERVICE%", "destination": "%KUMA_DESTINATION_SERVICE%", "source_address": "%KUMA_SOURCE_ADDRESS_WITHOUT_PORT%", "destination_address": "%UPSTREAM_HOST%", "duration_millis": "%DURATION%", "bytes_received": "%BYTES_RECEIVED%", "bytes_sent": "%BYTES_SENT%"}'
        type: tcp
        # Use `config` field to co configure a TCP logging backend.
        conf:
          # Address of a log collector.
          address: 127.0.0.1:5000
      - name: file
        type: file
        # Use `file` field to configure a file-based logging backend.
        conf:
          path: /tmp/access.log
        # When `format` field is omitted, the default access log format will be used.
This configuration prepares the logs to be sent to a TCP endpoint running on localhost over port 5000. So we can use Elastic Stack to spin up a Logstash instance(s) that exposes the same endpoint. Logstash, in turn, would be responsible for ingesting those logs into Elastic Observability.
Loading Metrics Into Elastic Observability
When it comes to moving metrics from Kuma to Elastic, Kuma is like In-N-Out Burger—there are multiple options to choose from.
Elastic Metricbeat
The first option is Elastic Metricbeat, which periodically scrapes the Prometheus endpoint that Kuma has enabled. Then, Metricbeat can read the data and store it in Elastic. It stores and formats the data into an ECS format that will enable data analysis.

We could apply Metricbeat on bare-metal, Kubernetes and Docker. We can quickly spin up an instance with the below code.
etricbeat.config.modules:
 path: ${path.config}/modules.d/*.yml

modules:
- module: prometheus
 period: 10s
 metricsets: ["collector"]
 hosts: ["localhost:9090"]
 metrics_path: /metrics

setup.template.settings:
 index.number_of_shards: 1
 index.codec: best_compression

output.elasticsearch:
 hosts: ["https://cloud.elastic.co:443"]

processors:
 - add_host_metadata: ~
 - add_cloud_metadata: ~
 - add_docker_metadata: ~
 - add_kubernetes_metadata: ~
Metricbeat also provides options for handling the load and avoiding scraping completely. Instead, we can have Kuma send the metrics to an endpoint exposed by Metricbeat, which leverages a feature from Prometheus called remote_write. This option presents an exciting technique to scale because it is easier and faster to scale up the metric collection layer instead of Kuma.
OpenTelemetry Collector
Another option is the collector from the OpenTelemetry project, which does the same thing as Metricbeat, scraping the Prometheus endpoint exposed by Kuma. The only difference is that OpenTelemetry will send this data to Elastic in the OTLP format, the native protocol of OpenTelemetry. Once Elastic Observability receives the data over the OTLP format, it will then convert to ECS natively. This is only possible since Elastic Observability supports OpenTelemetry natively.
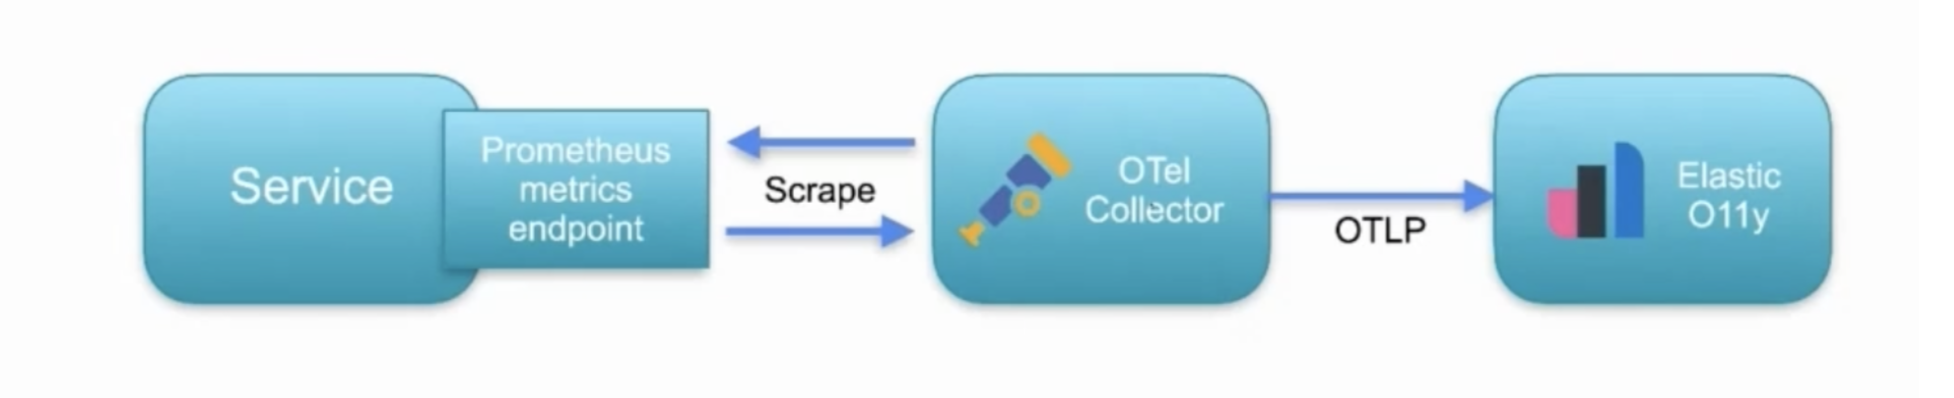
Like Metricbeat, OpenTelemetry can be deployed as a sidecar, whether on Kubernetes, Docker or bare metal. We can tune in many options to keep up with the load, so it's highly configurable. It’s a great option for those who want to stick with an open standard.
receivers:
 prometheus:
   config:
     scrape_configs:
       - job_name: "prometheus"
         scrape_interval: 15s
         static_configs:
           - targets: ["0.0.0.0:9100"]
exporters:
 otlp:
   endpoint: "https://cloud.elastic.co:443"
   headers:
     "Authorization": "Bearer <BEARER_TOKEN>"

service:
 extensions: [health_check]
 pipelines:
   metrics:
     receivers: [prometheus]
     processors: [batch]
     exporters: [otlp]
It is essential to know that OpenTelemetry does not yet support the remove_write feature, so if we’re looking for a solution that allows us to push metrics to Elastic Observability and handles the load as well, Metricbeat is a far better option. This might change in the future since the OpenTelemetry project is rapidly evolving and catching up with the observability space.
Enabling Machine Learning in Elastic Observability
How can we leverage machine learning features in Elastic for Kuma service mesh?
Step 1: Enabling Machine Learning (ML)
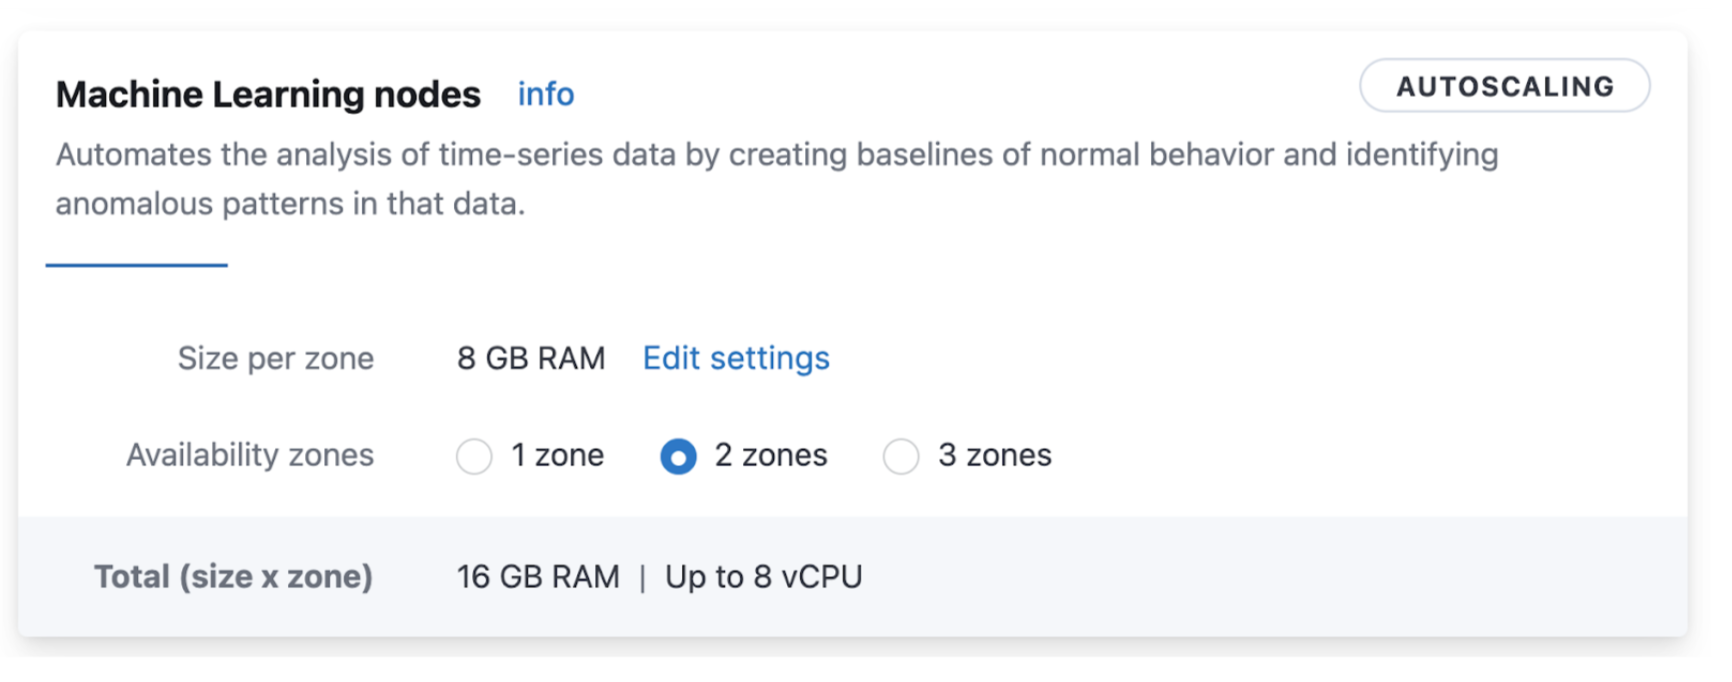
The first step is to enable ML in our Elasticsearch cluster. The Elastic Observability data store is Elasticsearch, which supports ML natively. We can enable the ML features by setting this in the configuration file of each Elasticsearch node. It is also essential to size our nodes to handle ML workloads, which tend to be very CPU- and memory-bound. Alternatively, we can enable the autoscaling feature using Elastic Observability via Elastic Cloud. This enables the cluster to grow and shrink dynamically as our load demands change.
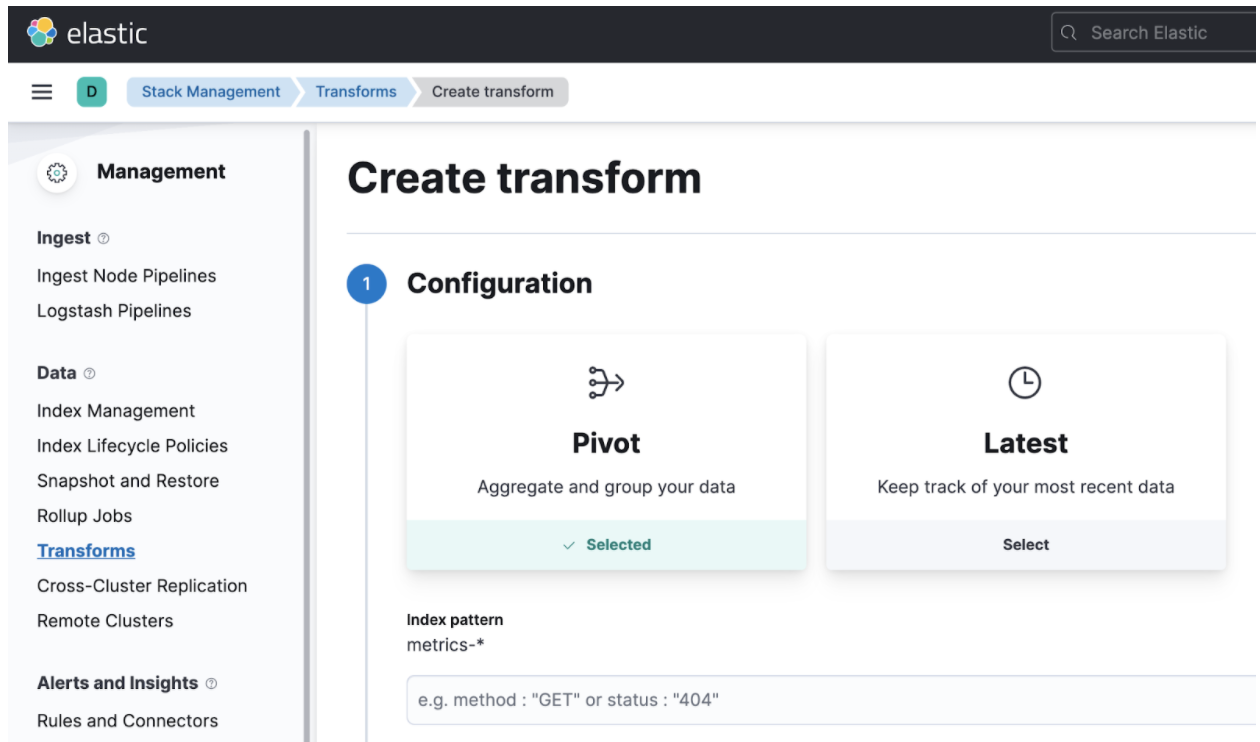
Step 2: Possible Data Normalization
We might want to incur data normalization, as the observability data coming from Kuma in Prometheus form might not be enough for our ML analysis. In the Elastic world, we can do this data massaging using Transforms. We can use transforms to build entity-centric indices that better represent our dataset.
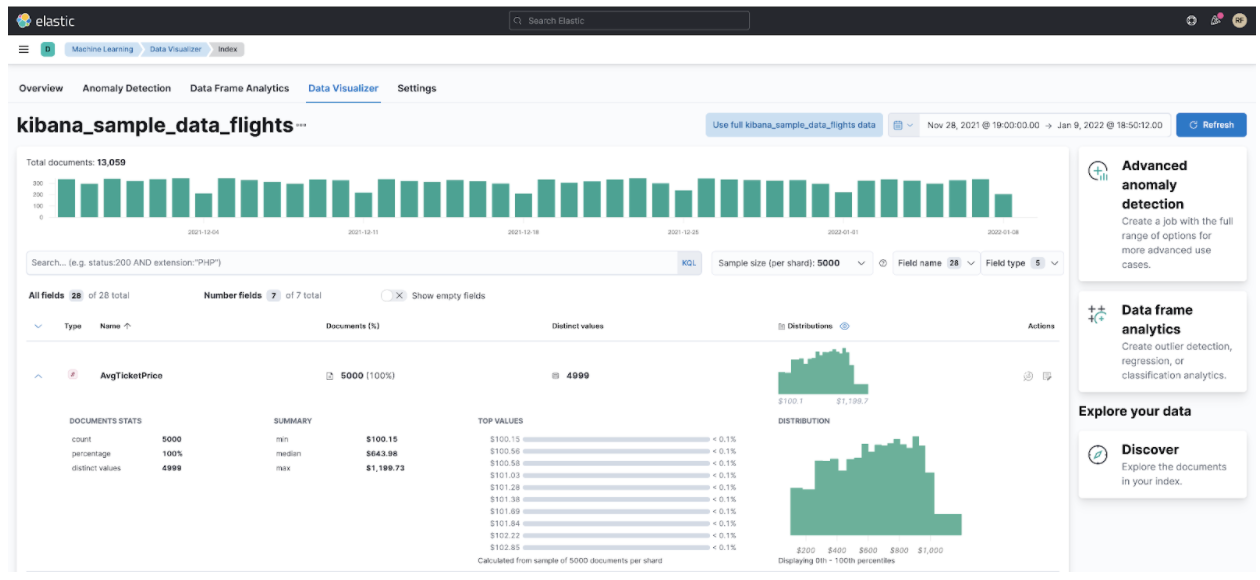
Step 3: Identifying Key Indicators
One of the cool things about the ML support in Elastic Observability is the built-in algorithms for machine learning. There are multiple ones, starting from simple classifications to complex regressions. Because there are many, you may get confused about which one to pick. We can use the data visualizer tool to load a dataset sample and see how each algorithm mutates and analyzes our data. This is handy because it can happen before we deploy the ML jobs.
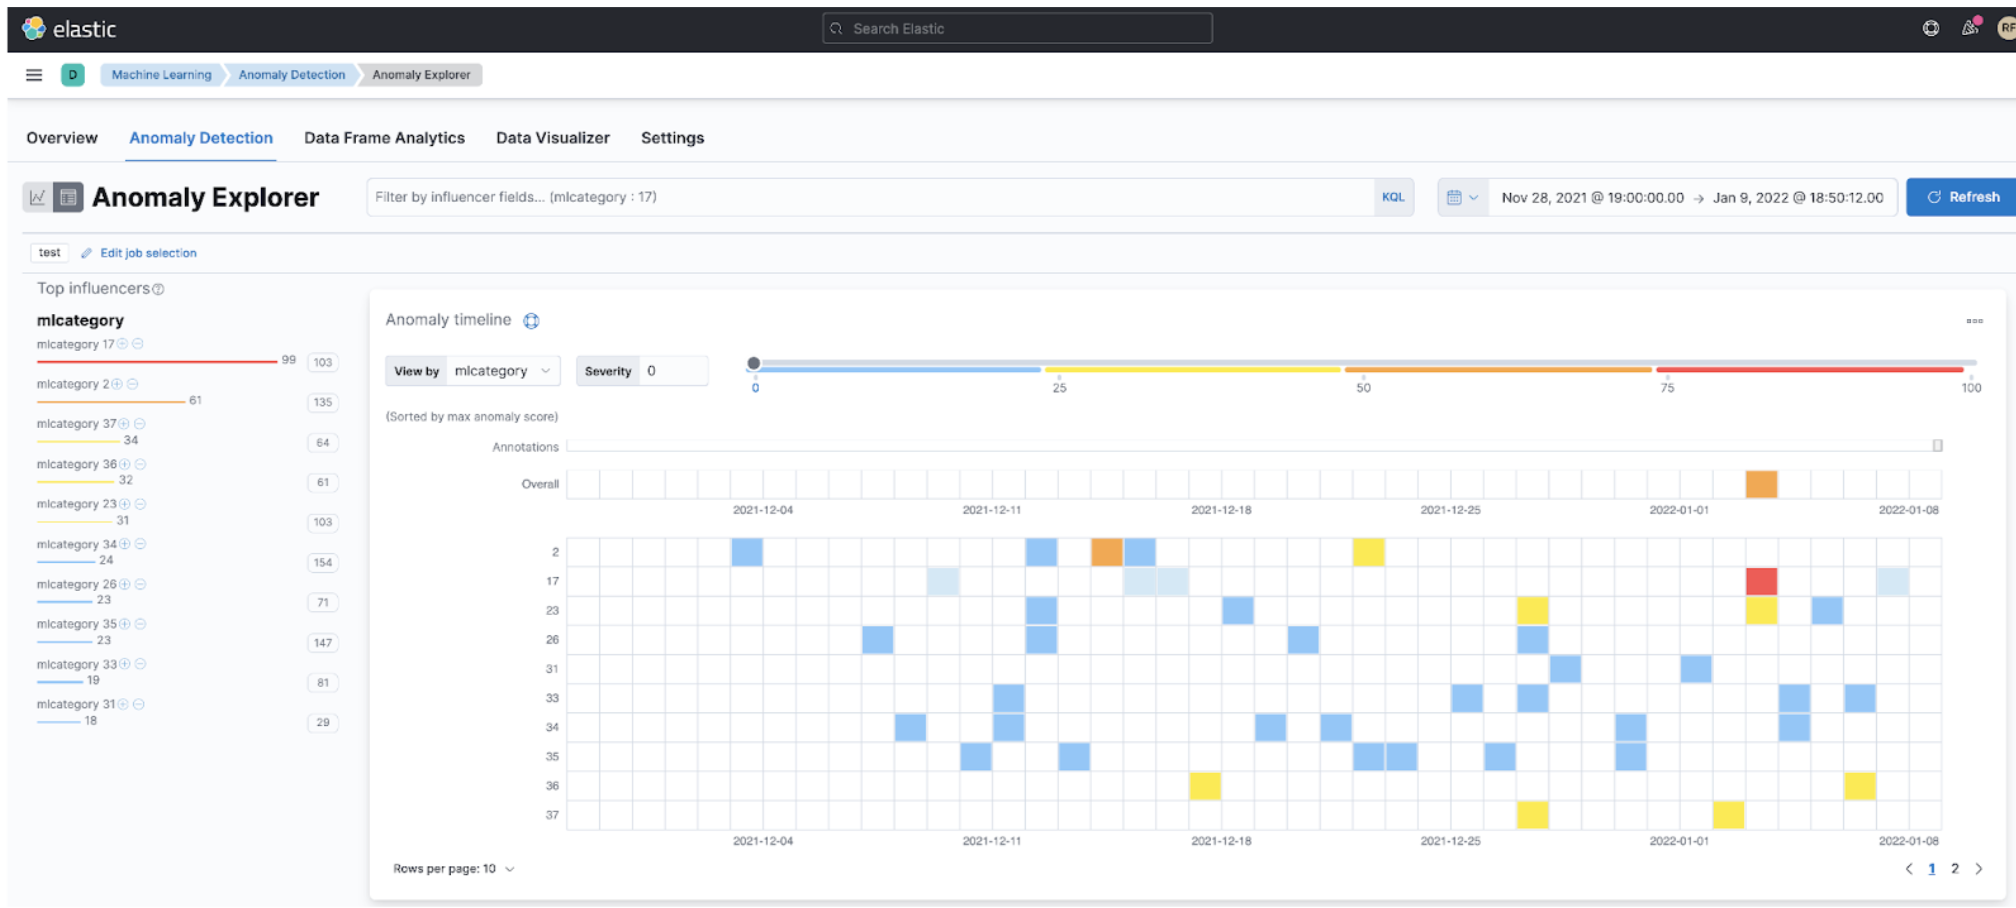
Step 4: What Type of Job Do We Want?
Ultimately, what we want to do is to enable the actual algorithms, like outlier detection. The ML jobs will do this job for us, and they can classify and do some regression on those anomalies and put them into boxes so we can classify our anomalies because they might be different. Our analysis will become much easier if we correctly enable the algorithms that flush its results into categories that are easy to look over.
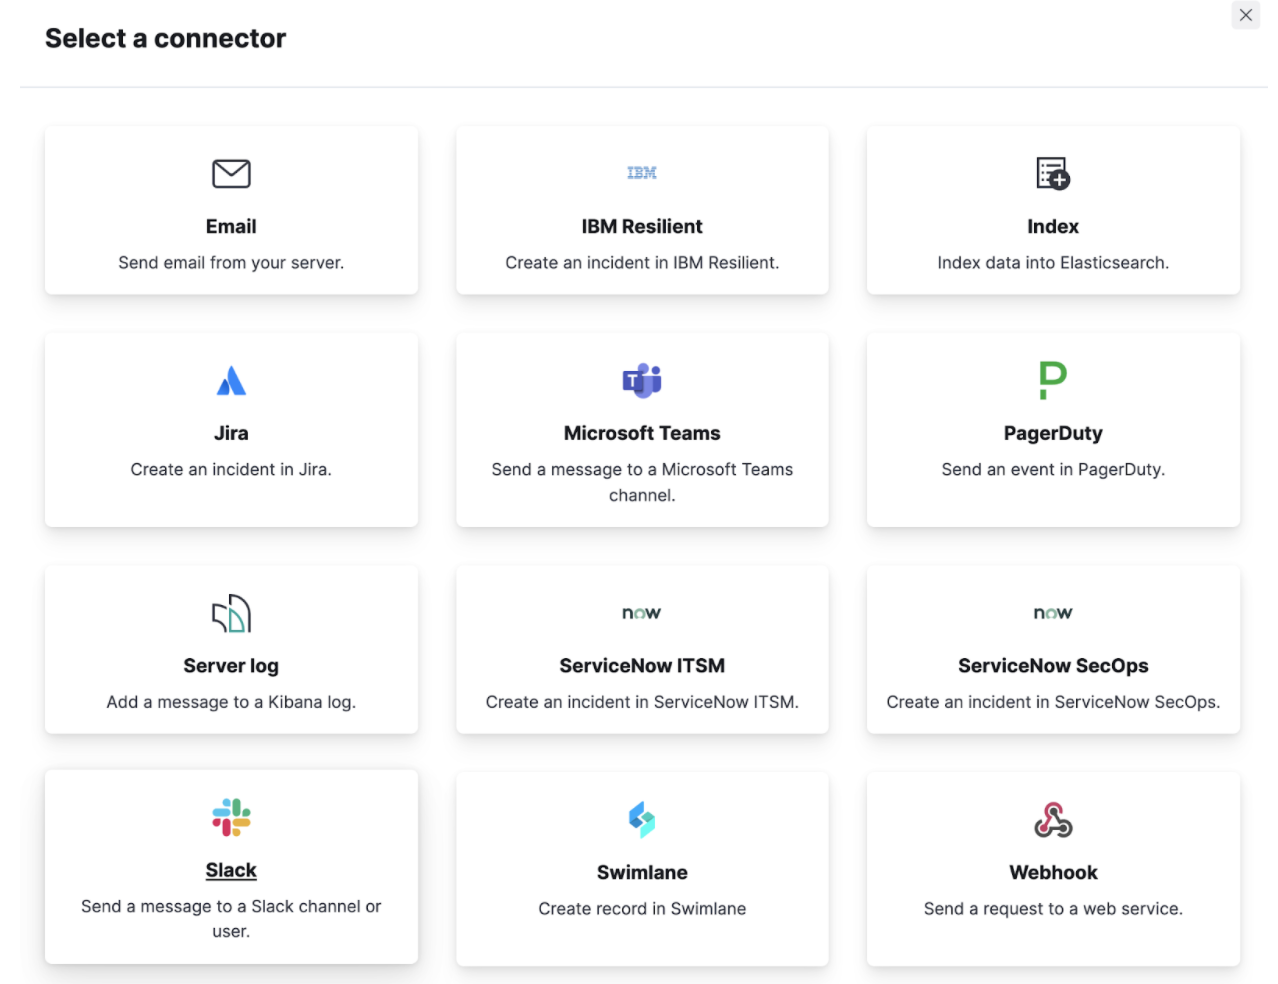
Step 5: Observing the Metrics Observer
Finally, we can use the observer to observe our results. This means that we can configure Elastic Observability to look for specific patterns related to our dataset, such as when the invocation time spent in a request becomes higher than usual for the last hour. We can configure Elastic Observability to look for this for us automatically. Instead of watching it all day, we can automatically trigger an email, an alert, a call on PagerDuty, or even a message on a Slack channel with the on-call team. We call this alerting.
Distributed Traces From Kuma to Elastic Observability
We spoke before about how to enable logs and metrics on Kuma. But there is a third type of signal we can enable on Kuma that helps with our O11y strategy: tracing. Traces help us analyze the interactions between the services and different systems that communicate through Kuma. We can quickly enable this tracing inside the code spec.
spec:
  tracing:
    defaultBackend: jaeger-collector
    backends:
    - name: jaeger-collector
      type: zipkin
      sampling: 100.0
      conf:
        url: http://jaeger-collector.kuma-tracing:9411/api/v2/spans
In this case, we are enabling the trace collection via the Jaeger protocol and sending those traces to an HTTP endpoint. We also enabled the sampling strategy and configured it to collect 100% of the traces. That means that for each interaction within Kuma, a trace will be collected and emitted. Eventually, this might get a bit chatty, depending on the number of data planes deployed.
This is usually not a problem at the Kuma layer, but it may become one while transmitting this data to Elastic—as both networking and storage may become a bottleneck. Fortunately, we can solve this at the collector level, as we’ll dive into next.
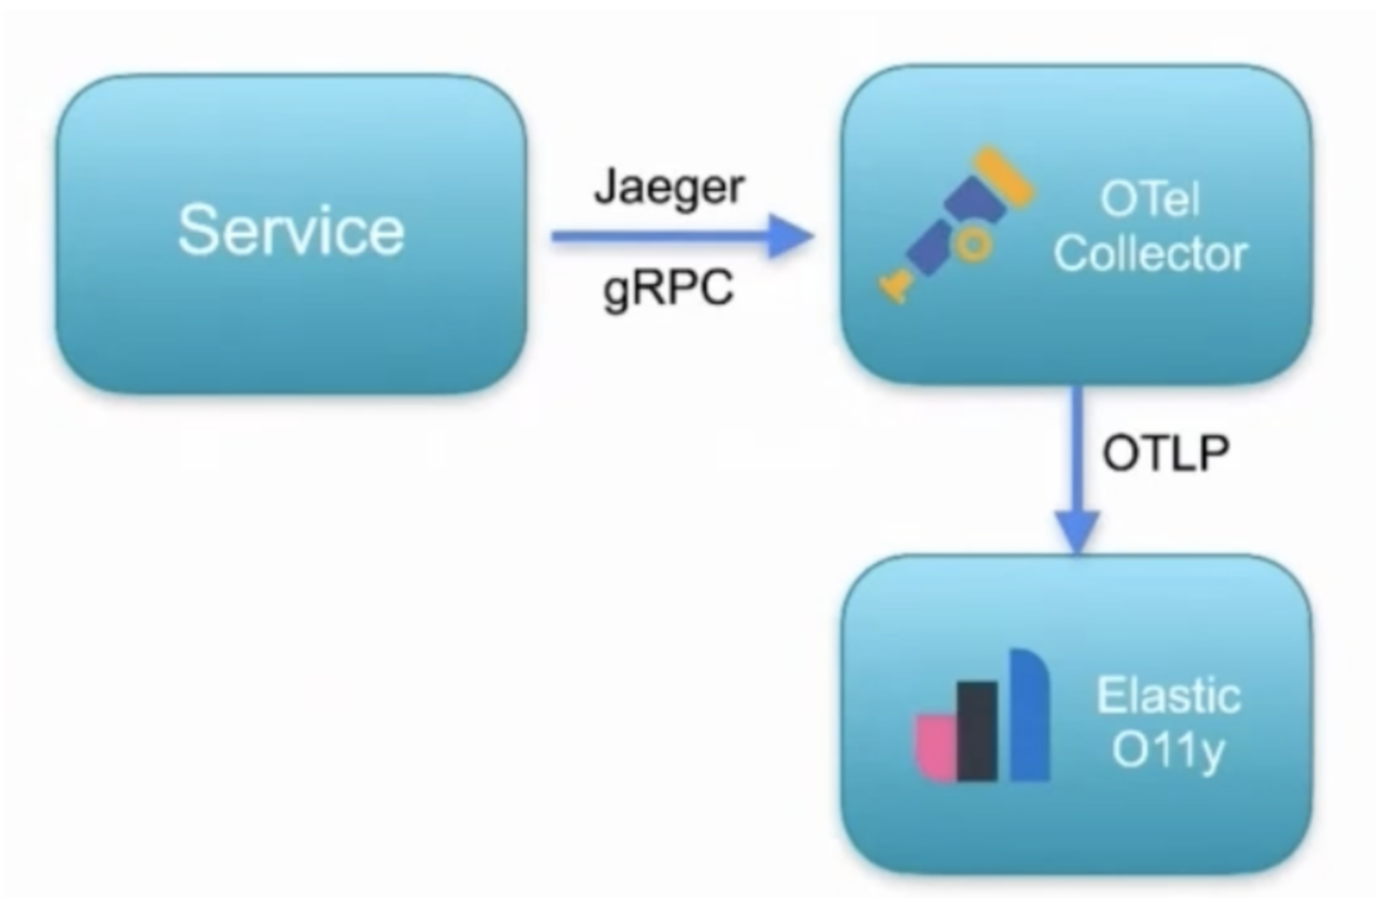
To send the traces from Kuma to Elastic Observability, we can use the OpenTelemetry collector. There, we can configure a Jaeger receiver and expose it to the exact host and port that Kuma is configured to send the data to. We will also configure an exporter to send the traces to Elastic Observability. Optionally, we could configure a processor that can buffer/throttle the sending to allow Elastic Observability to receive the data at a pace that it can handle. This is important if we, for example, enabled the sampling strategy in Kuma to 100%, but we don't want to send all the data to the backend.
receivers:
 jaeger:
   protocols:
     grpc:
       jaeger/withendpoint:
         protocols:
           grpc:
             endpoint: 0.0.0.0:14260
Once we integrate our traces, metrics, and logs with Elastic, they can be correlated and talk to each other. The algorithms will be more precise. For example, if we know that a trace carries the information about impacted transactions, we can quickly pinpoint the root cause of where the problem occurs.
Conclusion
Now we’re ready to change the status quo. We can work smarter by combining the flexibility of Kuma with the power of the Elastic Observability to ingest, store and analyze massive amounts of observability data. We learned how to collect metrics from Kuma via Prometheus, bring these metrics into Elasticsearch using Metricbeat and create machine learning jobs to look for anomalies that can alert us when something interesting happens.
Look out for a future Kong Builders episode on this topic, where we’ll dive deeper into real use cases on how Kuma and Elastic can be used together to work smarter, not harder. Let us know what you’d like to see on Twitter @riferrei or @gAmUssA.
Published at DZone with permission of Vik Gamov. See the original article here.
Opinions expressed by DZone contributors are their own.
Comments