

A/B Testing Under Shared Constraints: Supply, Inventory, and User Attention
A practical method for separating incremental system value from cannibalization in marketplace and multi-surface experiments.
Why Local Lift Does Not Mean System Growth
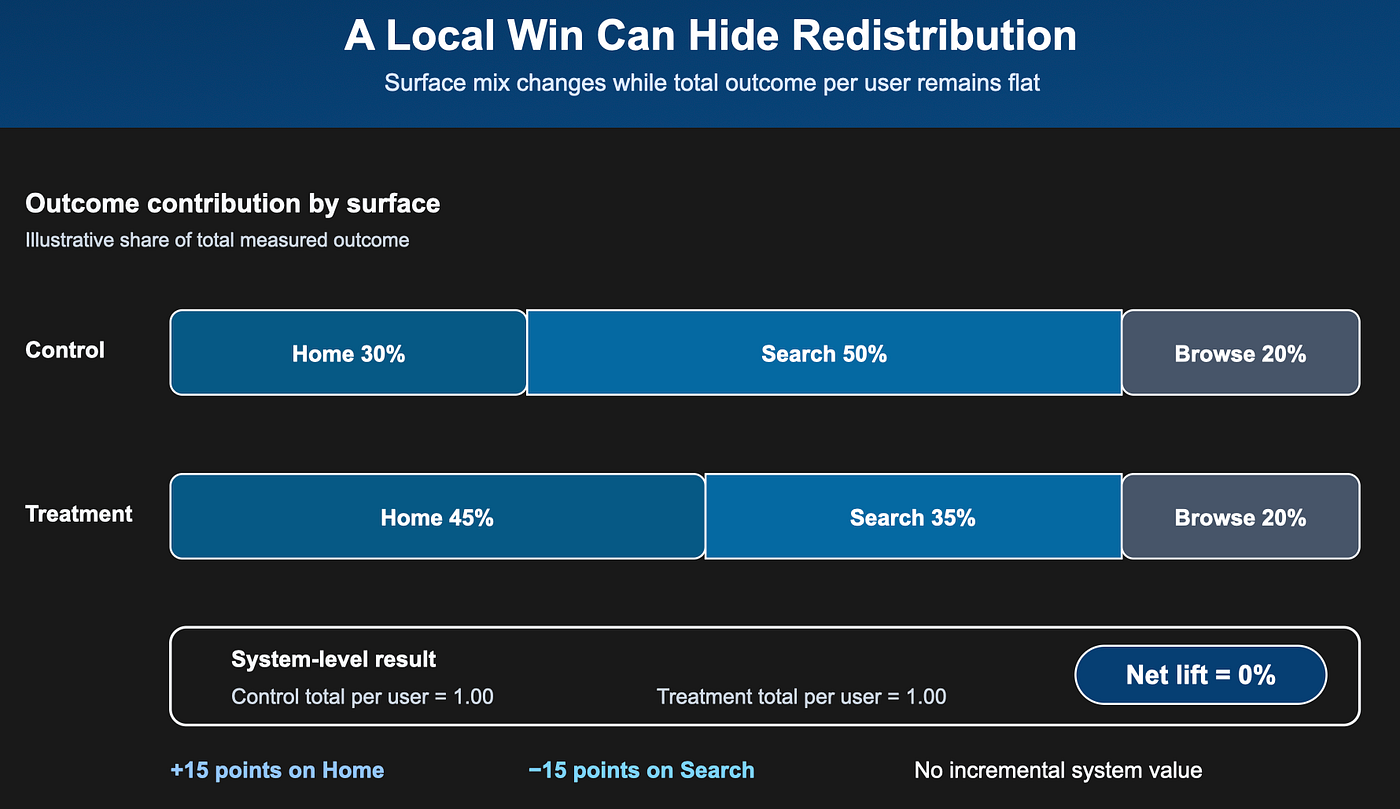
A marketplace team tests a new ranking policy. On the home surface, the share of user activity rises from 30% in control to 45% in treatment: a 15-percentage-point lift. Assignment is balanced, tracking is complete, and the confidence interval excludes zero. The result looks ready to ship.
Then the team expands the analysis. Search activity falls by almost 15 points, browse is unchanged, and total activity per user remains flat. The treatment did not create more engagement. It changed where that engagement happened.
The home surface gained activity, but the product as a whole did not.
Nothing about the local calculation is wrong. The A/B test correctly answered, “Did activity increase on home?” The mistake was treating that answer as proof that total activity increased. A precise local estimate can still support the wrong launch decision when users, suppliers, or product surfaces compete for a shared resource.
Teams often respond by reaching for a switchback, cluster randomization, or separate budgets. Before changing the design, answer two simpler questions:
- Did the treatment increase the system total or redistribute an existing outcome?
- Were treatment and control isolated at the level where the shared resource operated?
This article presents a practical workflow for answering both questions. It reconciles local changes against a system total using the randomized-user denominator, then screens for coupling inside the resource pools shared by the experiment arms.
Why Shared Constraints Change the Meaning of Lift
An ordinary user-level experiment assumes that one user’s assignment does not change another user’s outcome. This condition is part of the Stable Unit Treatment Value Assumption (SUTVA). It becomes questionable when experimental units compete through a shared constraint:
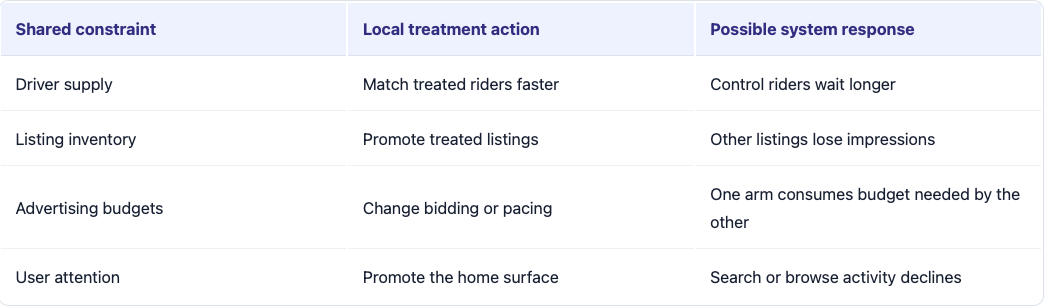
The first three examples can create interference between experimental units. The fourth can create cannibalization between product surfaces even when user assignment itself is clean. These mechanisms are related, but they are not the same claim:
- Interference means that treatment assigned to one unit changes another unit’s outcome.
- Cannibalization means that a measured gain comes from a corresponding loss elsewhere in the system.
- Incrementality means that the treatment increases the outcome the system ultimately values, rather than changing its location or attribution.
Assignment, sample-ratio, exposure, and telemetry checks still come first. Once they pass, the next review asks whether the success metric covers the system outcome and whether the randomization unit isolates the rollout effect.
Use a Local-to-System Reconciliation
The local-to-system reconciliation brings those checks into one review. It has five parts:
- Define the shared constraint and system boundary. Identify the supply, inventory, budget, attention, or capacity through which outcomes can move, and decide what must be counted for the launch decision.
- Measure each local change. Estimate treatment-control differences for the components inside that boundary.
- Reconcile the total. Aggregate those components with one denominator tied to the randomization unit.
- Check isolation inside shared pools. Examine whether the arms move together inside markets, regions, seller clusters, or budget groups.
- Classify the evidence. Treat the result as incremental, redistributive, isolation-sensitive, or inconclusive before deciding whether to ship or redesign.
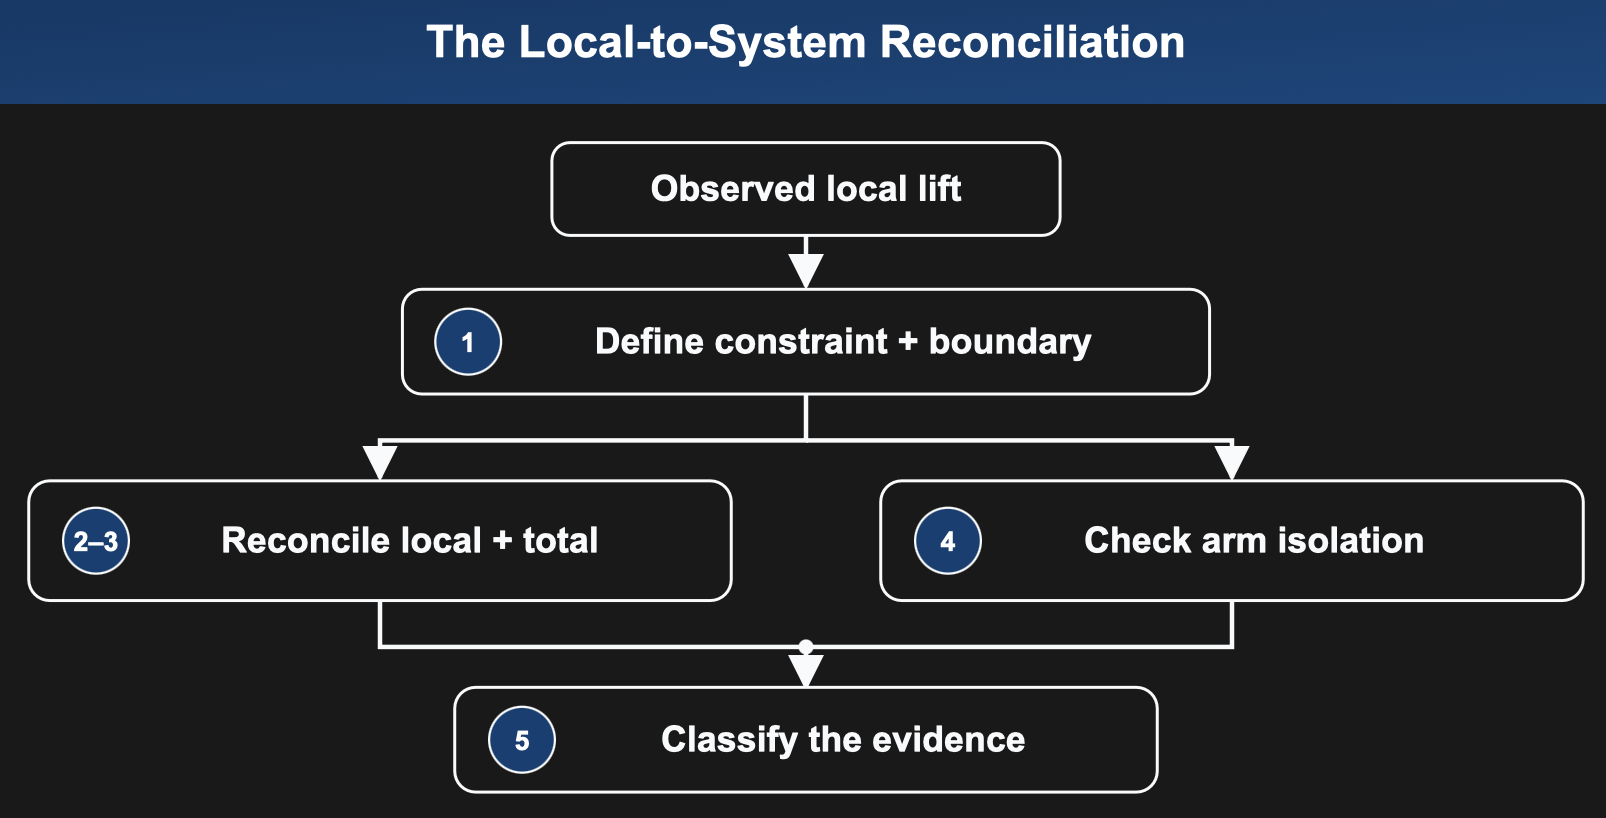
Start with the boundary. It must correspond to the business decision, and every component inside it must use a compatible unit of analysis. A convenient total that excludes the surface likely to lose value simply moves the blind spot.
Reconcile Outcomes per Randomized User
Here is what the reconciliation looks like in a deterministic synthetic experiment with three mutually exclusive surfaces: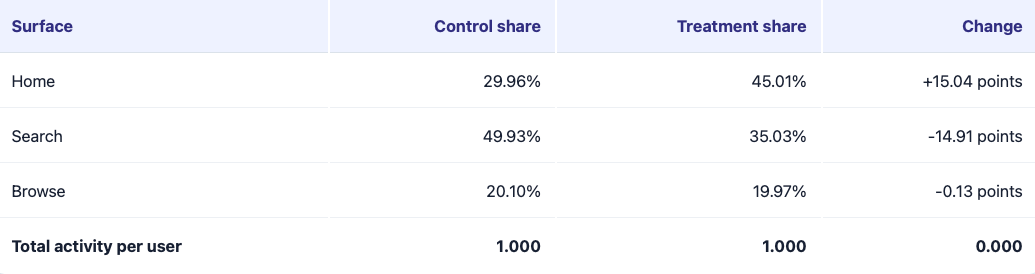
The home result is real. It just does not show incremental engagement: search loses almost exactly what home gains.
Calculate the treatment-control change for every affected surface using the randomized-user denominator. The system change is the sum of those component changes. The total absolute movement shows how much behavior shifted across surfaces. When movement is large, but the system change is close to zero, the treatment is primarily redistributive.
The implementation preserves the randomized-unit denominator:
arm_size = df.groupby("variant")["user_id"].nunique()

surface_per_user = (
    df.groupby(["variant", "surface"])["activity"]
      .sum()
      .unstack(fill_value=0)
      .div(arm_size, axis=0)
)

system_per_user = surface_per_user.sum(axis=1)
surface_delta = (
    surface_per_user.loc["treatment"]
    - surface_per_user.loc["control"]
)

system_delta = surface_delta.sum()
local_movement = surface_delta.abs().sum()
Counting event rows instead would let an engagement-changing treatment alter its own denominator. Per-user outcomes preserve the connection between the reported effect and the randomization design.
What To Watch For
- Do not interpret shares without levels. A surface share can fall while its absolute activity rises if the total grows.
- Make the parts add up. Overlapping or incomplete surfaces do not produce a clean system total. State what is excluded, and avoid double counting.
- Keep the statistical review. Reconciliation is a diagnostic, not a standalone hypothesis test. Component and system estimates still need confidence intervals that respect the experiment design.
Use the system total as part of the Overall Evaluation Criterion (OEC): the metric or combination of metrics used to judge experimental success and connect short-term measurement to longer-term goals (Kohavi, Tang, and Xu, Chapter 7). Home activity explains where behavior moved; it should not decide the launch when the objective is total engagement or marketplace value.
Once the metric boundary is clear, the next question is whether the experiment arms were truly isolated.
Check for Coupling Inside Shared Resource Pools
Reconciliation can show that value moved. It cannot tell you whether treatment and control affected one another. A useful risk screen asks whether both arms remain related inside pools that share supply, inventory, or budget.
Do not correlate raw market means. Large markets can have high outcomes in both arms for stable reasons unrelated to the experiment. Remove each market’s pre-period baseline and compare changes:
market_means = (
    df.groupby(["market_id", "period", "variant"])["revenue"]
      .mean()
      .unstack(["period", "variant"])
      .dropna()
)

control_change = (
    market_means[("post", "control")]
    - market_means[("pre", "control")]
)
treatment_change = (
    market_means[("post", "treatment")]
    - market_means[("pre", "treatment")]
)

coupling = control_change.corr(treatment_change)
The synthetic data returns a correlation of 0.873. Treat that as a review signal, not an “interference detected” verdict. Common shocks, seasonality, measurement changes, and omitted market characteristics can produce the same pattern.
The shared-pool coupling screen has one job: challenge the randomization unit. Define resource pools before looking at results, report the number and size of those pools, and add uncertainty or randomization inference. Even with those safeguards, the screen can identify risk in the original estimate; it cannot correct that estimate.
Convert the Evidence Into a Launch Decision
At this point, the team has two different forms of evidence: whether value moved across the system and whether the experiment arms may have shared the same constraint. Together, they lead to different actions:
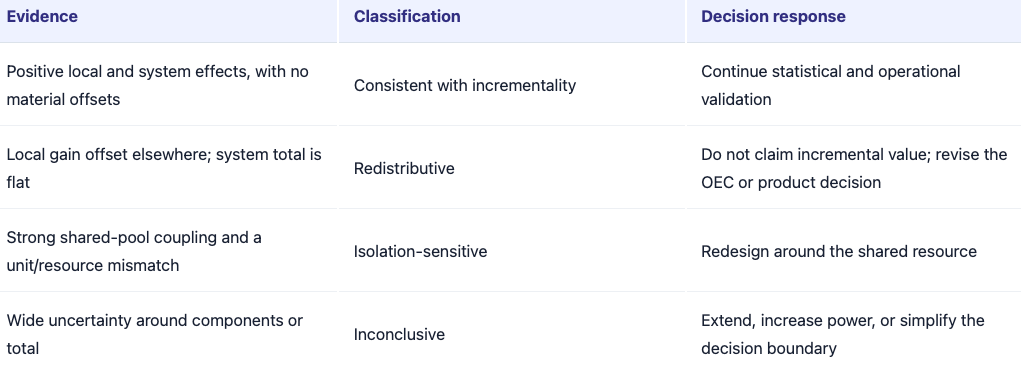
The categories should not be collapsed into a single reliability score. Redistribution and interference answer different questions. A treatment can reallocate activity across surfaces without contaminating control, or it can interfere through shared supply even when the measured system total is positive.
Only an isolation problem necessarily requires a new experiment design.
Match the Design to the Constraint
- Shared supply over time and region: Use a switchback to randomize the market state rather than individual transactions. DoorDash uses this pattern for dispatch experiments (DoorDash Engineering).
- Fixed campaign budgets: Separate the budgets used by treatment and control. LinkedIn describes this budget-split design for its advertising marketplace (LinkedIn Engineering).
- Marketplace or network spillovers: Randomize clusters rather than individuals, while accounting for the loss of power that comes with fewer independent units (Holtz et al.).
- Competition between listings or surfaces: Keep local metrics as diagnostics, but base the decision on incremental platform value. Airbnb describes this distinction when accounting for booking cannibalization (Airbnb Engineering).
These are responses to a diagnosed constraint, not a checklist to apply to every experiment.
Key Takeaways
- Name the shared supply, inventory, budget, or attention constraint before choosing the randomization unit.
- Define the system boundary before reviewing local lift.
- Calculate every component with the randomized-unit denominator.
- Compare absolute outcomes before interpreting changes in surface share.
- Treat shared-pool coupling as a design-review signal, not proof of interference.
- Redesign only when the evidence shows that treatment and control were not isolated at the level where the system operates.
A p-value can tell you whether the observed treatment-control difference is compatible with a null hypothesis under a statistical model. It cannot tell you whether the experiment measured the right boundary or isolated the right unit.
The final question is not whether the treatment won its local comparison. It is whether launching the treatment would make the system better.
Reference Implementation
The deterministic example behind the reported values is available in the runnable Python script. A broader open-source implementation of related diagnostics is available in the Expguard repository and its archived release. These implementations are optional; the workflow applies independently of either codebase.
References and Further Reading
- Kohavi, R., Tang, D., and Xu, Trustworthy Online Controlled Experiments: A Practical Guide to A/B Testing, Cambridge University Press, 2020.
- DoorDash Engineering, Switchback Tests and Randomized Experimentation Under Network Effects.
- Holtz et al., Reducing Interference Bias in Online Marketplace Pricing Experiments.
- Li et al., Interference, Bias, and Variance in Two-Sided Marketplace Experimentation.
- LinkedIn Engineering, Budget-Split Testing: A Trustworthy and Powerful Approach to Marketplace A/B Testing.
- Liu, Mao, and Kang, Trustworthy Online Marketplace Experimentation With Budget-Split Design.
- Airbnb Engineering, How Airbnb Measures Future Value To Standardize Tradeoffs.
Published at DZone with permission of Arun Thomas. See the original article here.
Opinions expressed by DZone contributors are their own.