Mastering Data Preparation for Effective Dashboards
In the era of data-driven decision-making, Dashboards have become indispensable everyday tools for visualizing data insights and trends.
Join the DZone community and get the full member experience.
Join For FreeA Concise Guide To Mastering Data Preparation for Effective Dashboards
In the era of data-driven decision-making, Dashboards have become indispensable everyday tools for visualizing data insights and trends. However, the effectiveness of these dashboards is heavily dependent on the structure and the quality of the underlying data. This article dives into the critical processes of data cleaning, data blending, and data modeling and provides a roadmap for data preparation that powers insightful, actionable, and effective dashboards.
Foundation: The Three Pillars of Data Preparation
Before a dataset can be transformed into a compelling dashboard, it must undergo a meticulous data preparation process. This process ensures that data is accurate, consistent, and in a format that can be easily and effectively analyzed and consumed by the data visualization tools.
1. Data Cleaning: A Process of Ensuring Data Consistency and Accuracy
Data cleaning, also known as data scrubbing, is the process of finding and correcting/removing errors, inconsistencies, duplications, and missing entries from data to improve its consistency, accuracy, and quality. It ranges from simple punctuation errors and human errors like data entry errors to complex duplications due to multiple unmatched upstream data source errors and very outdated/stale data across multiple systems.
Example: Cleaning Customer Order Data
Imagine a dataset of customer orders that includes customer order IDs, order dates, product names, and purchase amounts. The data cleaning process might involve the following process:
Handling/Removing Duplicates
There are several ways to remove duplicates. Let’s look at one simple example of using DISTINCT to Identify and remove duplicate records to prevent skewed analysis.
SELECT DISTINCT * FROM customer_orders;Handling Missing Values
Addressing missing customer names by assigning a placeholder value or excluding orders with incomplete information.
UPDATE customer_orders SET customer_name = 'unknown' WHERE customer_name IS NULL;Correcting Data Formats
Standardizing the format of customer order dates to ensure consistency across the dataset in the YYYY-MM-DD format, thereby facilitating accurate time-series analysis.
UPDATE customer_orders SET order_date = TO_DATE (order_date, 'YYYY-MM-DD');These are some essential steps that help maintain the integrity and reliability of the data using the customer order data example, which forms a clean and consistent base for further analysis and visualization in dashboards.
2. Data Modeling: Structuring Data for Analysis
Data modeling involves designing data structures that support effective analysis and visualization. This step defines how different pieces of data can relate to each other and organizes them into a coherent schema.
Example: Modeling E-Commerce Data
In an e-commerce context, data modeling might involve creating a relational schema that includes tables for customers, orders, products, and order details. The relationships between these tables enable a comprehensive analysis of customer behavior, product performance, purchase patterns, and sales trends.
- Customers table: Stores customer information.
- Products table: Contains details of each product.
- Orders table: Records of each order placed.
- Order details table: Maps orders to the products purchased, including quantities and prices.
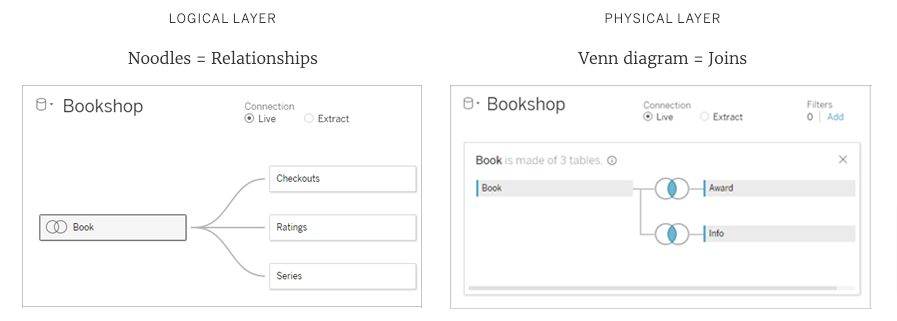
Modern Data Visualization tools like Tableau integrates data modeling within the tool itself, and a data model can be as simple as a single table for quick analysis, or it can be more complex, with multiple tables that use different combinations of relationships, joins, and unions. Tableau data model has two layers: the logical layer, which acts as a relationship canvas, and the physical layer, where you can combine data using joins and unions.
3. Data Blending: Combining Data From Multiple Sources
Data blending is the process of combining data from multiple different sources into a single dataset that provides a unified view for analysis.
Example: Blending Marketing and Sales Data
Consider blending data from a marketing platform and a CRM system to analyze the effectiveness of marketing campaigns on sales performance.
- Marketing data: Campaign Names and IDs, channels, and engagement metrics.
- Sales data: Transaction records, customer IDs, product IDs, and sales amounts.
Using a tool like Alteryx or any SQL editor, you can blend these datasets on common fields such as campaign IDs and customer IDs to analyze how different marketing channels influence sales. The SQL Query below provides insights into the total sales generated by each marketing campaign, broken down by channel.
SELECT m.campaign_id, m.channel, SUM(s.sales_amount) AS total_sales

FROM marketing_data m

JOIN sales_data s ON m.campaign_id = s.campaign_id

GROUP BY m.campaign_id, m.channel;
Below Is an Example of Data Blending Using Alteryx
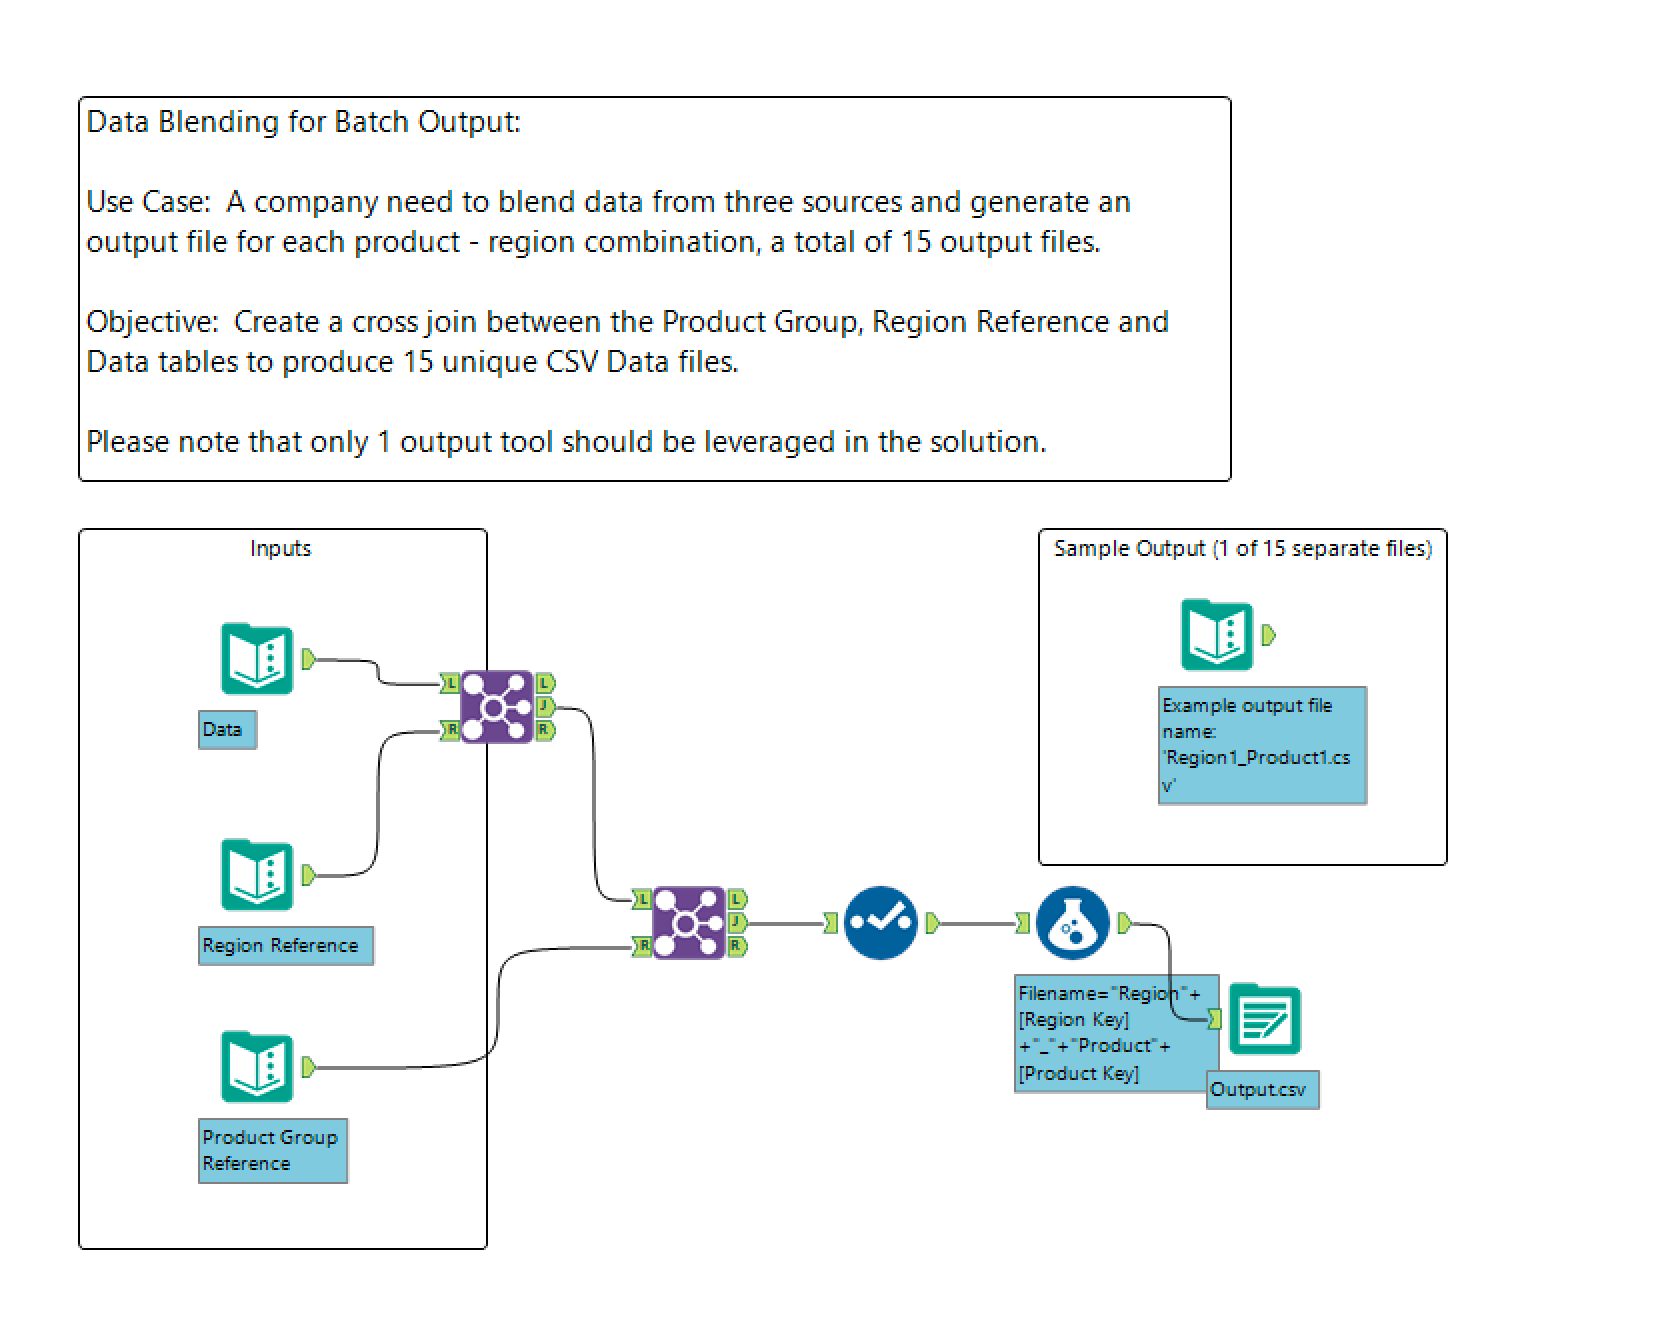
Some Best Practices for Dashboard Data Preparation
- Automate wherever possible: Use tools like Alteryx for automation of cleaning and blending tasks, saving time and reducing errors.
- Validate data regularly: Implement validation checks to catch and correct data issues early in the process.
- Design for performance: Optimize data models and queries to enhance dashboard loading/rendering times and responsiveness.
Conclusion
The journey from raw data to insightful dashboards is paved with critical data preparation steps. By diligently cleaning, modeling, and blending your data, you lay the foundation for dashboards that not only captivate with their visual appeal but also drive decision-making with accuracy and depth. Remember, the quality of your dashboards is a direct reflection of the attention and care invested in preparing your data. With the right practices and tools, you can transform disparate data into coherent stories that inform, inspire, and influence.
Opinions expressed by DZone contributors are their own.
Comments