Mastering Serverless Debugging
Discover effective strategies for debugging serverless in general and AWS Lambda. Serverless can be painful, but not a bottomless pit of despair.
Join the DZone community and get the full member experience.
Join For FreeServerless computing has emerged as a transformative approach to deploying and managing applications. The theory is that by abstracting away the underlying infrastructure, developers can focus solely on writing code. While the benefits are clear—scalability, cost efficiency, and performance—debugging serverless applications presents unique challenges. This post explores effective strategies for debugging serverless applications, particularly focusing on AWS Lambda.
Before I proceed I think it's important to disclose a bias: I am personally not a huge fan of Serverless or PaaS after I was burned badly by PaaS in the past. However, some smart people like Adam swear by it so I should keep an open mind.
Introduction to Serverless Computing
Serverless computing, often referred to as Function as a Service (FaaS), allows developers to build and run applications without managing servers. In this model, cloud providers automatically handle the infrastructure, scaling, and management tasks, enabling developers to focus purely on writing and deploying code. Popular serverless platforms include AWS Lambda, Azure Functions, and Google Cloud Functions.
In contrast, Platform as a Service (PaaS) offers a more managed environment where developers can deploy applications but still need to configure and manage some aspects of the infrastructure. PaaS solutions, such as Heroku and Google App Engine, provide a higher level of abstraction than Infrastructure as a Service (IaaS) but still require some server management.
Kubernetes, which we recently discussed, is an open-source container orchestration platform that automates the deployment, scaling, and management of containerized applications. While Kubernetes offers powerful capabilities for managing complex, multi-container applications, it requires significant expertise to set up and maintain. Serverless computing simplifies this by removing the need for container orchestration and management altogether.
The "catch" is twofold:
- Serverless programming removes the need to understand the servers but also removes the ability to rely on them resulting in more complex architectures.
- Pricing starts off cheap. Practically free. It can quickly escalate especially in case of an attack or misconfiguration.
Challenges of Serverless Debugging
While serverless architectures offer some benefits, they also introduce unique debugging challenges. The primary issues stem from the inherent complexity and distributed nature of serverless environments. Here are some of the most pressing challenges.
Disconnected Environments
One of the major hurdles in serverless debugging is the lack of consistency between development, staging, and production environments. While traditional development practices rely on these separate environments to test and validate code changes, serverless architectures often complicate this process. The differences in configuration and scale between these environments can lead to bugs that only appear in production, making them difficult to reproduce and fix.
Lack of Standardization
The serverless ecosystem is highly fragmented, with various vendors offering different tools and frameworks. This lack of standardization can make it challenging to adopt a unified debugging approach. Each platform has its own set of practices and tools, requiring developers to learn and adapt to multiple environments.
This is slowly evolving with some platforms gaining traction, but since this is a vendor-driven industry, there are many edge cases.
Limited Debugging Tools
Traditional debugging tools, such as step-through debugging and breakpoints, are often unavailable in serverless environments. The managed and controlled nature of serverless functions restricts access to these tools, forcing developers to rely on alternative methods, such as logging and remote debugging.
Concurrency and Scale
Serverless functions are designed to handle high concurrency and scale seamlessly. However, this can introduce issues that are hard to reproduce in a local development environment. Bugs that manifest only under specific concurrency conditions or high loads are particularly challenging to debug.
Notice that when I discuss concurrency here I'm often referring to race conditions between separate services.
Effective Strategies for Serverless Debugging
Despite these challenges, several strategies can help make serverless debugging more manageable. By leveraging a combination of local debugging, feature flags, staged rollouts, logging, idempotency, and Infrastructure as Code (IaC), developers can effectively diagnose and fix issues in serverless applications.
Local Debugging With IDE Remote Capabilities
While serverless functions run in the cloud, you can simulate their execution locally using tools like AWS SAM (Serverless Application Model). This involves setting up a local server that mimics the cloud environment, allowing you to run tests and perform basic trial-and-error debugging.
To get started, you need to install Docker or Docker Desktop, create an AWS account, and set up the AWS SAM CLI. Deploy your serverless application locally using the SAM CLI, which enables you to run the application and simulate Lambda functions on your local machine. Configure your IDE for remote debugging, launching the application in debug mode, and connecting your debugger to the local host. Set breakpoints to step through the code and identify issues.
Using Feature Flags for Debugging
Feature flags allow you to enable or disable parts of your application without deploying new code. This can be invaluable for isolating issues in a live environment. By toggling specific features on or off, you can narrow down the problematic areas and observe the application’s behavior under different configurations.
Implementing feature flags involves adding conditional checks in your code that control the execution of specific features based on the flag’s status. Monitoring the application with different flag settings helps identify the source of bugs and allows you to test fixes without affecting the entire user base.
This is essentially "debugging in production." Working on a new feature?
Wrap it in a feature flag which is effectively akin to wrapping the entire feature (client and server) in if statements. You can then enable it conditionally globally or on a per-user basis. This means you can test the feature, and enable or disable it based on configuration without redeploying the application.
Staged Rollouts and Canary Deployments
Deploying changes incrementally can help catch bugs before they affect all users. Staged rollouts involve gradually rolling out updates to a small percentage of users before a full deployment. This allows you to monitor the performance and error logs of the new version in a controlled manner, catching issues early.
Canary deployments take this a step further by deploying new changes to a small subset of instances (canaries) while the rest of the system runs the stable version. If issues are detected in the canaries, you can roll back the changes without impacting the majority of users. This method limits the impact of potential bugs and provides a safer way to introduce updates. This isn't great as in some cases some demographics might be more reluctant to report errors. However, for server-side issues, this might make sense as you can see the impact based on server logs and metrics.
Comprehensive Logging
Logging is one of the most common and essential tools for debugging serverless applications. I wrote and spoke a lot about logging in the past. By logging all relevant data points, including inputs and outputs of your functions, you can trace the flow of execution and identify where things go wrong.
However, excessive logging can increase costs, as serverless billing is often based on execution time and resources used. It’s important to strike a balance between sufficient logging and cost efficiency. Implementing log levels and selectively enabling detailed logs only when necessary can help manage costs while providing the information needed for debugging.
I talk about striking the delicate balance between debuggable code, performance, and cost with logs in the following video. Notice that this is a general best practice and not specific to serverless.
Embracing Idempotency
Idempotency, a key concept from functional programming, ensures that functions produce the same result given the same inputs, regardless of the number of times they are executed. This simplifies debugging and testing by ensuring consistent and predictable behavior.
Designing your serverless functions to be idempotent involves ensuring that they do not have side effects that could alter the outcome when executed multiple times. For example, including timestamps or unique identifiers in your requests can help maintain consistency. Regularly testing your functions to verify idempotency can make it easier to pinpoint discrepancies and debug issues.
Testing is always important but in serverless and complex deployments it becomes critical. Awareness and embrace of idempotency allow for more testable code and easier-to-reproduce bugs.
Debugging a Lambda Application Locally With AWS SAM
Debugging serverless applications, particularly AWS Lambda functions, can be challenging due to their distributed nature and the limitations of traditional debugging tools. However, AWS SAM (Serverless Application Model) provides a way to simulate Lambda functions locally, enabling developers to test and debug their applications more effectively. I will use it as a sample to explore the process of setting up a local debugging environment, running a sample application, and configuring remote debugging.
Setting Up the Local Environment
Before diving into the debugging process, it's crucial to set up a local environment that can simulate the AWS Lambda environment. This involves a few key steps:
- Install Docker: Docker is required to run the local simulation of the Lambda environment. You can download Docker or Docker Desktop from the official Docker website.
- Create an AWS account: If you don't already have an AWS account, you need to create one. Follow the instructions on the AWS account creation page.
- Set up AWS SAM CLI: The AWS SAM CLI is essential for building and running serverless applications locally. You can install it by following the AWS SAM installation guide.
Running the Hello World Application Locally
To illustrate the debugging process, let's use a simple "Hello World" application. The code for this application can be found in the AWS Hello World tutorial.
1. Deploy Locally
Use the SAM CLI to deploy the Hello World application locally. This can be done with the following command:
sam local start-apiThis command starts a local server that simulates the AWS Lambda cloud environment.
2. Trigger the Endpoint
Once the local server is running, you can trigger the endpoint using a curl command:
curl http://localhost:3000/helloThis command sends a request to the local server, allowing you to test the function's response.
Configuring Remote Debugging
While running tests locally is a valuable step, it doesn't provide full debugging capabilities. To debug the application, you need to configure remote debugging. This involves several steps.
First, we need to start the application in debug mode using the following SAM command:
sam local invoke -d 5858This command pauses the application and waits for a debugger to connect.
Next, we need to configure the IDE for remote debugging. We start by setting up the IDE to connect to the local host for remote debugging. This typically involves creating a new run configuration that matches the remote debugging settings.
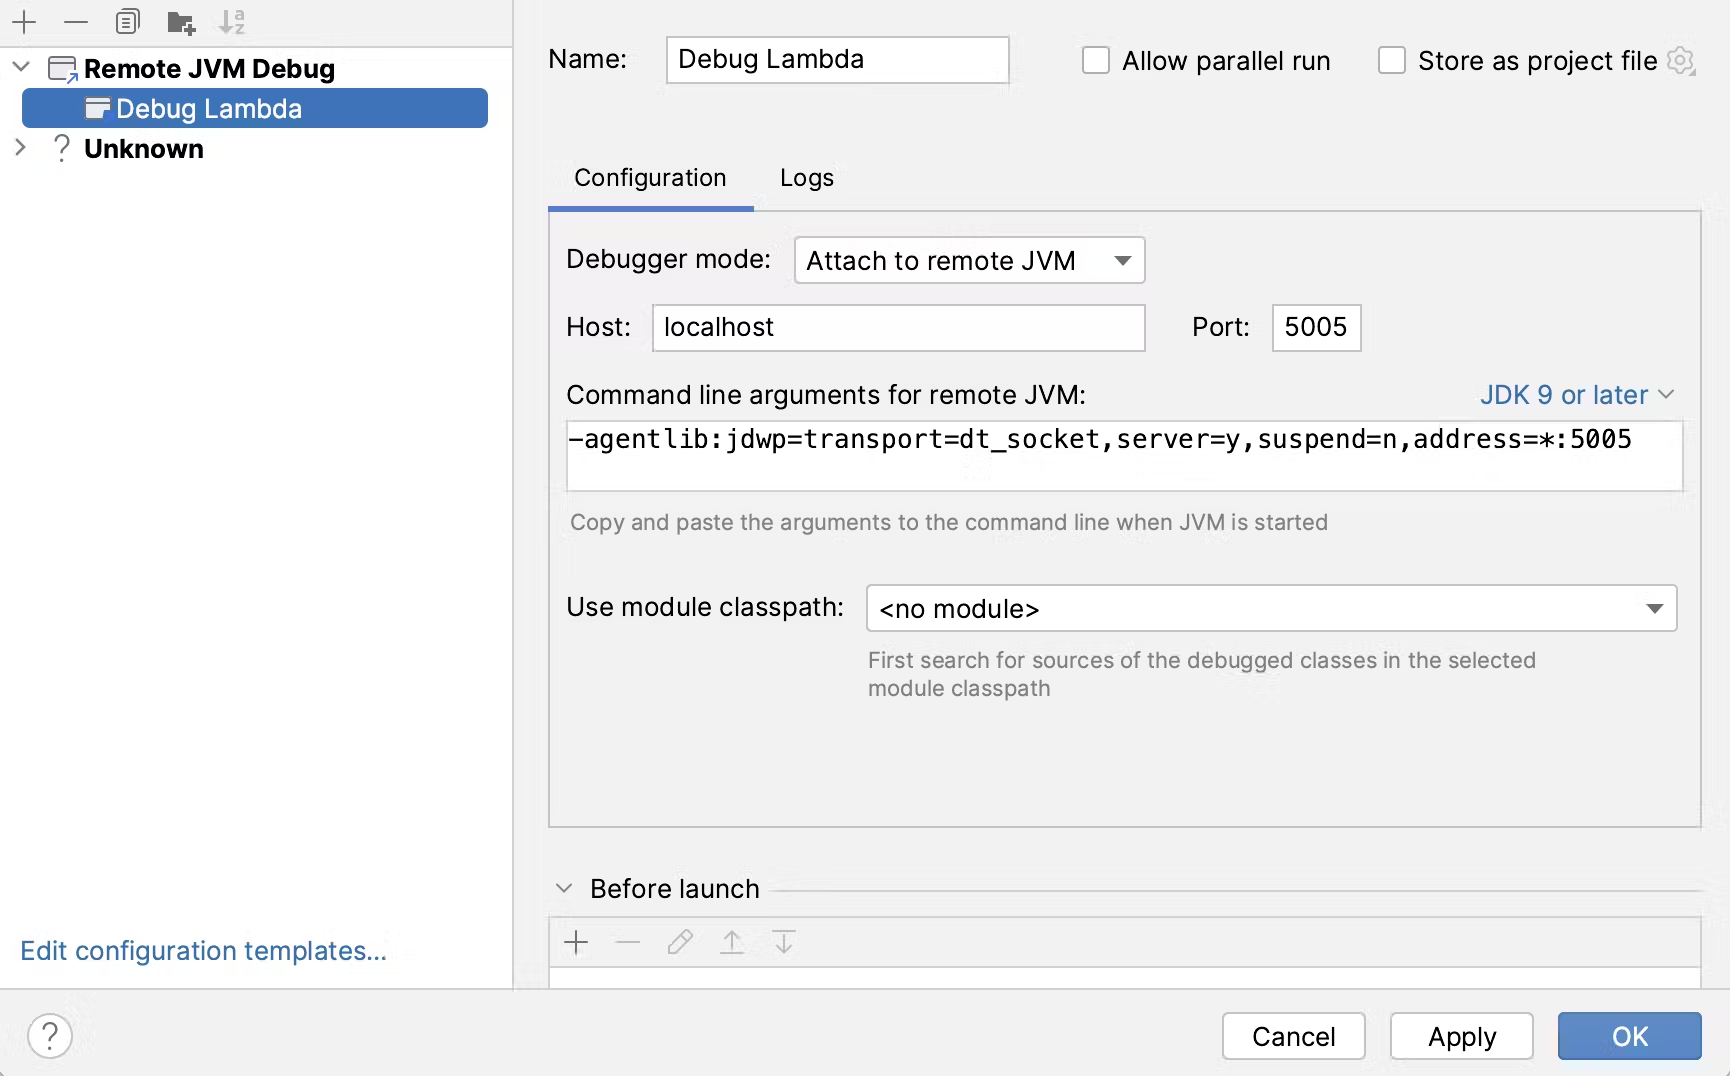
We can now set breakpoints in the code where we want the execution to pause. This allows us to step through the code and inspect variables and application state just like in any other local application.
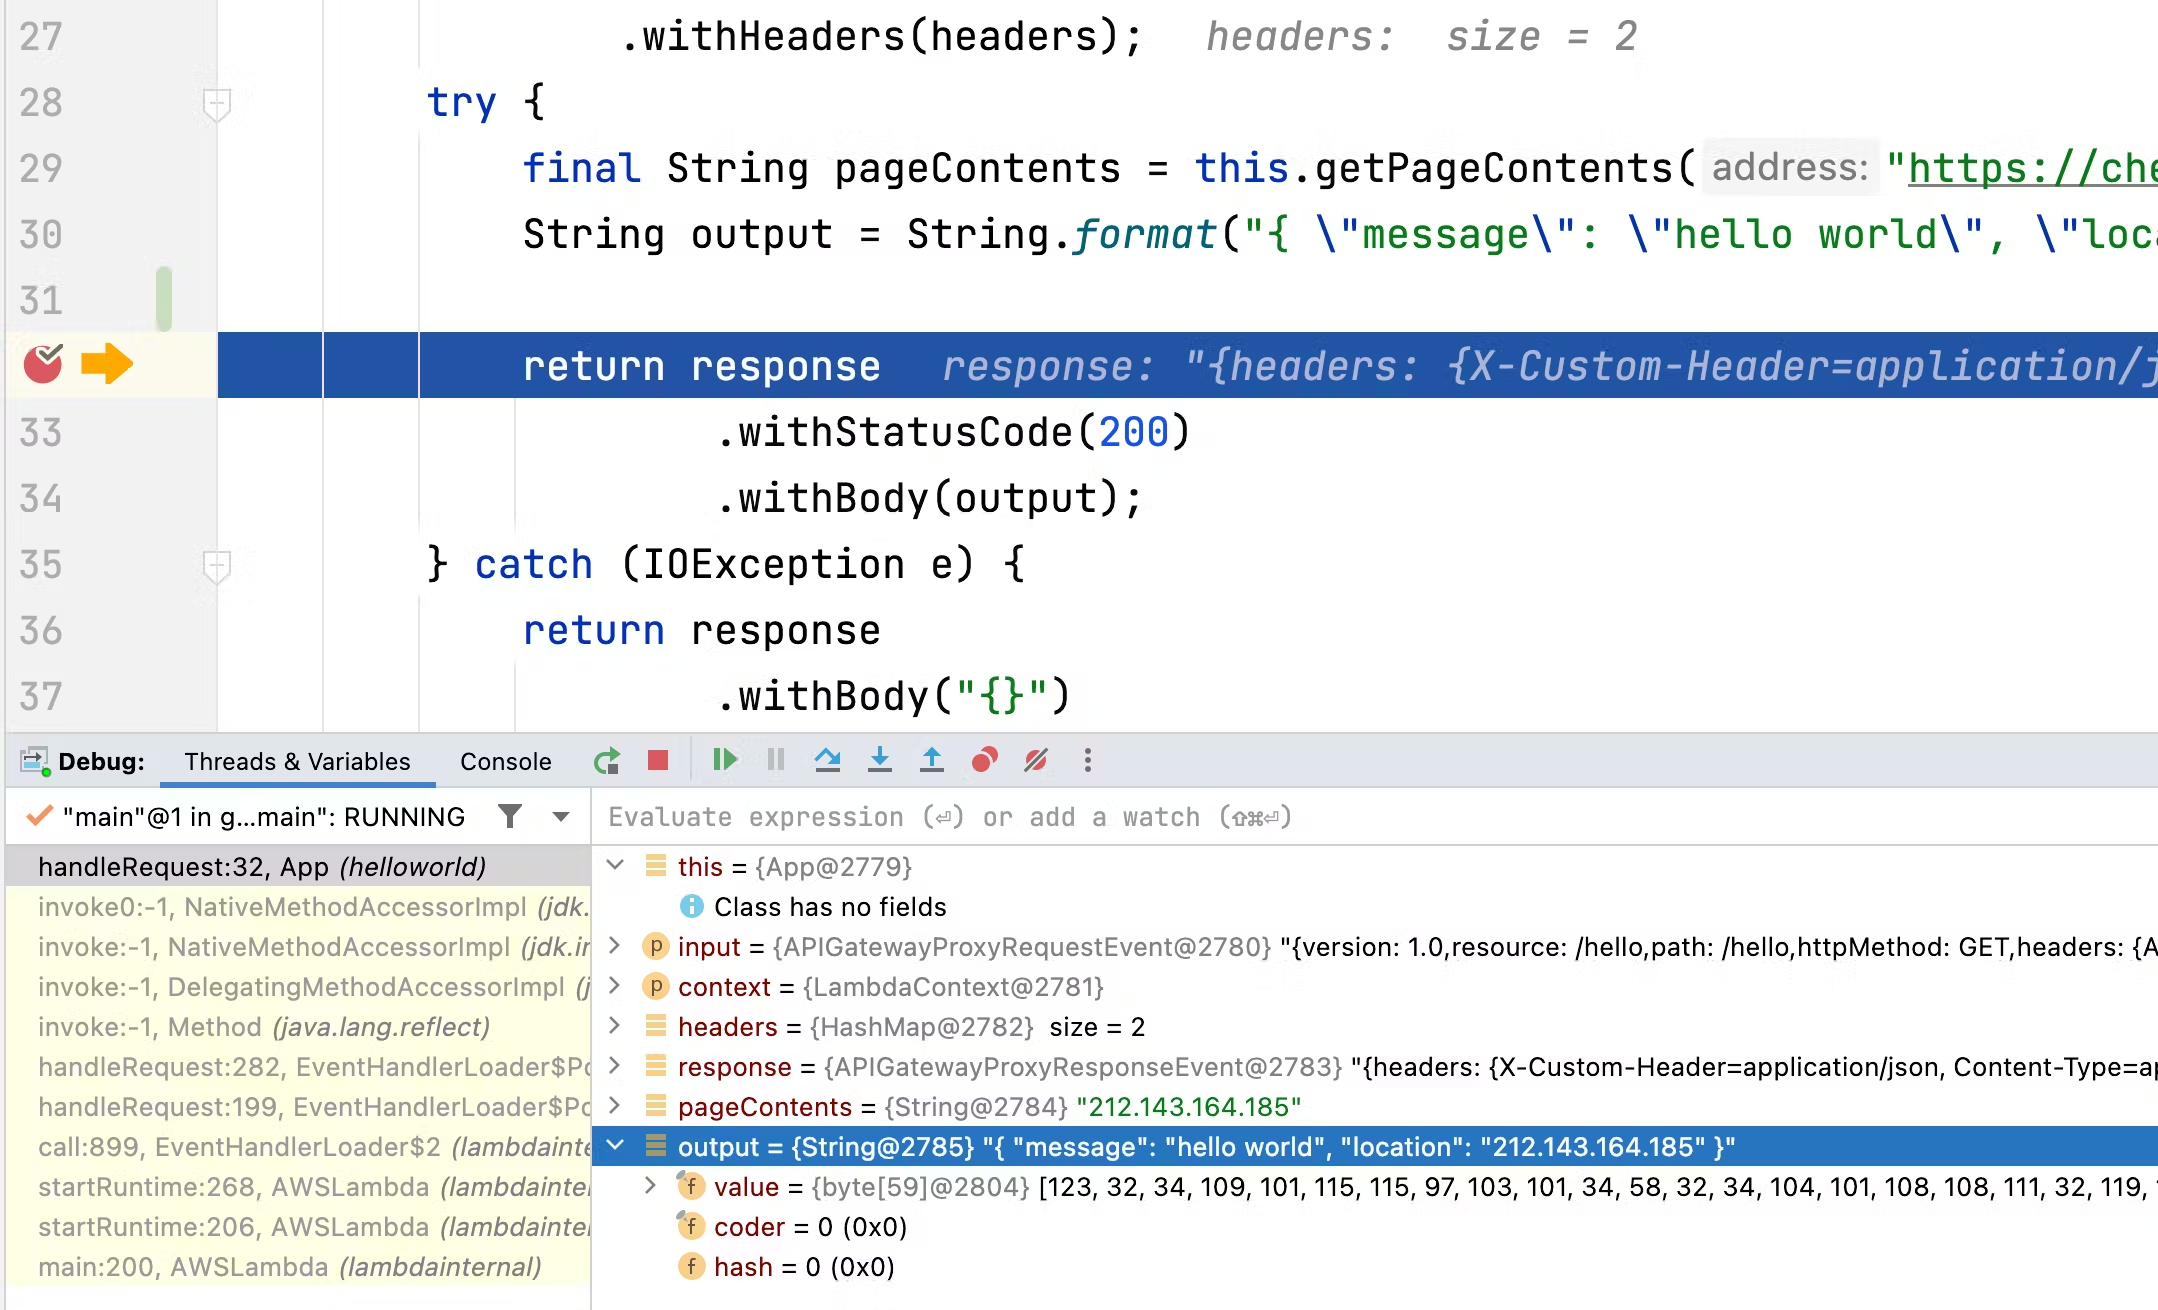
We can test this by invoking the endpoint, e.g., using curl. With the debugger connected, we would stop on the breakpoint like any other tool:
curl http://localhost:3000/helloThe application will pause at the breakpoints you set, allowing you to step through the code.
Handling Debugger Timeouts
One significant challenge when debugging Lambda functions is the quick timeout setting. Lambda functions are designed to execute quickly, and if they take too long, the costs can become prohibitive. By default, the timeout is set to a short duration, but you can configure this in the template.yaml file; e.g.:
Resources:
  HelloWorldFunction:
    Type: AWS::Serverless::Function
    Properties:
      Handler: app.lambdaHandler
      Timeout: 60  # timeout in seconds
After updating the timeout value, re-issue the sam build command to apply the changes.
In some cases, running the application locally might not be enough. You may need to simulate running on the actual AWS stack to get more accurate debugging information. Solutions like SST (Serverless Stack) or MerLoc can help achieve this, though they are specific to AWS and relatively niche.
Final Word
Serverless debugging requires a combination of strategies to effectively identify and resolve issues. While traditional debugging methods may not always apply, leveraging local debugging, feature flags, staged rollouts, comprehensive logging, idempotency, and IaC can significantly improve your ability to debug serverless applications. As the serverless ecosystem continues to evolve, staying adaptable and continuously updating your debugging techniques will be key to success.
Debugging serverless applications, particularly AWS Lambda functions, can be complex due to their distributed nature and the constraints of traditional debugging tools. However, by leveraging tools like AWS SAM, you can simulate the Lambda environment locally and use remote debugging to step through your code. Adjusting timeout settings and considering advanced simulation tools can further enhance your debugging capabilities.
Published at DZone with permission of Shai Almog. See the original article here.
Opinions expressed by DZone contributors are their own.
Comments