Monitoring and Observability in DevOps: How Top Digital Products Are Leveraging It
Explore how industry pioneers like Netflix, Uber, and Meta achieve digital triumph with cutting-edge monitoring and observability methods in DevOps.
Join the DZone community and get the full member experience.
Join For FreeIn DevOps, both monitoring and observability are critical.
Because it lets you maintain system reliability, diagnose problems, and enhance performance, effectively and efficiently.
For DevOps, this is the essence of monitoring and observability.
- Monitoring is for computers; observability is for people.
- Monitoring is about collecting data; observability is about making sense of it.
- Observability is about “why,” whereas monitoring is about “what.”
- Monitoring is necessary, but observability is indispensable.
- In the world of systems, monitoring is the starting point, but observability is the destination.
- Observability is the key to unlocking the mysteries of distributed systems.
How Top Digital Products Are Utilizing Observability and Monitoring for Engineering Excellence?
Observability and monitoring have become essential components in ensuring the reliability, performance, and scalability of digital products.
Here’s how top digital products are utilizing observability and monitoring.
Netflix
Streamlining eBPF Performance Optimization
Netflix recently announced the release of bpftop.
bpftop provides a dynamic real-time view of running eBPF programs. It displays the average runtime, events per second, and estimated total CPU % for each program.
This tool reduces overhead by allowing performance statistics only when in use.
Without bpftop, optimization tasks would demand manual computations, needlessly complicating the process.
But with bpftop, it’s easier. You can see where you’re starting from, make things better, and check if they actually got better, all without the extra hassle. (Source)
Improved Alerting With Atlas Streaming Eval
Netflix shifted its alerting system architecture from traditional polling-based methods to real-time streaming evaluation.
This transition was prompted by scalability issues when the number of configured alerts dramatically increased, causing delays in alert notifications.
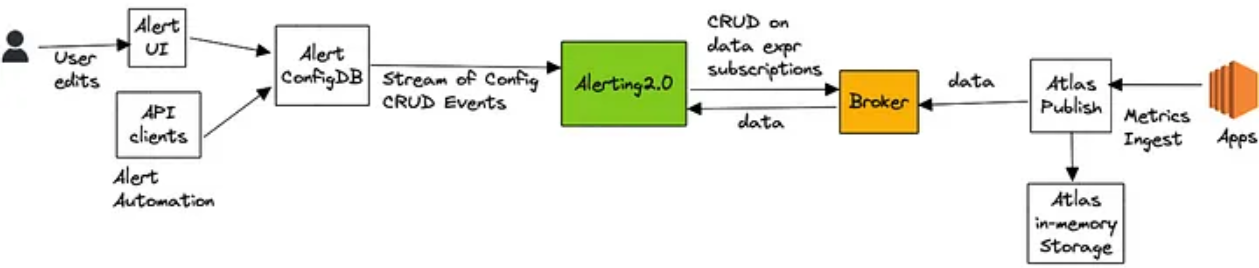
By leveraging streaming evaluation, Netflix overcame the limitations of its time-series database, Atlas, and improved scalability while maintaining reliability.
Key outcomes include accommodating a 20X increase in query volume, relaxing restrictions on high cardinality queries, and enhancing application health monitoring with correlations between SLI metrics and custom metrics derived from log data.
This shift opens doors to more actionable alerts and advanced observability capabilities, though it requires overcoming challenges in debugging and aligning the streaming path with database queries.
Overall, the transition showcases a significant advancement in Netflix’s observability infrastructure. (Source)
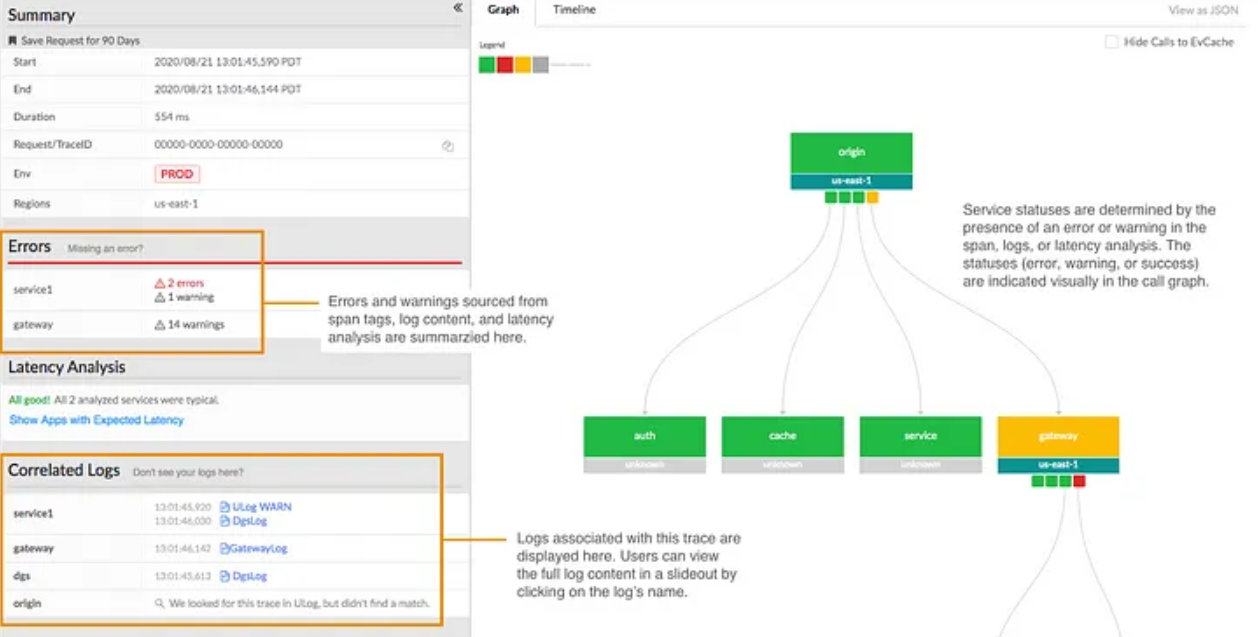
Building Netflix’s Distributed Tracing Infrastructure
Edgar, a distributed tracing infrastructure aimed at enhancing troubleshooting efficiency for streaming services.
Prior to Edgar, engineers at Netflix faced challenges in understanding and resolving streaming failures due to the lack of context provided by traditional troubleshooting methods involving metadata and logs from various microservices.
Edgar addresses this by providing comprehensive distributed tracing capabilities, allowing for the reconstruction of streaming sessions through the identification of session IDs.
Leveraging Open-Zipkin for tracing and Mantis for stream processing, Edgar enables the collection, processing, and storage of traces from diverse microservices.
Key components of Edgar include trace instrumentation for context propagation, stream processing for data sampling, and storage optimization for cost-effective data retention.
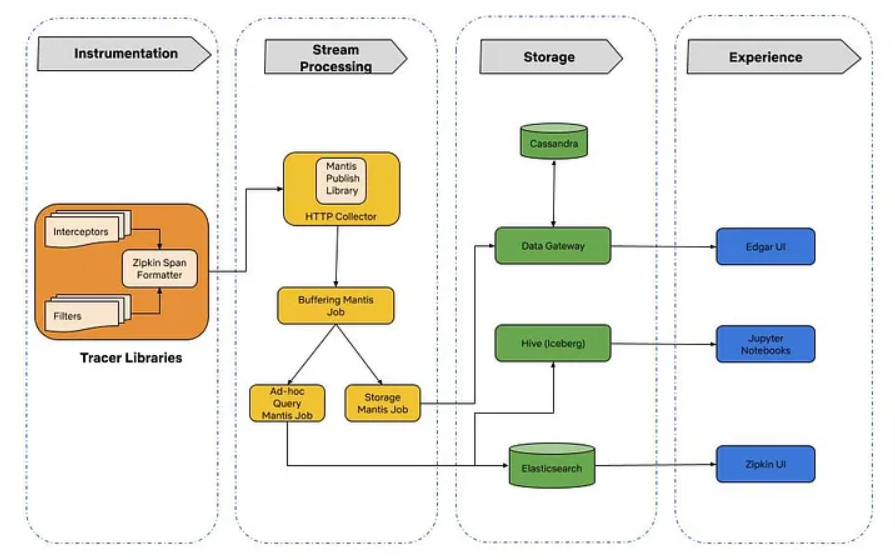
Through a hybrid head-based sampling approach and storage optimization strategies such as utilizing cheaper storage options and employing better compression techniques, Edgar optimizes resource utilization while ensuring efficient troubleshooting.
Additionally, Edgar’s trace data serves multiple use cases beyond troubleshooting, including application health monitoring, resiliency engineering, regional evacuation planning, and infrastructure cost estimation for A/B testing.
In essence, Edgar significantly improves engineering productivity by providing a streamlined and effective method for troubleshooting streaming failures at scale. (Source)
Uber
Observability at Scale: Building Uber’s Alerting Ecosystem
Uber’s alerting ecosystem is a vital component in maintaining the stability and scalability of its thousands of microservices.
The Observability team has developed two primary alerting systems: uMonitor, which focuses on metrics-based alerts, and Neris, which handles host-level infrastructure alerts.
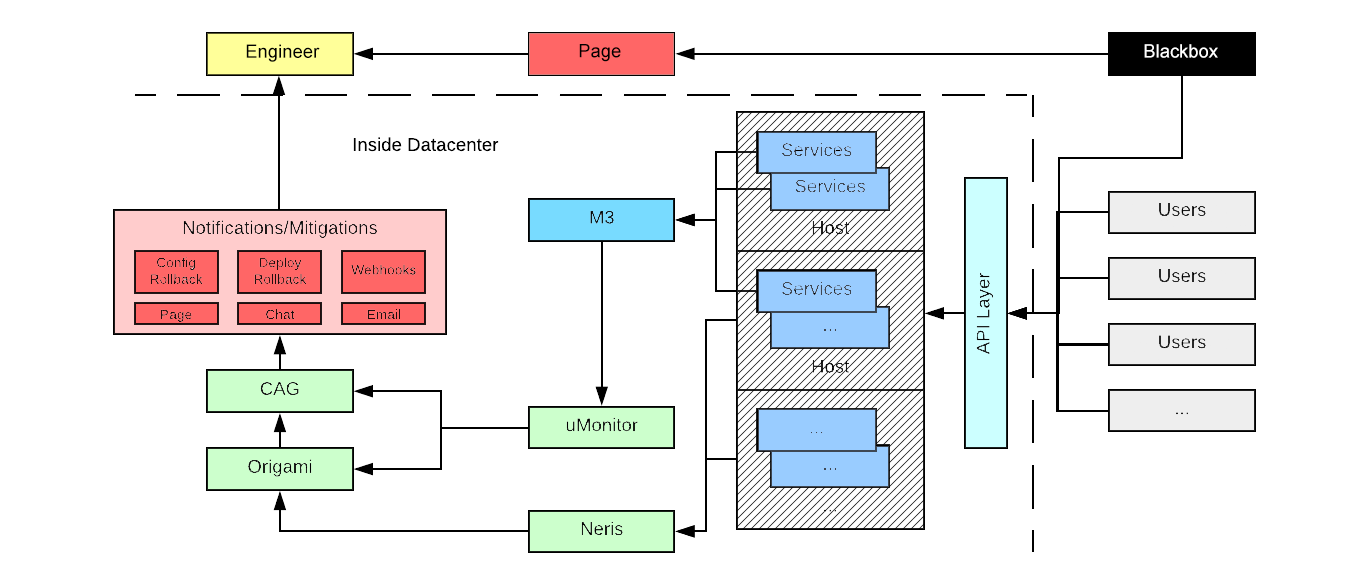
uMonitor operates on a flexible platform, allowing for easy alert management and diverse use cases, while Neris executes alert checks directly on hosts to efficiently handle high-resolution, high-cardinality metrics.
Handling the challenge of high cardinality is central to Uber’s alerting approach.
Origami, the deduplication and notification engine, assists in managing alerts by consolidating notifications and allowing for alert aggregation based on various criteria such as city, product, or app version.
This helps in reducing noise and providing relevant alerts to engineers.
Overall, Uber’s alerting ecosystem is tailored to handle the scale and complexity of its infrastructure, with a focus on flexibility, scalability, and relevance of notifications. (Source)
Uber’s Big Data Observability and Chargeback Platform
Uber’s data infrastructure is composed of a wide variety of compute engines, execution solutions, and storage solutions.
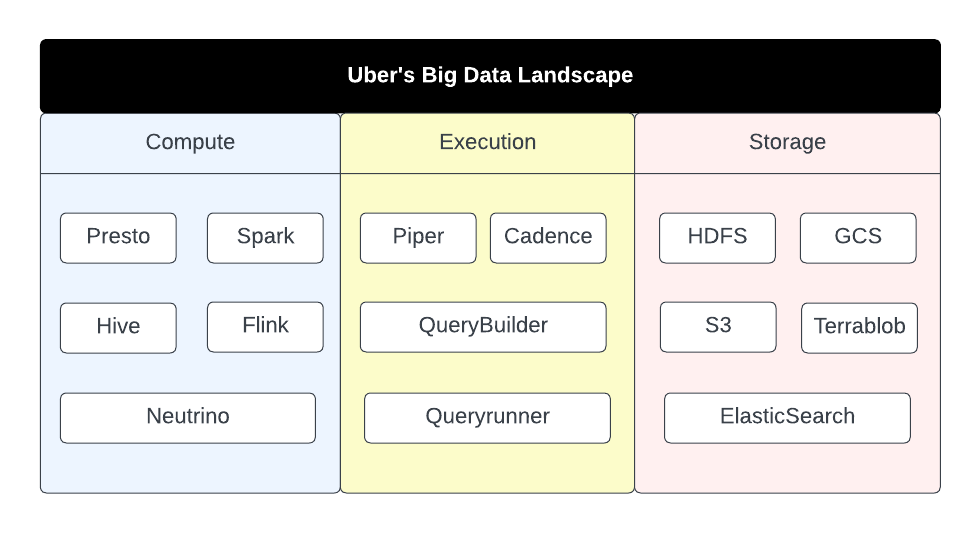
With such a complex and diverse data infrastructure, it’s quite challenging to provide stakeholders with a holistic view of performance and resource consumption across various compute engines and storage solutions.
And this is when DataCentral comes into the picture.
It’s a comprehensive platform to provide users with essential insights into big data applications and queries.
DataCentral helps data platform users by offering detailed information on workflows and apps, enhancing productivity, and reducing debugging time.
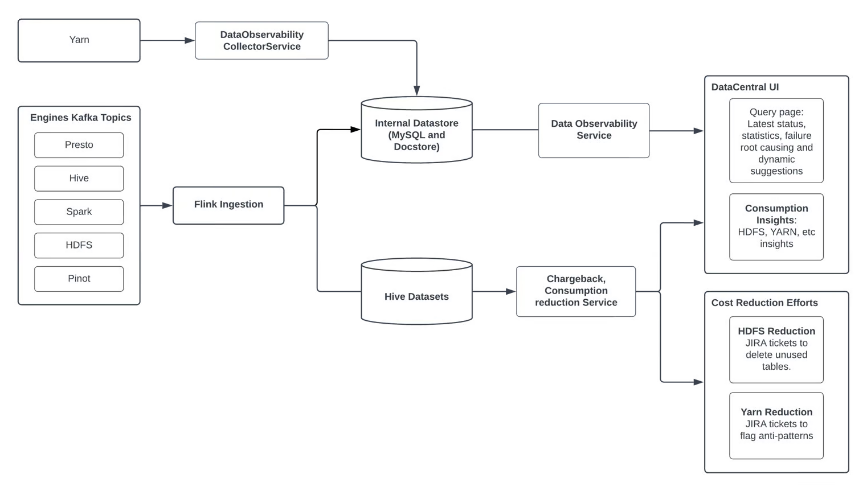
The following are the key features of DataCentral.
Observability
It provides granular insights into performance trends, costs, and degradation signals for big data jobs.
Furthermore, DataCentral offers historical trends for metrics like costs, duration, efficiency, data read/written, and shuffle, enabling faster detection and debugging of applications.
Chargeback
It tracks metrics and resource usage for big data tools and engines such as Presto, Yarn, HDFS, and Kafka, allowing stakeholders to understand costs at various granularities like user, pipeline, application, schedule, and queue level.
Consumption Reduction Programs
DataCentral powers cost reduction initiatives by providing insights into expensive pipelines, continuously failing workloads, and unnecessary computing.
Contactless
A system aimed at efficiently troubleshooting failed queries and applications by improving error discoverability, identifying root causes, and providing user-friendly explanations and suggestions.
It matches exception traces against rules set by engine teams to surface relevant messages. (Source)
Asicmon: A Platform Agnostic Observability System for AI Accelerators
Accelerators are like specialized tools for specific jobs, such as AI tasks or video work.
They’re super helpful in making things faster and more energy-efficient, especially in Facebook’s data centers.
But handling all these different tools efficiently at a big scale is tough.
To tackle these obstacles, Facebook introduced three innovative tools.
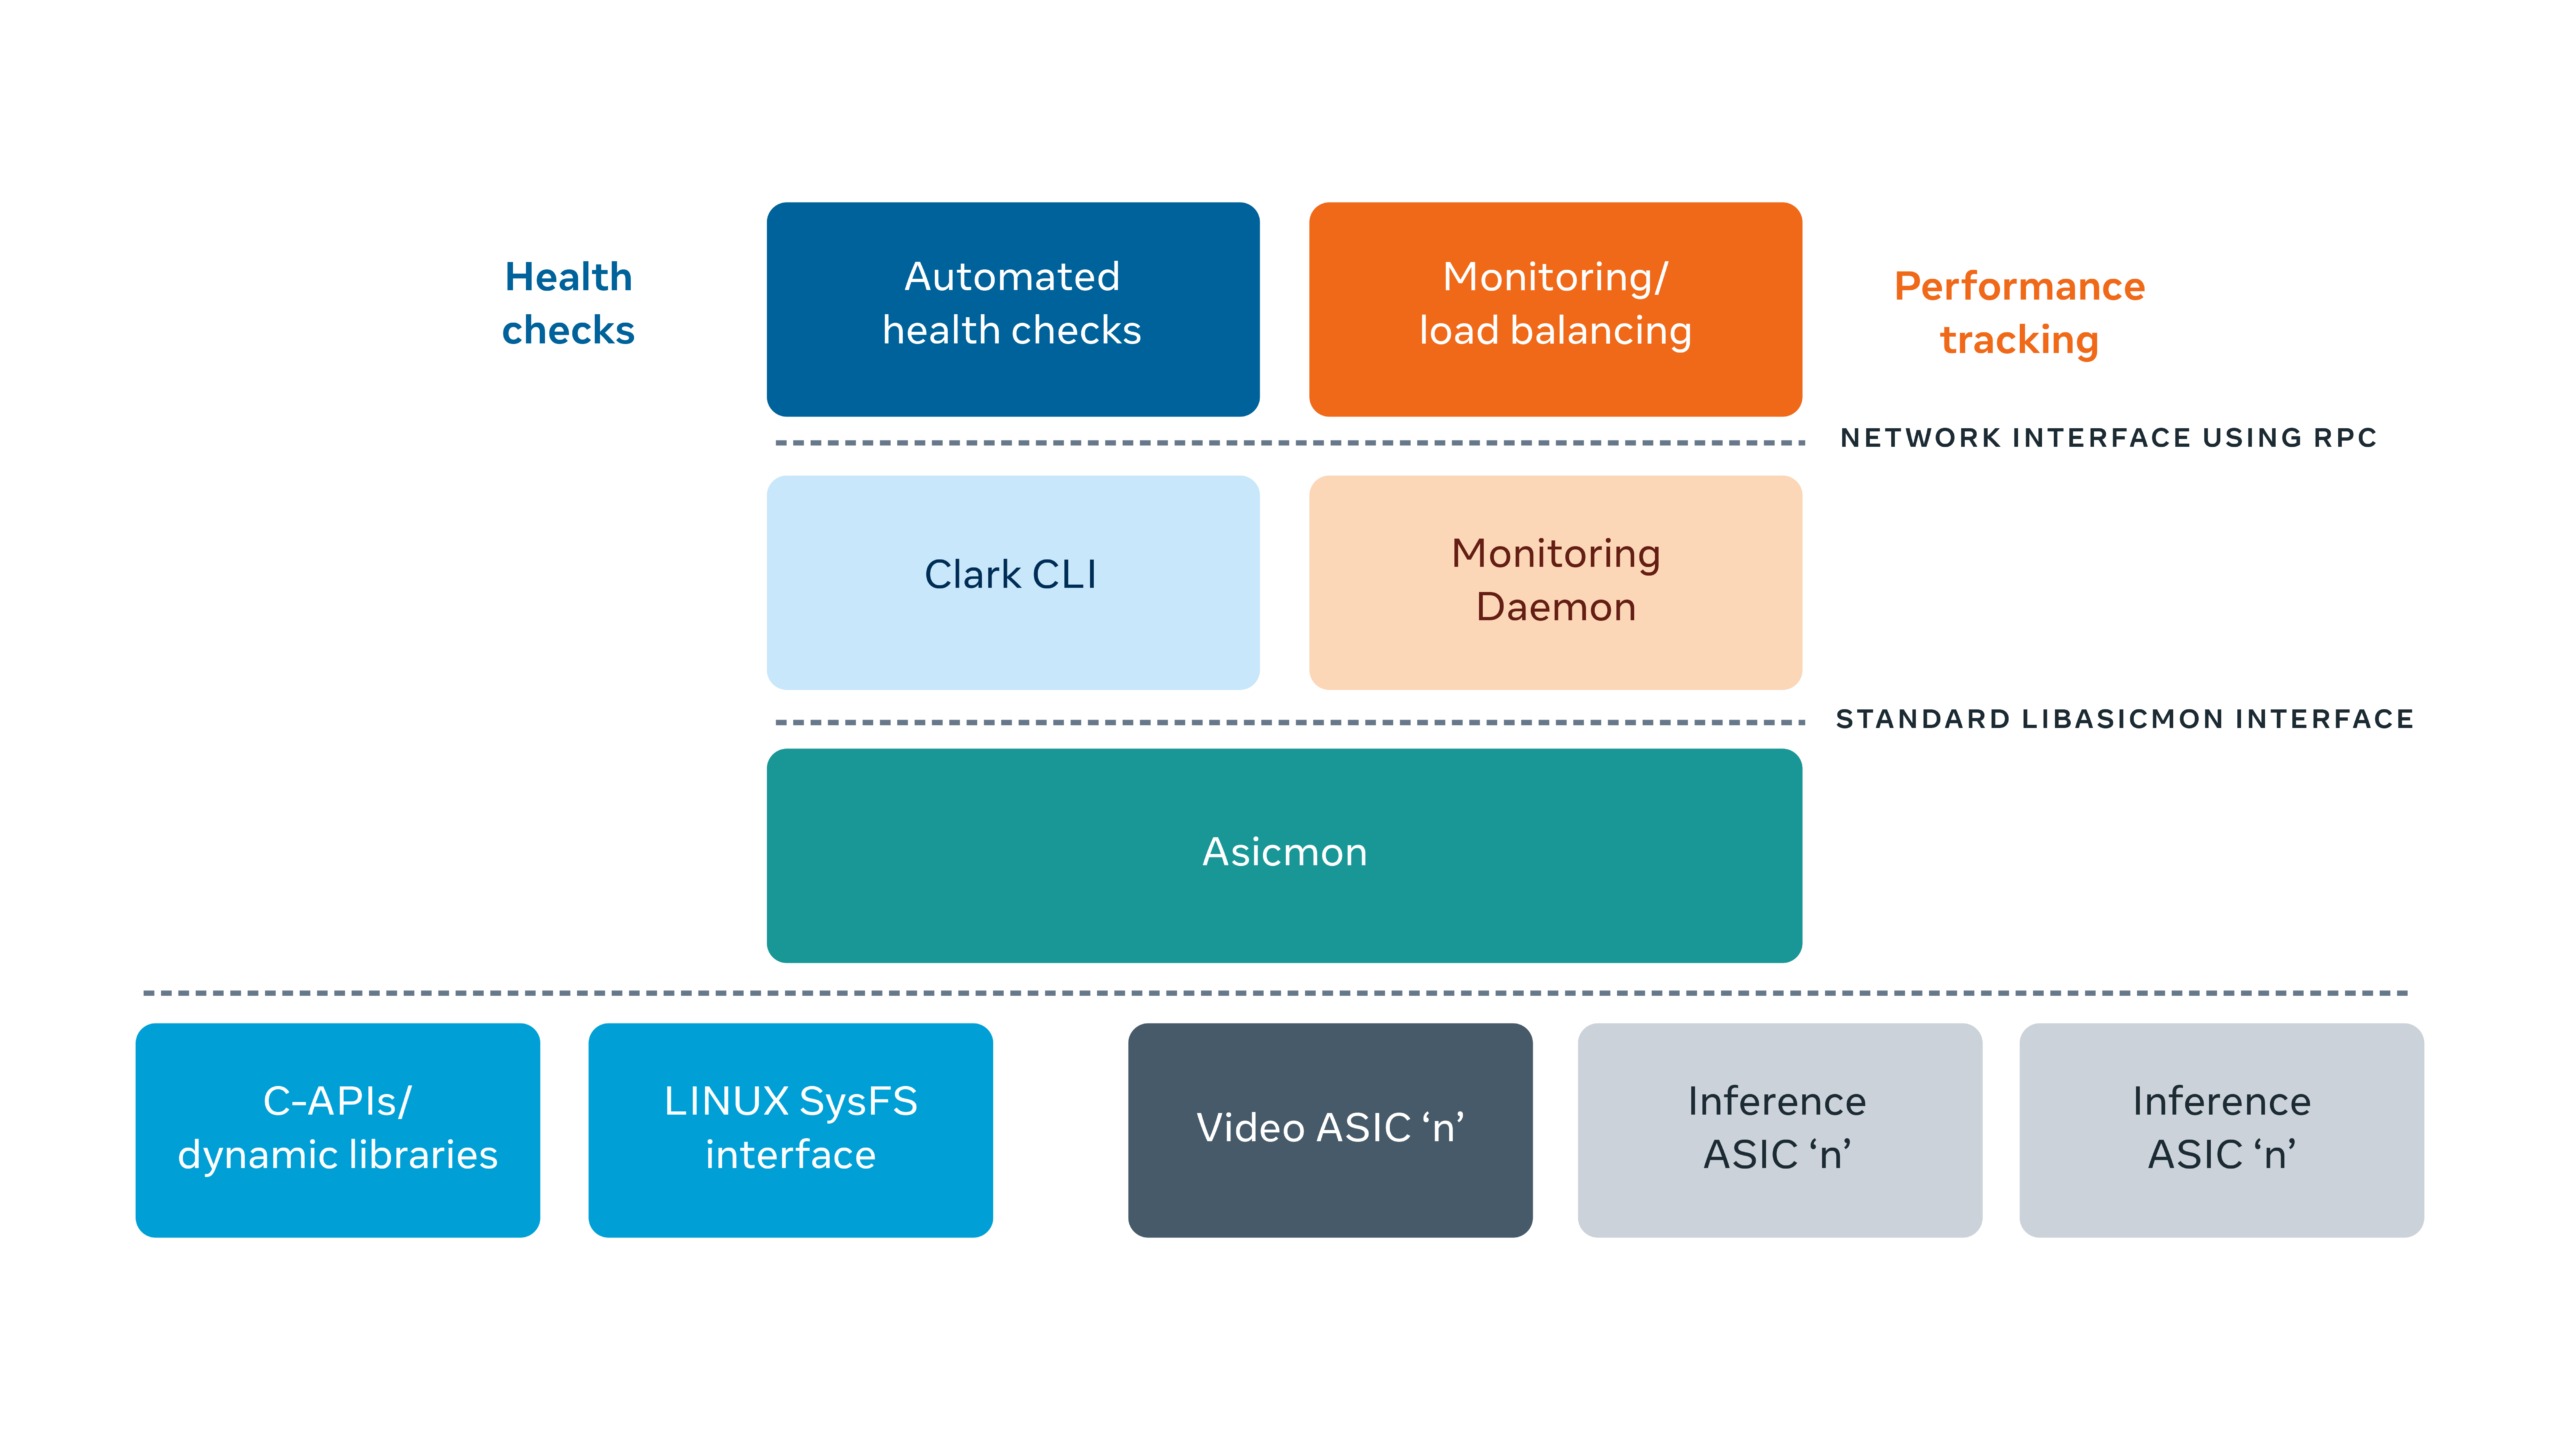
Asicmon (ASIC Monitoring)
This scalable observability framework abstracts custom interfaces of accelerators, offering a standardized interface to internal tools.
Asicmon facilitates load balancing, performance monitoring, and automated health checks for the multitude of accelerators deployed across Facebook data centers.
Asimov
It’s a bespoke specification language streamlining the development and rapid prototyping of new accelerators.
By reducing the onboarding time for a new accelerator from a month to under a week, Asimov significantly accelerates the innovation cycle.
Atrace
An accelerator tracing solution that remotely collects traces on production servers.
Atrace enables in-depth inspection of accelerator systems, providing actionable trace summaries and analyses.
In an initial deployment, Atrace helped narrow a 10 percent performance gap between Caffe2 and PyTorch implementations of a large AI model.
Here is the diagram of how Asicmon acts as a bridge between individual accelerator drivers and the rest of the internal monitoring software. (Source)
Published at DZone with permission of Pritesh Patel. See the original article here.
Opinions expressed by DZone contributors are their own.
Comments