Monitoring Application Performance on the Frontend in the Age of Impatience
As technology evolves, so then do customer expectations of how that technology should perform. Find out some tools to keep your frontend quick here.
Join the DZone community and get the full member experience.
Join For FreeKeep Your Users Happy and Monitor Your Performance
Monitoring application performance in the browser is often overlooked or ignored until an actual problem arises. We prioritize server-side monitoring and collecting metrics on all our different databases, but often let tracking of website performance fall to the wayside. Yet internet users these days are more impatient than ever, expecting unique and interactive design on top of light-speed load times. We are expected to deliver a consistent user experience across the globe and to an array of increasingly varied devices.
As we continue to add more complex design to our web applications and increase our chances that things will go wrong somewhere (sorry to be the pessimist here), it's in our best interest to keep track of specific performance metrics to better diagnose and solve problems as they do arise (as we can be sure they most certainly will).

The age of impatience
Optimizing Your Performance
Ideally, one would take performance considerations into account while planning and building out an application through a more proactive approach and before the application gets too large and complex and more difficult to refactor. We can make our applications more performant from the start by such methods as reducing render-blocking assets and network requests, image optimization and lazy-loading, minification of HTML, CSS, and JS files, caching, deferment of non-critical assets, and making use of a content-delivery network (CDN). Nevertheless, we should still continue to track our frontend code as it evolves and grows.
There are a number of tools available to help you out with monitoring browser performance, including Google's Page Speed and Analytics, Yahoo's YSlow, WebPagesTest, Audits within the Chrome DevTools, Performance by Firefox, and Timeline by Safari. These tools are great and by no means deficient, but seeing as how we will be tracking performance over time, why not use a Time Series Database to collect and store performance metrics over a long period of time? In doing so, you will be able to compare and analyze performance data over time in addition to having the capability to troubleshoot problems as they happen or speedily pinpoint error causality.
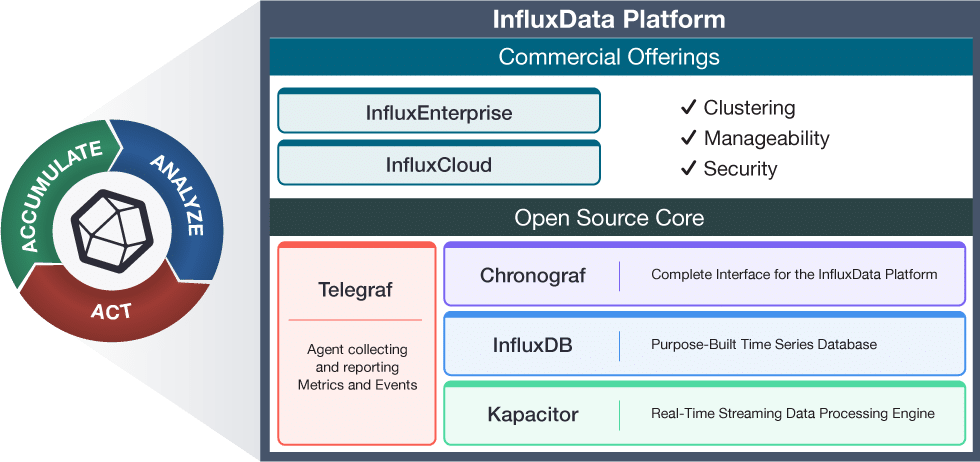
The TICK Stack
Our Approach
At InfluxData, we recently started collecting and tracking our own webpage metrics and visualizing them within Chronograf. Chronograf is the user interface component of the TICK Stack and allows us to visualize our data quickly and efficiently. For getting up and running with Chronograf, see the Getting Started with Chronograf Guide. In this instance, we are collecting information on any JavaScript errors that are thrown when a user visits the site and then storing them within InfluxDB.
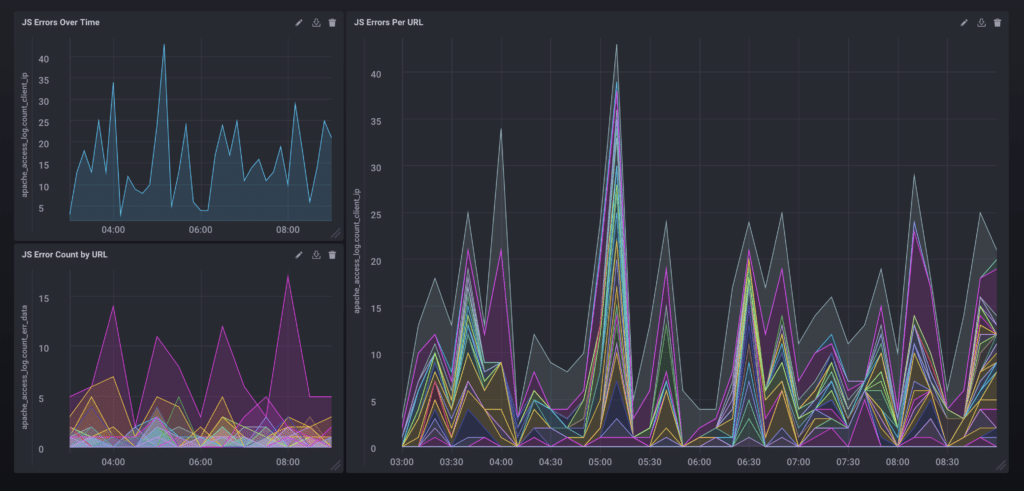
JS Error Count Over Time
As we track errors over time, we can monitor whether there are dips and spikes in errors thrown, we can ascertain performance ratings based on different browsers, and we can see specifically which errors are getting thrown most frequently and thus make efforts to find and fix those errors. There are, of course, a number of other metrics to collect and keep an eye on, as you can see in the list below:
- Time to Title
- Time to Start Render
- Time to Interact
- DNS Lookup Time
- Connection Time
- Times to First and Last Byte
- Overall Weight and Asset Count
- Error and Bounce Rates
Summary
Performance is integral to the experience your users take away from your website and can keenly affect user perception. A wide variety of tools and techniques are available to measure, collect, and manage performance metrics from the initial stages of the development process and all throughout. We like and use InfluxDB for our monitoring purposes, but no matter the tool you choose, it's important to positively impact the user journey by monitoring and improving the frontend performance of your web application.
Published at DZone with permission of Margo Schaedel. See the original article here.
Opinions expressed by DZone contributors are their own.
Comments