Monitoring Spring Boot Applications With Prometheus and Grafana
At my current project we've been building three different applications. All three applications are based on Spring Boot, but have very different workloads. T...
Join the DZone community and get the full member experience.
Join For FreeAt my current project, we've been building three different applications. All three applications are based on Spring Boot but have very different workloads. They've all reached their way to the production environment and have been running steadily for quite some time now. We do regular (weekly basis) deployments of our applications to production with bug fixes, new features, and technical improvements. The organisation has a traditional infrastructure workflow in the sense that deployments to the VM instances on acceptance and production happen via the (remote hosting) provider.
The hosting provider is responsible for the uptime of the applications and therefore they keep an eye on system metrics through the usage of their own monitoring system. As a team, we are able to look in the system, but it doesn't say much about the internals of our application. In the past, we've asked to add some additional metrics to their system, but the system isn't that easy to configure with additional metrics. To us as a team runtime statistics about our applications and the impact our changes have on the overall health are crucial to understanding the impact of our work.
Spring Boot Actuator and Micrometer
If you've used Spring Boot before you've probably heard of Spring Boot Actuator. Actuator is a set of features that help you monitor and manage your application when it moves away from your local development environment and onto a test, staging or production environment. It helps expose operational information about the running application - health, metrics, audit entries, scheduled task, env settings, etc. You can query the information via either several HTTP endpoints or JMX beans. Being able to view the information is useful, but it's hard to spot trends or see the behaviour over a period of time.
In our project, we're using Spring Boot 2 and my team was pretty excited that we were able to start using Micrometer, an instrumentation library powering the delivery of application metrics. Micrometer is the default metrics library in Spring Boot 2 and it doesn't just give you metrics from your Spring application, but can also deliver JVM metrics (garbage collection and memory pools, etc) and also metrics from the application container. Micrometer has several different libraries that can be included to ship metrics to different backends and has support for Prometheus, Netflix Atlas, CloudWatch, Datadog, Graphite, Ganglia, JMX, Influx/Telegraf, New Relic, StatsD, SignalFx, and Wavefront.
Because we didn't have a lot of control over the way our applications were deployed we looked at the several different backends supported by a micrometer. Most of the above backends work by pushing data out to a remote (cloud service). Since the organisation we work for doesn't allow us to push this 'sensitive' data to a remote party we looked at self-hosted solutions. We started with looking into Prometheus (and Grafana) and we soon learned that it was really easy to get a monitoring system up and running within an hour. In the rest of this post, I'll show you how easy it is to start monitoring Spring Boot applications with Prometheus and Grafana.
Prometheus
Prometheus is an open-source system monitoring and alerting toolkit originally built at SoundCloud and now part of the Cloud Native Computing Foundation. Some of the features that appealed to us were:
- No reliance on distributed storage; single server nodes are autonomous.
- Time-series collection happens via a pull model over HTTP.
- Targets are discovered via service discovery or static configuration.
- Multiple modes of graphing and dashboarding support.
Prometheus uses a file called prometheus.yml as its main configuration file. Within the configuration file, you can specify where it can find the targets it needs to monitor, specify recording rules and alerting rules.
The following example shows a configuration with a set of statics targets for test and staging environments. You can decide to monitor all environments within one Prometheus instance, but you could of course also use a separate Prometheus instance for monitoring just the production environment.
xxxxxxxxxx
global
scrape_interval10s # By default, scrape targets every 10 seconds.
# Attach these labels to any time series or alerts when communicating with
# external systems (federation, remote storage, Alertmanager).
external_labels
monitor'appteam-monitor'
scrape_configs
job_name'applicationX'
# Override the global default and scrape targets from this job every 15 seconds.
scrape_interval15s
# Path can be different depending on your Spring Boot configuration
metrics_path'/actuator/prometheus'
schemehttps
# Disable tls check due to self signed certificates
tls_config
insecure_skip_verifytrue
static_configs
targets'api1.test.somedomain.com'
labels
group'test'
application'app1'
targets'api1.staging.somedomain.com''api2.staging.somedomain.com'
labels
group'staging'
application'app1'
As you can see the configuration is pretty simple. You can add specific labels to the targets which can, later on, be used for querying, filtering, and creating a dashboard based upon the information stored within Prometheus. If you want to get started quickly with Prometheus and have Docker on your environment you can use the official docker Prometheus image by running the following command and provide a custom configuration from your host machine by running:
x
$ docker run -p 9090:9090 -v /tmp/prometheus.yml:/etc/prometheus/prometheus.yml prom/prometheus:v2.24.1
In the above example, we bind-mount the main Prometheus configuration file from the host system.
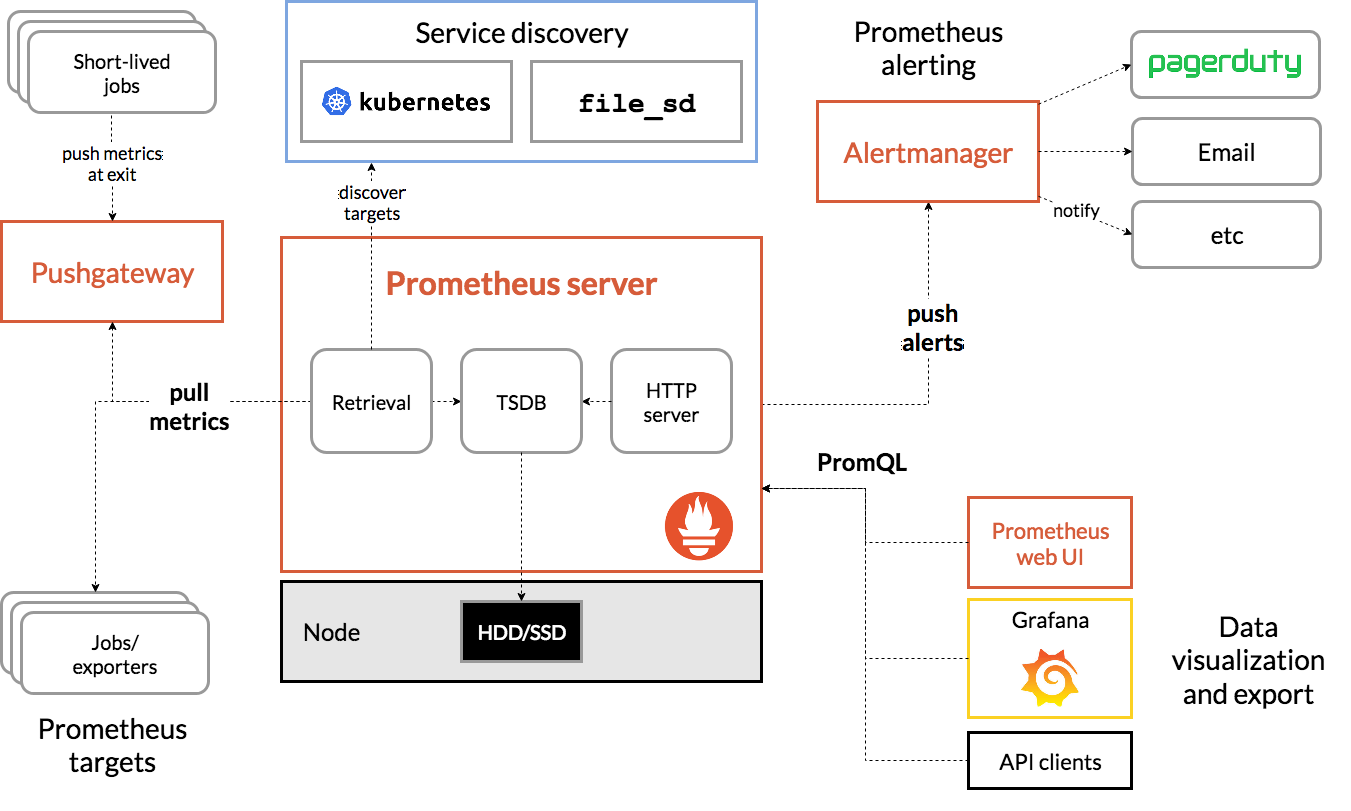
To get an overview of the toolset surrounding Prometheus, take a look at the following diagram.
Grafana
So what is Grafana and what role does it play in our monitoring stack?
Grafana allows you to query, visualize, alert on and understand your metrics no matter where they are stored. Create, explore, and share dashboards with your team and foster a data-driven culture.
The cool thing about Grafana is (next to the beautiful UI) that it's not tied to Prometheus as its single data source like for instance Kibana is tied to Elasticsearch. Grafana can have many different data sources like AWS Cloudwatch, Elasticsearch, InfluxDB, Prometheus, etc. This makes it a very good option for creating a monitoring dashboard. Grafana talks to Prometheus by using the PromQL query language.
For Grafana there is also an official Docker image available for you to use. You can get Grafana up and running with a simple command.
x
$ docker run -p 3000:3000 grafana/grafana:5.4.3
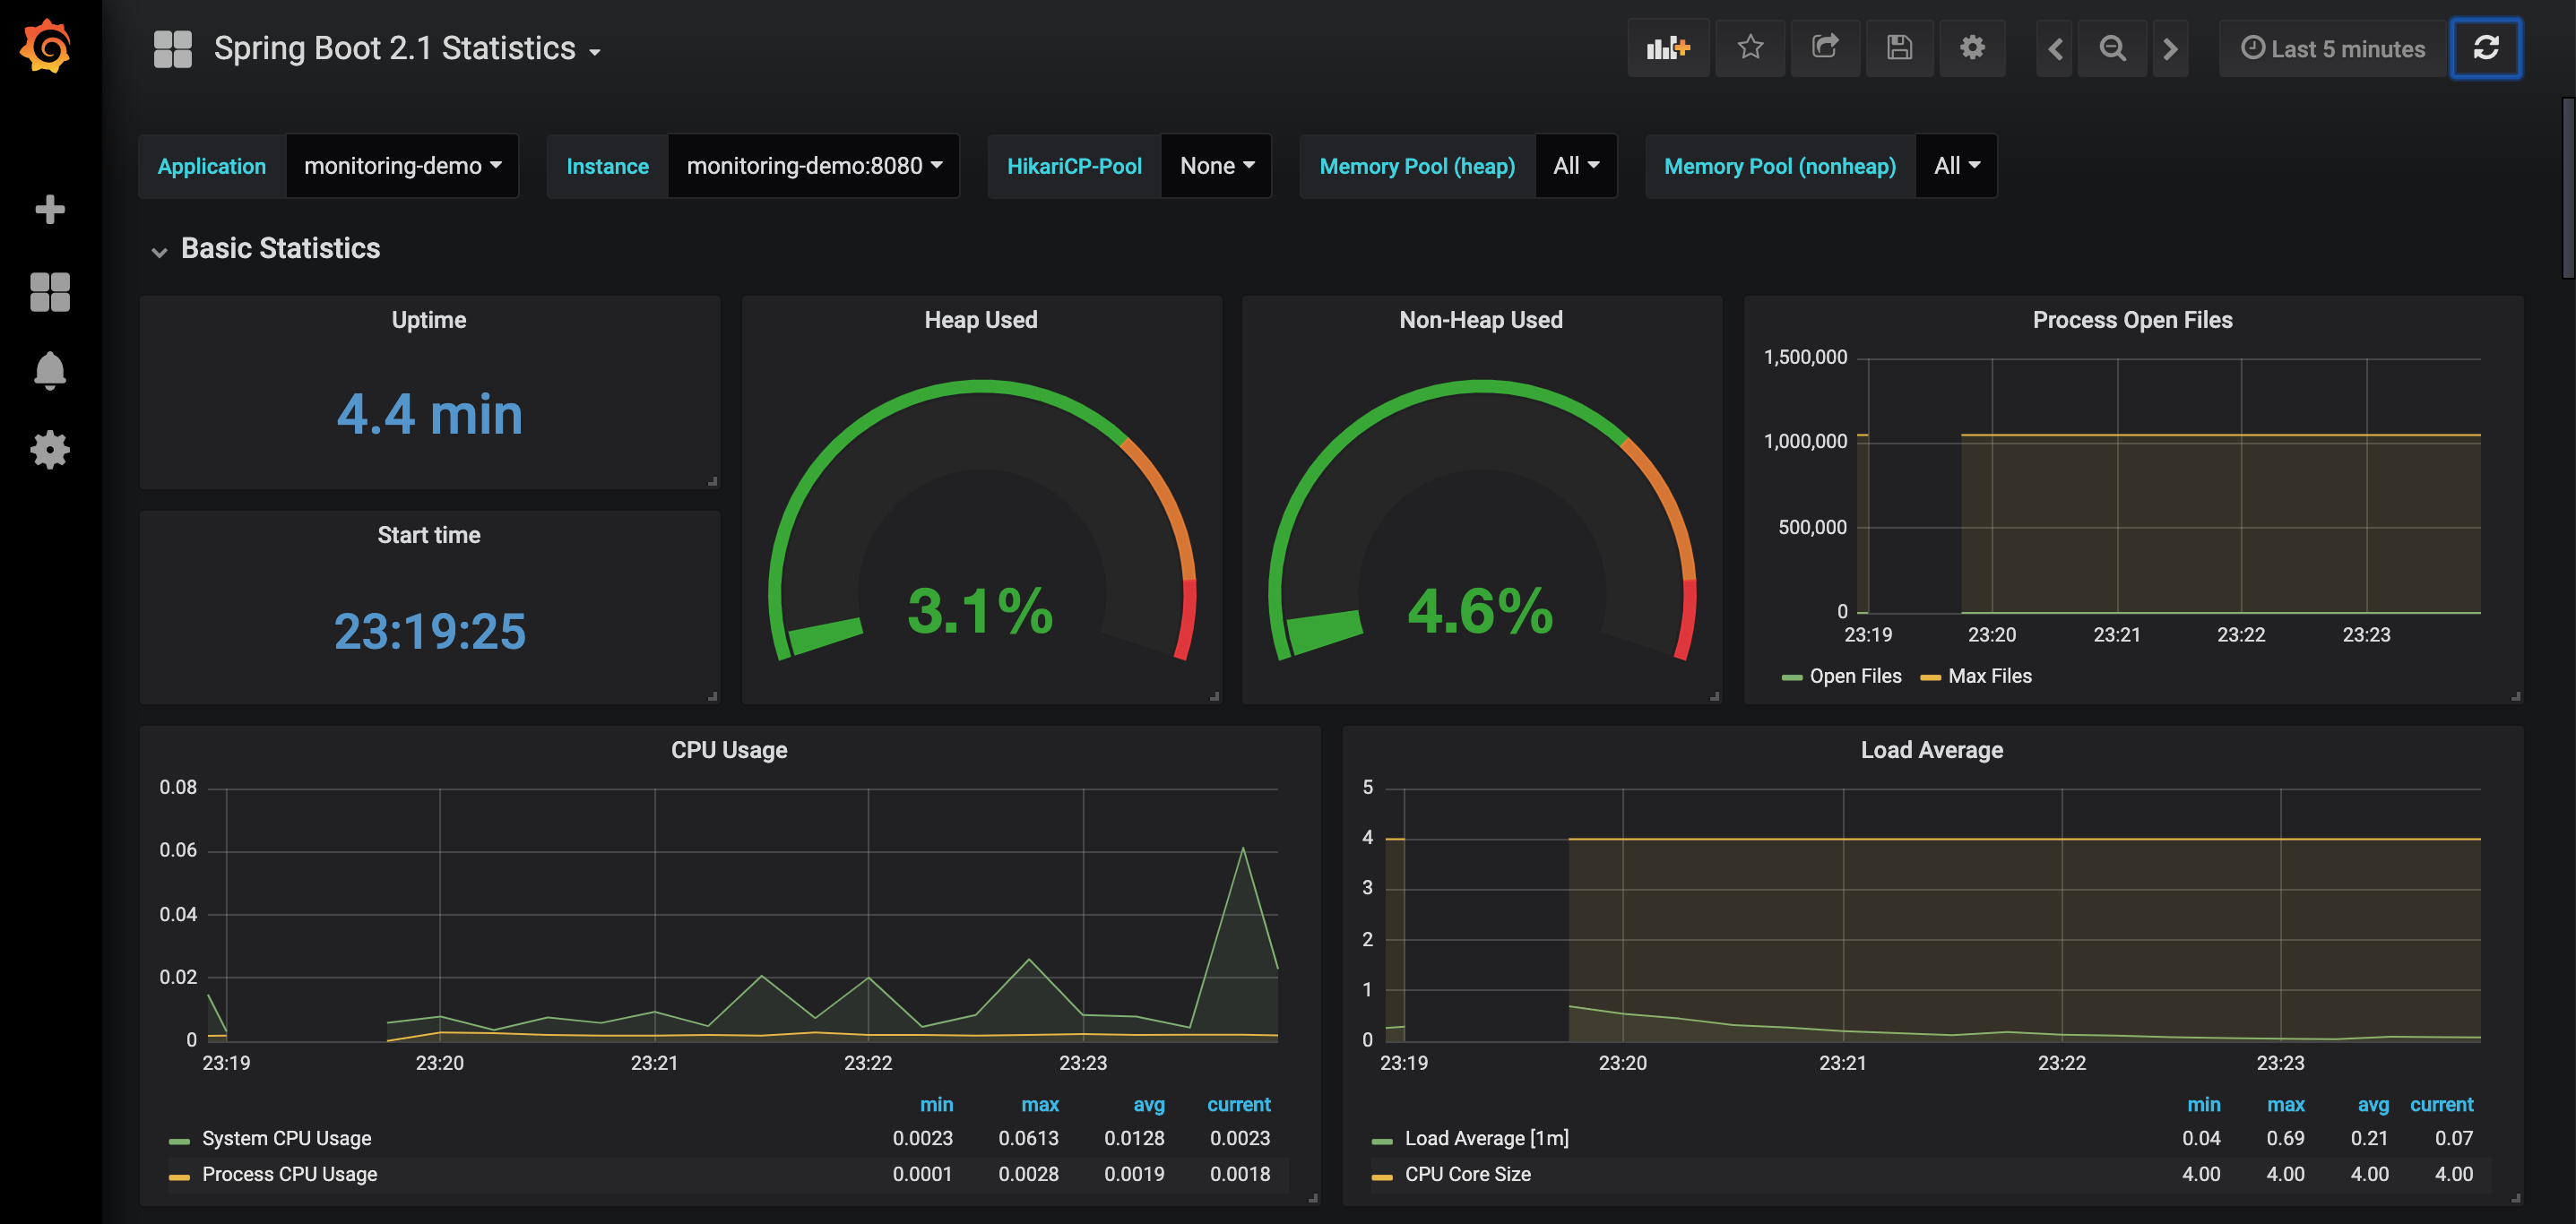
Now if we connect Grafana with Prometheus as the data source and install this excellent JVM Micrometer dashboard into Grafana we can instantly start monitoring our Spring Boot application. You will end up with a pretty mature dashboard that lets you switch between different instances of your application.
If you want to start everything all at once you can easily use docker-compose.
x
version"3"
services
app
imagemonitoring-demolatest
container_name'monitoring-demo'
build
context./
dockerfileDockerfile
ports
'8080:8080'
prometheus
imageprom/prometheusv2.24.1
container_name'prometheus'
volumes
./monitoring/prometheus/:/etc/prometheus/
ports
'9090:9090'
grafana
imagegrafana/grafana5.4.3
container_name'grafana'
ports
'3000:3000'
volumes
./monitoring/grafana/provisioning/:/etc/grafana/provisioning/
env_file
./monitoring/grafana/config.monitoring
depends_on
prometheus
I've put together a small demo project, containing a simple Spring Boot application and the above Prometheus configuration, in a GitHub repository for demo and experimentation purposes. Now if you want to generate some statistics run a small load test with JMeter or Apache Bench. Feel free to use/fork it!
Published at DZone with permission of Jeroen Reijn. See the original article here.
Opinions expressed by DZone contributors are their own.
Comments