Monitoring SpringBoot2 Metrics with HertzBeat
Use the open-source real-time monitoring tool HertzBeat to monitor and alarm the SpringBoot2 application, and it will be done in five minutes!
Join the DZone community and get the full member experience.
Join For FreeUse the open-source real-time monitoring tool HertzBeat to monitor and alarm the SpringBoot2 application, and it will be done in five minutes!
HertzBeat Intro
HertzBeat is an open-source, real-time monitoring tool with custom-monitor and agentLess.
Monitor+Alerter+Notify all in one. Support monitoring web service, database, os, middleware, cloud-native, network, and more. More flexible threshold rule(calculation expression), timely notification delivery by Discord Slack Telegram Email DingDing WeChat FeiShu Webhook SMS.
We make protocols such as Http, Jmx, Ssh, Snmp, Jdbc configurable, and you only need to configure YML online to collect any metrics you want. Do you believe that you can immediately adapt a new monitoring type, such as K8s or Docker, just by configuring online?
HertzBeat's powerful custom-define, multi-type support, easy expansion, and low coupling hope to help developers and micro teams quickly build their own monitoring system.
Monitoring SpringBoot2 Metrics With HertzBeat in 5 Minutes
A prerequisite is that you already have the SpringBoot2 application environment and HertzBeat environment.
The actuator Indicator Endpoint Is Exposed on the SpringBoot2 Application Side, Which Will Provide Metrics Endpoints Data
-
Open SpringBoot Actuator Endpoint to expose metrics health envindicator interface
management:
   endpoints:
     web:
       exposure:
         include:
           - 'metrics'
           - 'health'
           - 'env'
enabled-by-default: on-
After restarting, test whether the access indicator interface ip:port/actuatorhas response JSON data as follows:
{
   "_links": {
     "self": {
       "href": "http://localhost:1157/actuator",
       "templated": false
     },
     "health-path": {
       "href": "http://localhost:1157/actuator/health/{*path}",
       "templated": true
     },
     "health": {
       "href": "http://localhost:1157/actuator/health",
       "templated": false
     },
     "env": {
       "href": "http://localhost:1157/actuator/env",
       "templated": false
     },
     "env-toMatch": {
       "href": "http://localhost:1157/actuator/env/{toMatch}",
       "templated": true
     },
     "metrics-requiredMetricName": {
       "href": "http://localhost:1157/actuator/metrics/{requiredMetricName}",
       "templated": true
     },
     "metrics": {
       "href": "http://localhost:1157/actuator/metrics",
       "templated": false
     }
   }
Add SpringBoot2 Application Monitoring in the Hertzbeat Monitoring UI
-
Click to add SpringBoot2 monitoring
Path: Menu -> Application Service Monitoring -> SpringBoot2 -> Add SpringBoot2 Monitoring

-
Configure the parameters required for new monitoring SpringBoot2
Fill in the SpringBoot2 application peer IP, service port (default 8080), an account password, etc., on the monitoring page, and finally click OK to add. For other parameters, such as collection interval, timeout period, etc., please refer to the help document.

-
Complete now. We have added the monitoring of the SpringBoot2 application. Check the monitoring list to see our additions.

-
Click Operation->Monitoring Details Icon of the monitoring list item to browse the real-time monitoring indicator data of the SpringBoot2 application.

-
Click Monitoring History Details TAB to browse the historical monitoring indicator data chart of the SpringBoot2 application.

DONE! Done! It doesn't require us to deploy agents or various cumbersome operations. Isn't it very simple? Just one step to configure the IP port on the HertzBeat monitoring page and add SpringBoot2 application monitoring.
Through the above, we have completed the monitoring of the SpringBoot2 application. We can check the status and availability of various indicators of the SpringBoot2 application at any time in HertzBeat.
Of course, it is impossible to manually check the indicators in real-time. Monitoring is often accompanied by alarm thresholds. When the performance indicators of the SpringBoot2 application exceed our threshold or the SpringBoot2 application itself is abnormal, we can promptly notify our corresponding person in charge. The person in charge receives the notification and handles it. This is a complete monitoring and alarm process.
Next, we will demonstrate step by step how to configure the threshold alarm notification in the HertzBeat system. When the indicators of the SpringBoot2 application are abnormal, we will be notified in time
Add SpringBoot2 Application Indicator Threshold Alarm in Hertzbeat System
-
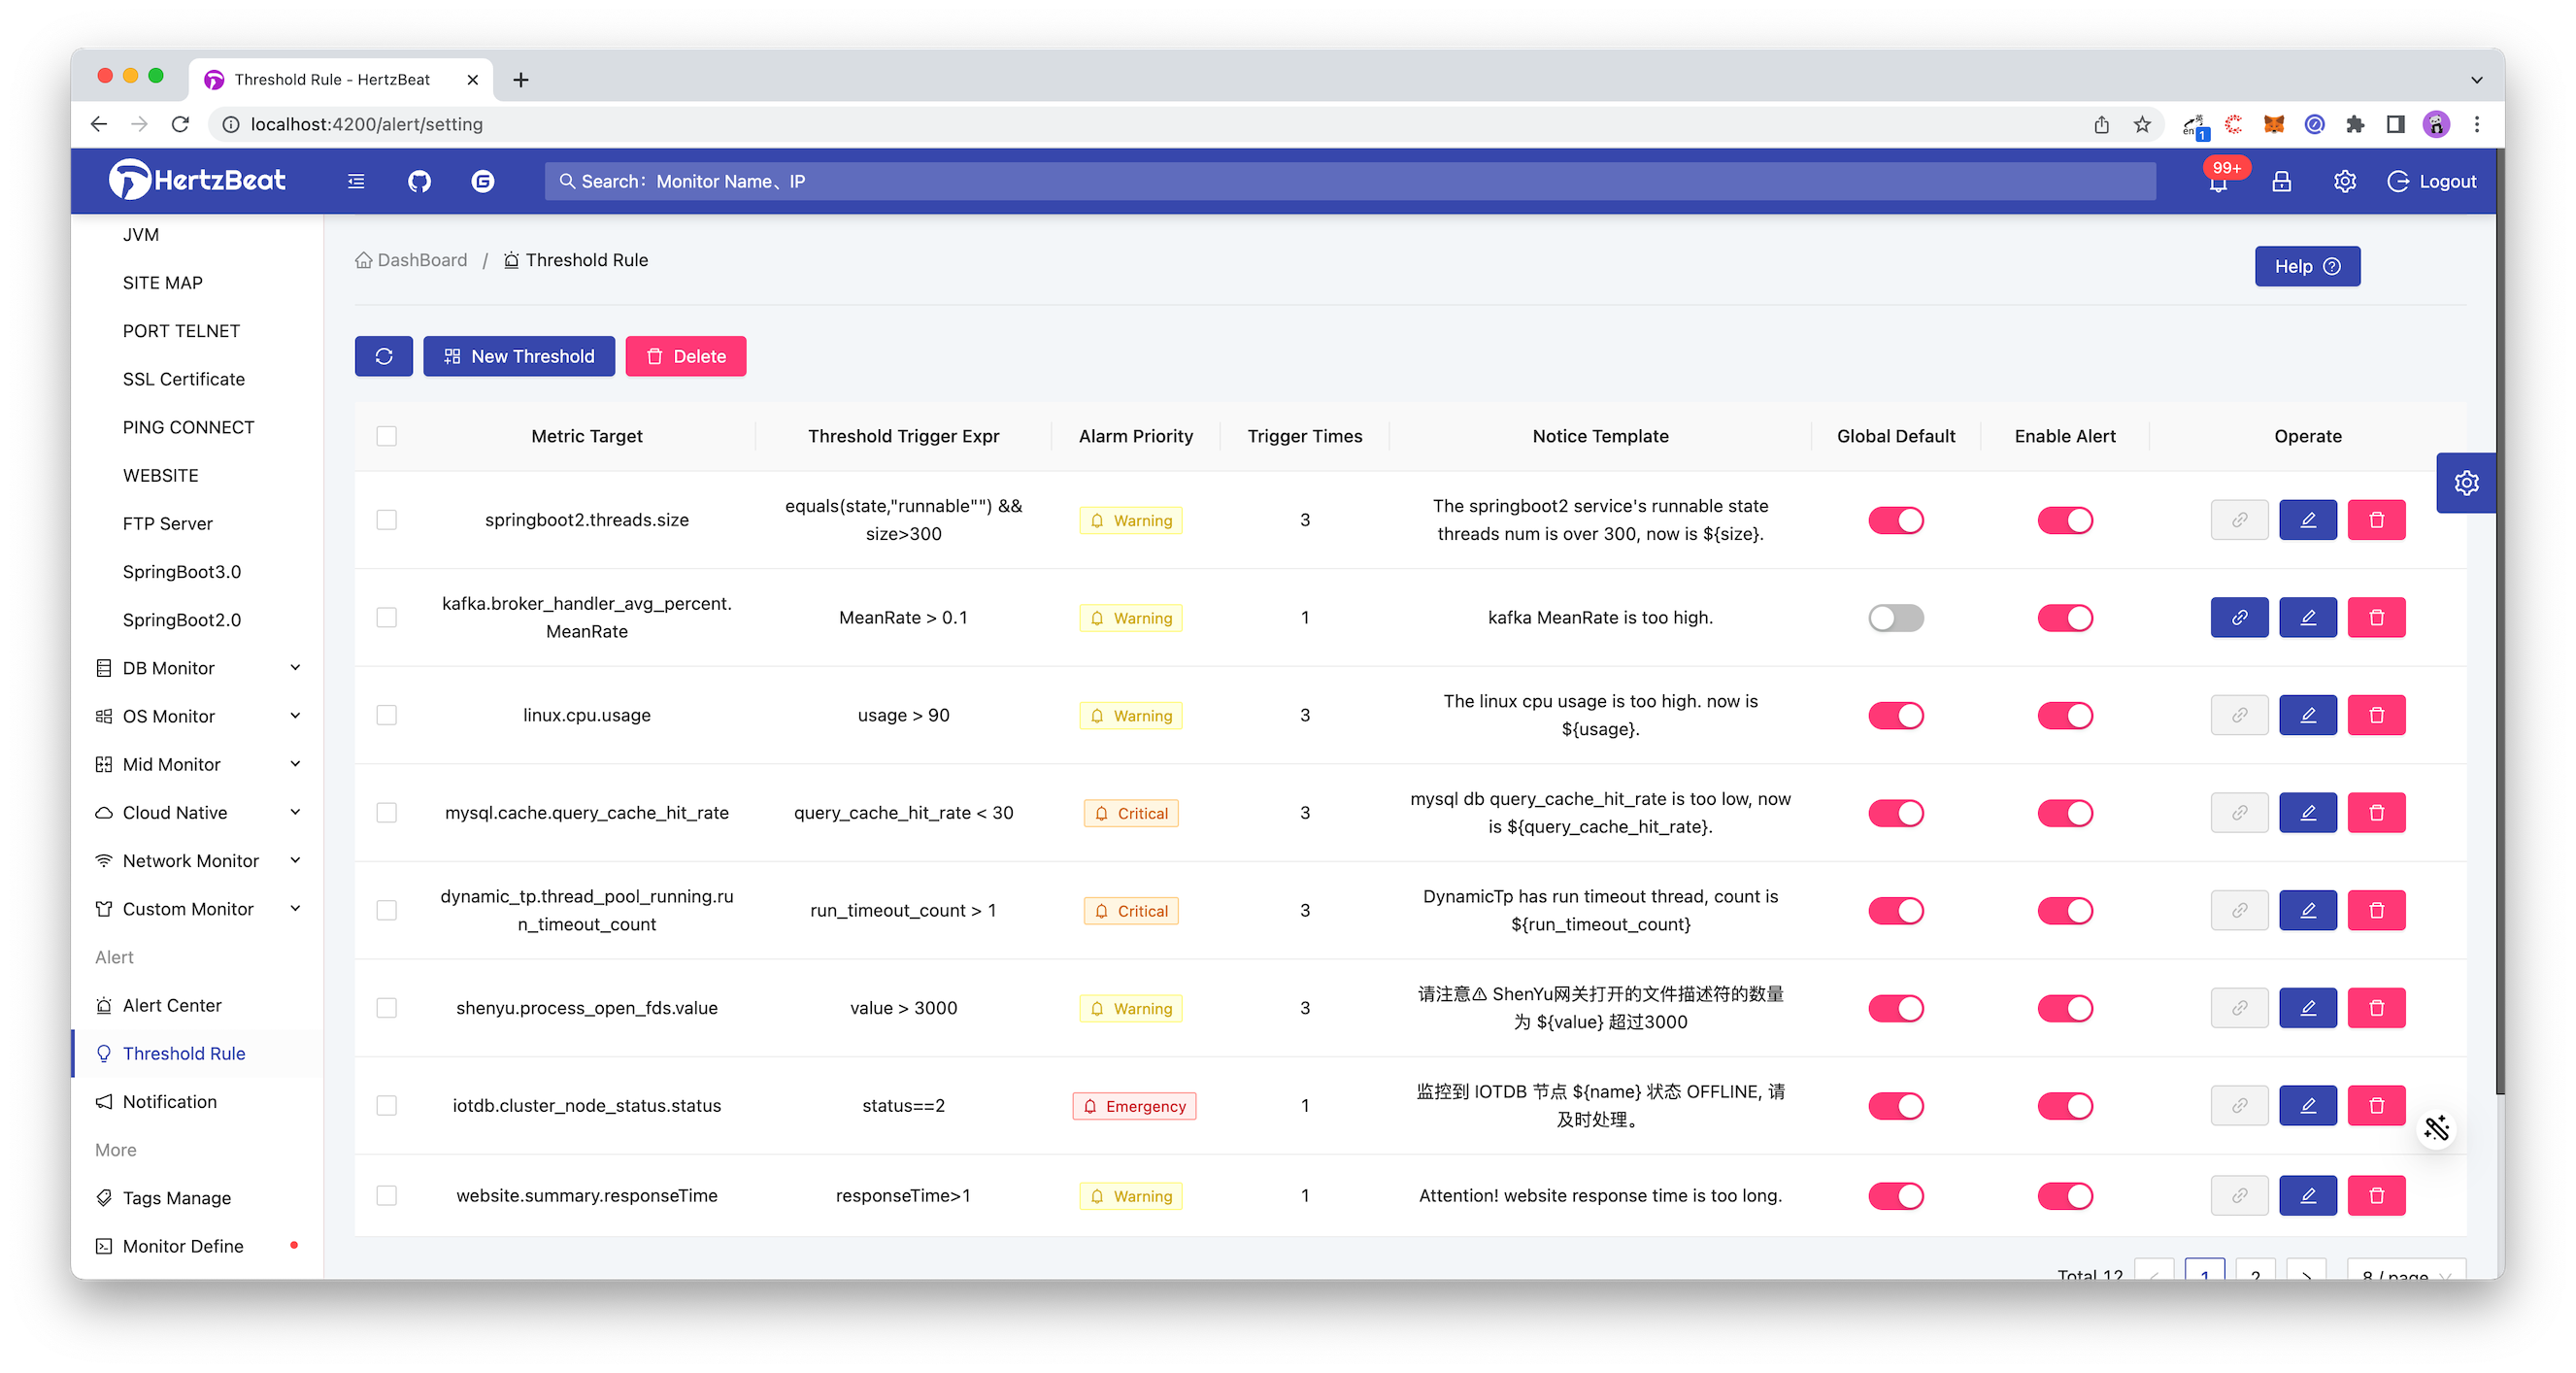
Configure an alarm threshold for an important indicator
Path: Menu -> Threshold Rules -> Add Threshold
-
Select the configured indicator object. SpringBoot2 application monitoring mainly focuses on stack memory threads and other related indicators. For example, we set the threshold for the indicator threads->threads. When the number of threads in therunnablestate is greater than At 300, an alert is issued. -
Here we configure to send an alarm when size,stateofequals(state, "runnable"") && size>300of this indicator, the alarm level is a warning alarm, which will be triggered three times, specifically as shown below.

-
Add message notification recipients
Configure the receiver to let the alarm message know who to send and how to send it.
Path: Menu -> Alarm Notification -> Alarm Recipient -> Add New Recipient
Message notification methods support email, DingTalk, WeChat Work, Feishu, WebHook, SMS, etc. Here we take the commonly used DingTalk as an example.
-
Refer to this Help Documentation to configure the robot on DingTalk and set the security custom keyword HertzBeat, get the correspondingaccess_tokenvalue. -
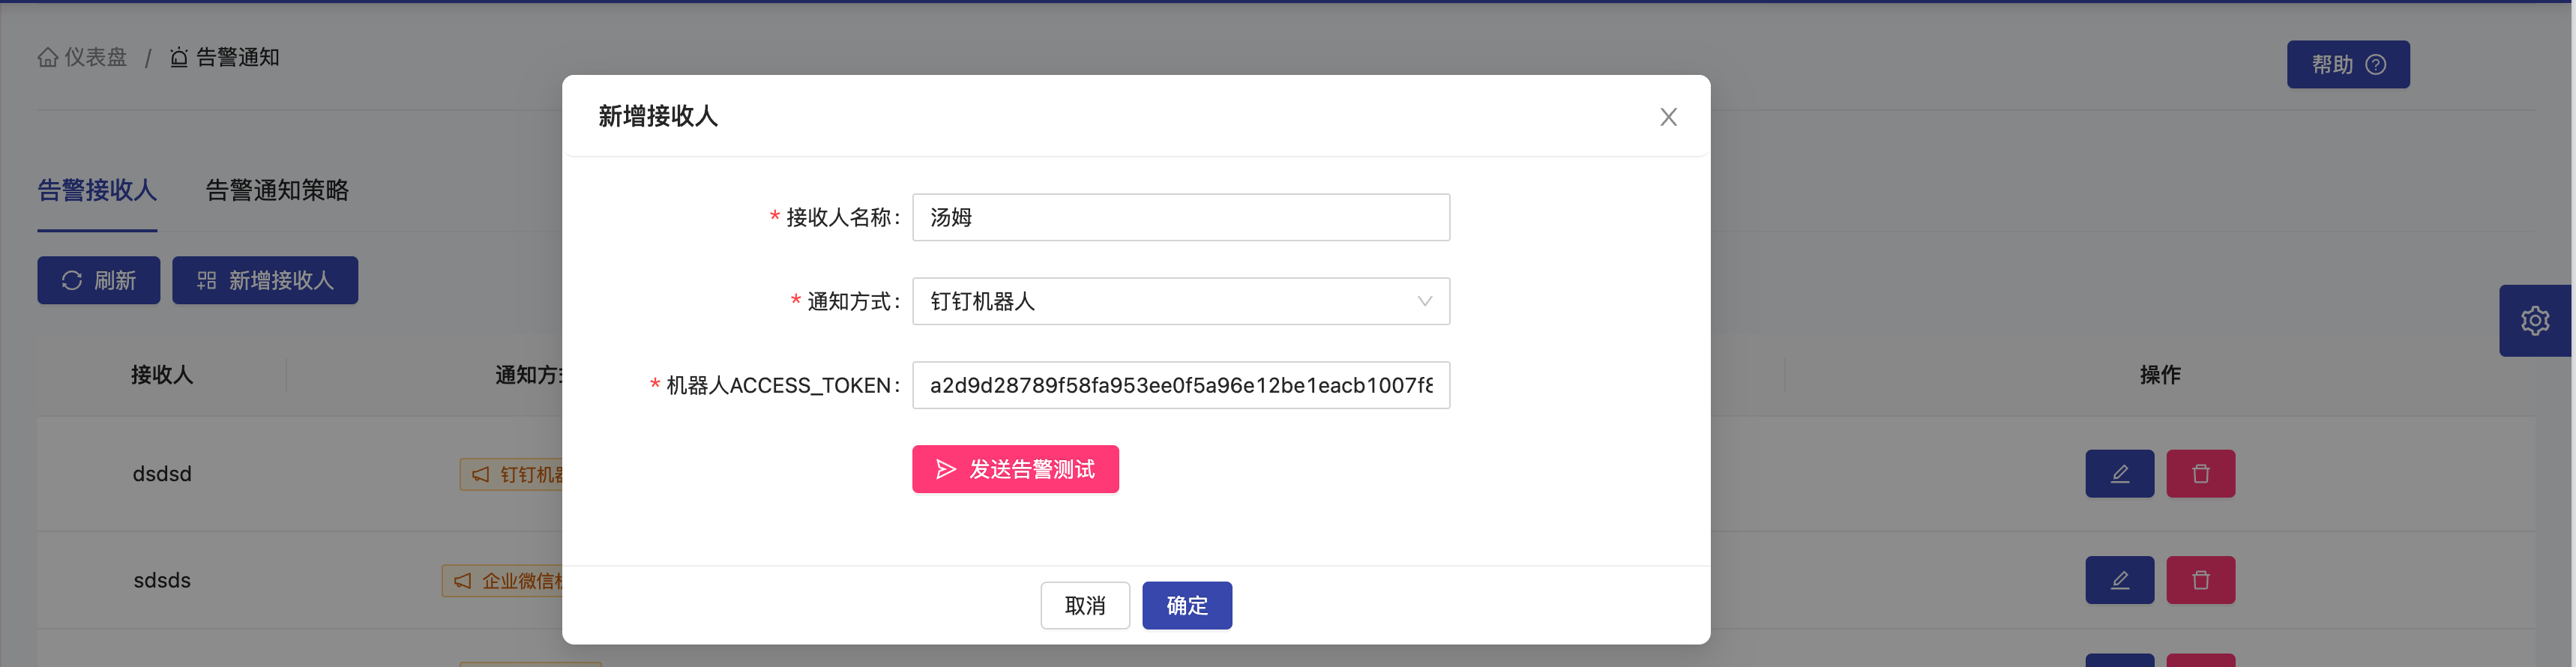
Configure the receiver parameters in HertzBeat as follows.
【Alarm Notification】->【New Recipient】->【Select DingTalk Robot Notification Method】->【Set DingTalk Robot ACCESS_TOKEN】->【OK】
-
Configure the associated alarm notification strategy [Add notification strategy] -> [Associate the recipient just set] -> [OK]
Configure the alarm notification policy to bind the alarm message with the receiver so that you can decide which alarms to send to whom.
Finished. Now we wait for the warning message to come.
[HertzBeat warning notification]
Alarm target object: springboot2.threads.size
Affiliated monitoring ID: 483783444839322
Belonging monitoring name: SPRINGBOOT2_localhost
Alarm level: warning alarm
Alarm trigger time: 2023-03-22 21:13:44
Content details: The springboot2 service's runnable state threads num is over 300, now is 444.
Summary
This practical article took us to experience how to use the open-source real-time monitoring tool HertzBeat to monitor SpringBoot2 application indicator data. We can find that HertzBeat, which integrates monitoring-alarm-notification, is more convenient in operation and use. Just click a little on the page. The SpringBoot2 application can be included in the monitoring and alarm notification, and the tedious operations of deploying multiple components and writing configuration files are no longer needed.
Only one docker command is needed to install and experience heartbeat:
docker run -d -p 1157:1157 --name hertzbeat tancloud/hertzbeat
More Powerful
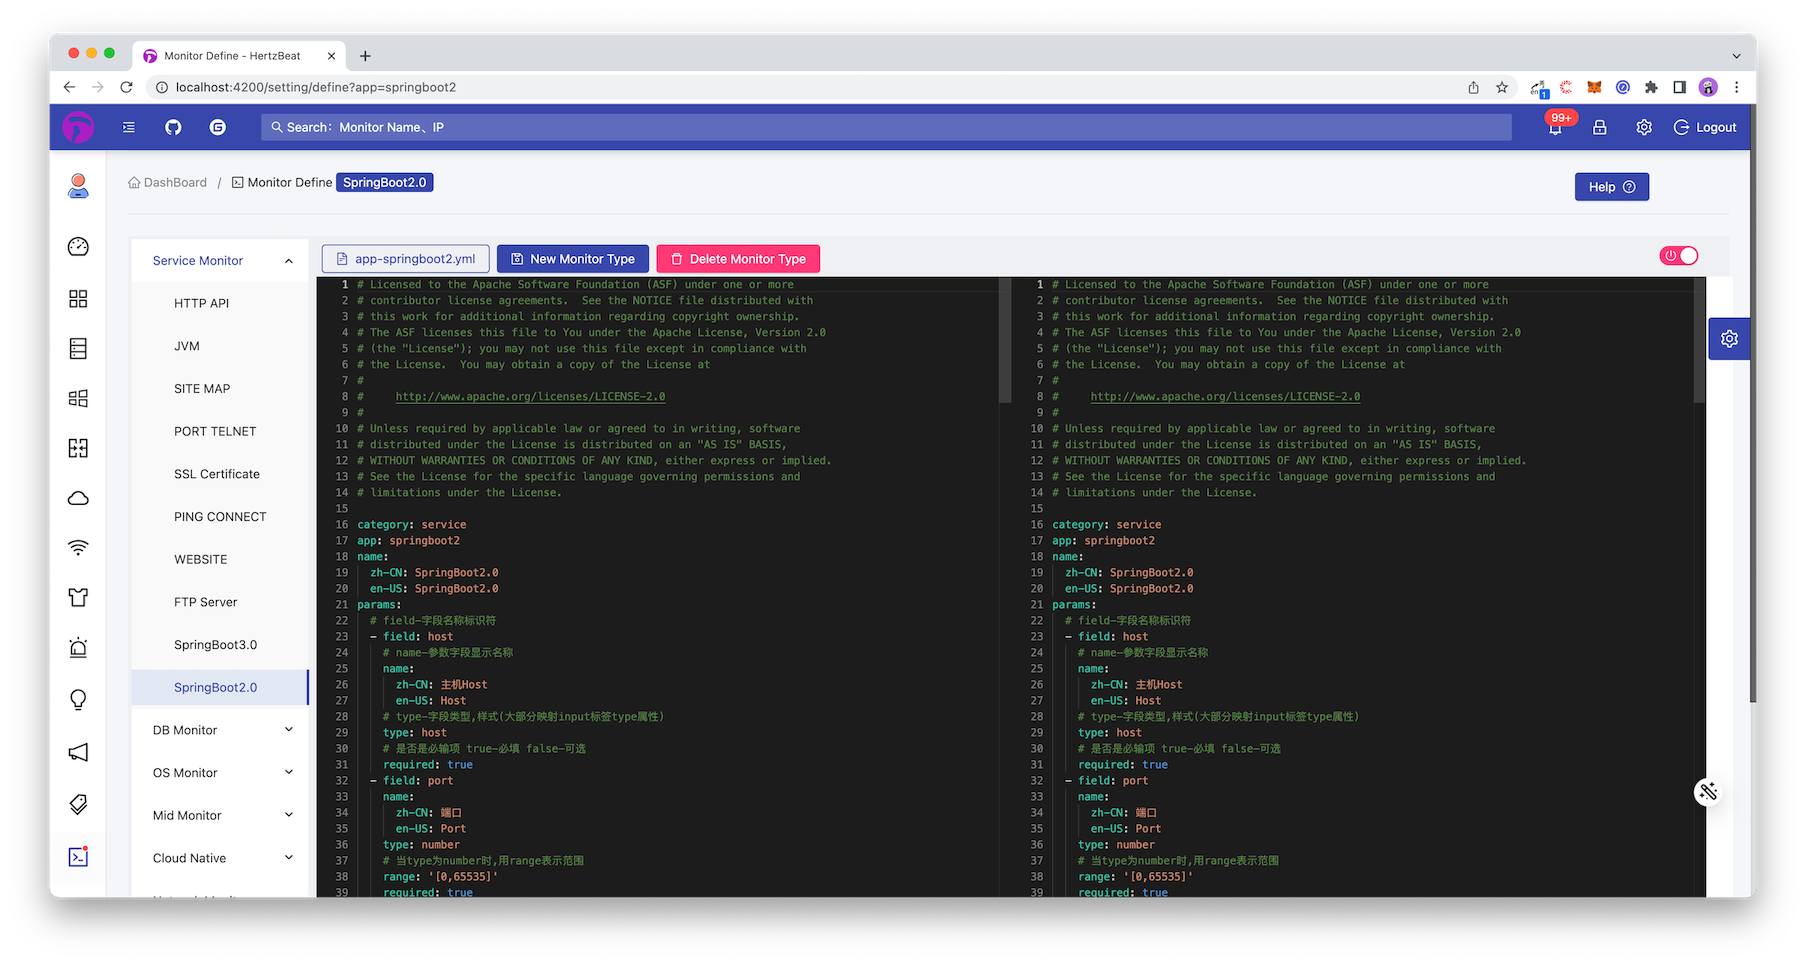
Through the simple steps above, we have realized the monitoring of SpringBoot2, but the built-in indicators in it do not meet the needs. Can we customize and monitor more indicators of SpringBoot2? The answer is, of course, yes; through Monitoring Definition->SpringBoot2 on the page, you can customize and modify the performance indicators you want to monitor by editing the following YML configuration file at any time.
Published at DZone with permission of gong tom. See the original article here.
Opinions expressed by DZone contributors are their own.
Comments