The Observability Gap: Why Your Monitoring Strategy Isn't Ready for What's Coming Next
The increasing complexity of distributed applications and the observability data they generate creates challenges. Find out how you can close this observability gap.
Anyone who’s been to London knows the announcements at the Tube to “Mind the gap,” but what about the gap that’s developing in our monitoring and observability strategies? I’ve been through this ordeal before, and have run a distributed system that was humming along perfectly. My alerts were manageable, my dashboards made sense, and when things broke, I could usually track down the issue in a reasonable amount of time.
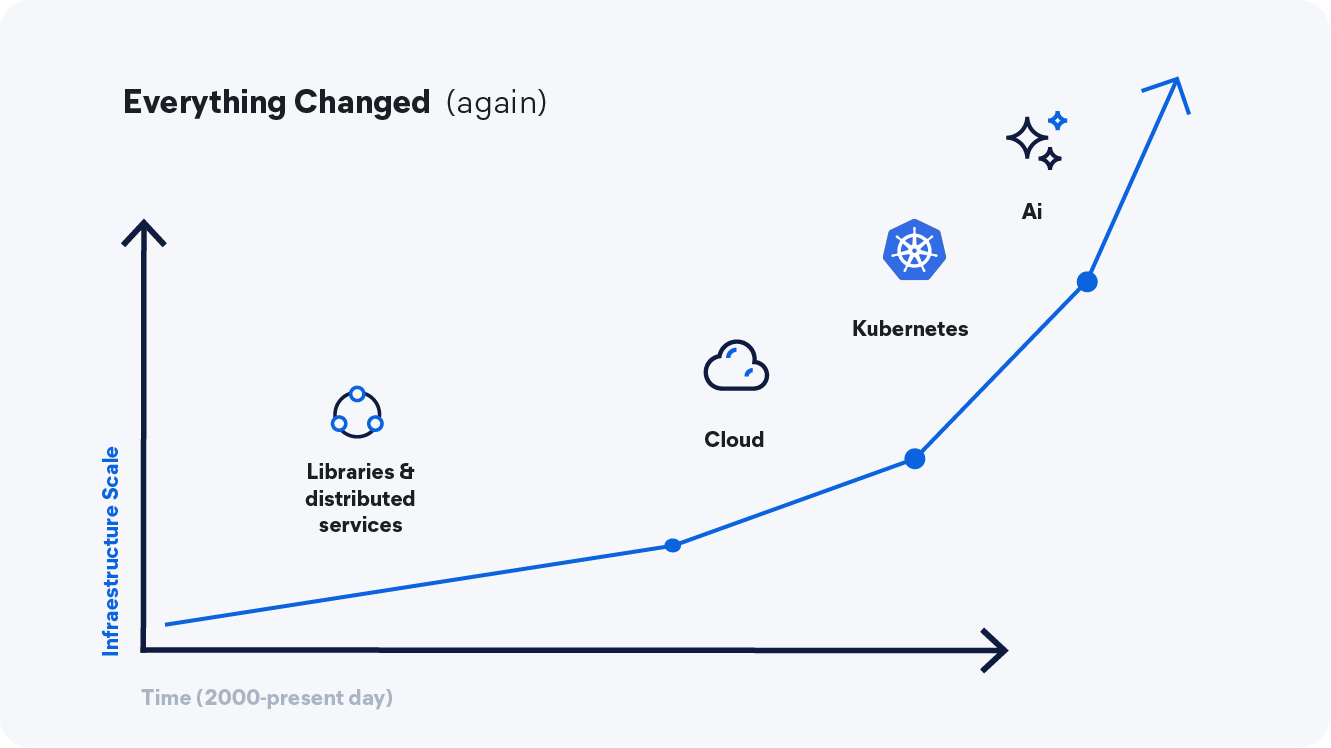
Fast forward 3–5 years, and things have changed. We added Kubernetes, embraced microservices, and maybe even sprinkled in some AI-powered features these days. Suddenly, you're drowning in telemetry data, your alert fatigue is real, and correlating issues across your distributed architecture feels stressful.
You're experiencing what I call the "observability gap," where system complexity rockets ahead while our monitoring maturity crawls behind. Today, we're going to explore why this gap exists, what's driving it wider, and most importantly, how to close it using modern observability practices.
The Complexity Rocket Ship Has Left the Station
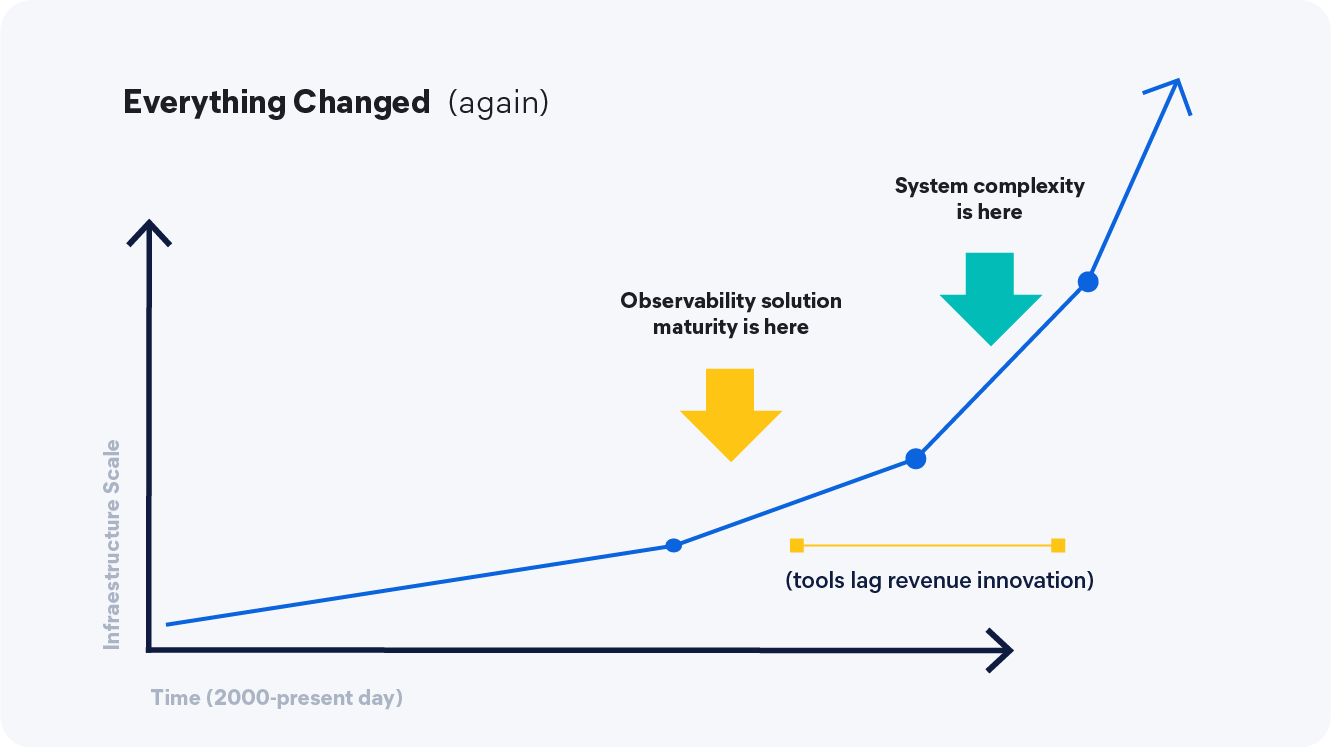
Let's be honest about what we're dealing with. The scale and complexity of our infrastructure isn't growing linearly; it's exponential. We've gone from monolithic applications running on physical servers to container orchestration platforms managing hundreds of microservices, with AI algorithms now starting to make scaling decisions autonomously.
This trajectory shows no signs of slowing down. With AI-assisted coding accelerating development cycles and intelligent orchestration systems like Kubernetes evolving toward predictive scaling, we're looking at infrastructure that's not just complex, but dynamically complex.
Meanwhile, our observability tooling? It's stuck in the past, designed for a world where you knew exactly how many servers you had and could manually correlate logs with metrics by cross-referencing timestamps.
The Telemetry Data Explosion (and Why Sampling Isn't the Answer)
One of the first things teams notice as they scale is their observability bill climbing faster than their infrastructure costs. The knee-jerk reaction is often to start sampling data, downsample metrics, head-sample traces, and deduplicate logs. While these techniques have their place, they're fundamentally at odds with where we're heading.
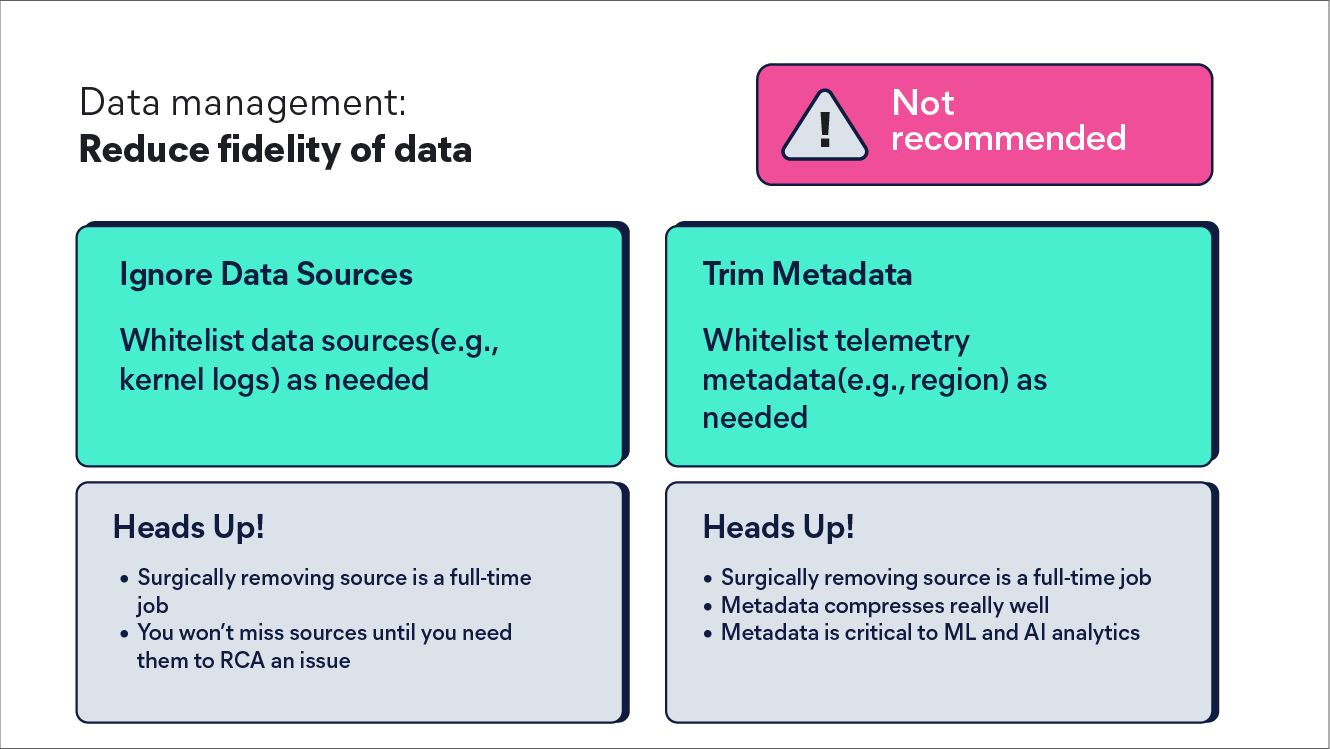
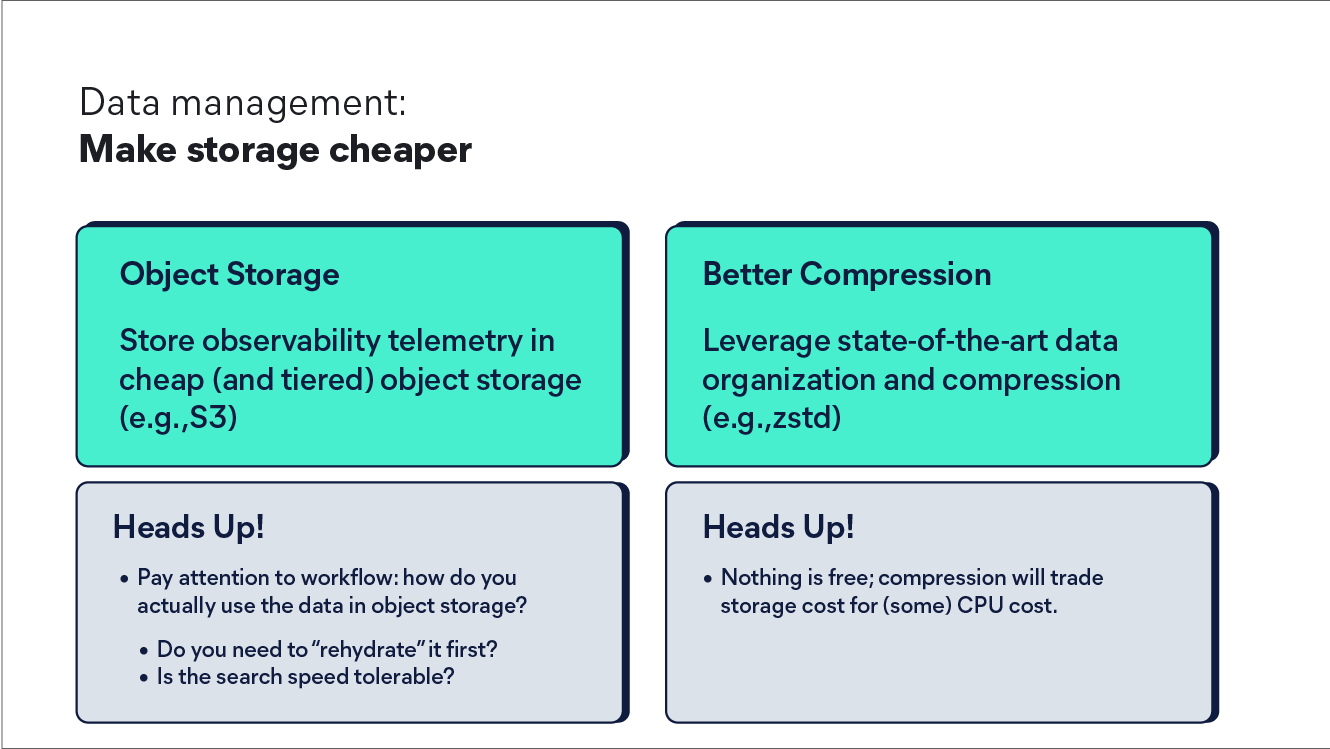
Here's the thing: ML and AI systems thrive on rich, contextual data. When you sample away the "noise," you're often discarding the very signals that could help you understand system behavior patterns or predict failures. Instead of asking "how can we collect less data?", the better question is "how can we store and process all this data cost-effectively?"
Modern storage architectures, particularly those leveraging object storage and advanced compression techniques like ZStandard, can achieve remarkable cost-to-value ratios. The secret is organizing related data together and moving it to cheaper storage tiers quickly. This approach lets you have your cake and eat it too, full fidelity data retention without breaking the bank.
Now, of course, there is a balance to this, and not all your applications are equal, so as a first step, you should look at all your most critical flows and applications and ensure that they have the richest telemetry. Do not use a sledgehammer approach and sample all your data just to reduce bills when a scalpel is best.
OpenTelemetry (OTel): The Foundation Everything Else Builds On
If I had to pick the single most transformative change in observability during my career, it would be OpenTelemetry. Not because it's flashy or revolutionary in concept, but because it solves fundamental problems that have plagued us for years.
Before OTel, instrumenting applications meant vendor lock-in. Want to switch from vendor A to vendor B? Good luck re-instrumenting your entire codebase. Want to send the same telemetry to multiple backends? Hope you enjoy maintaining multiple agent configurations.
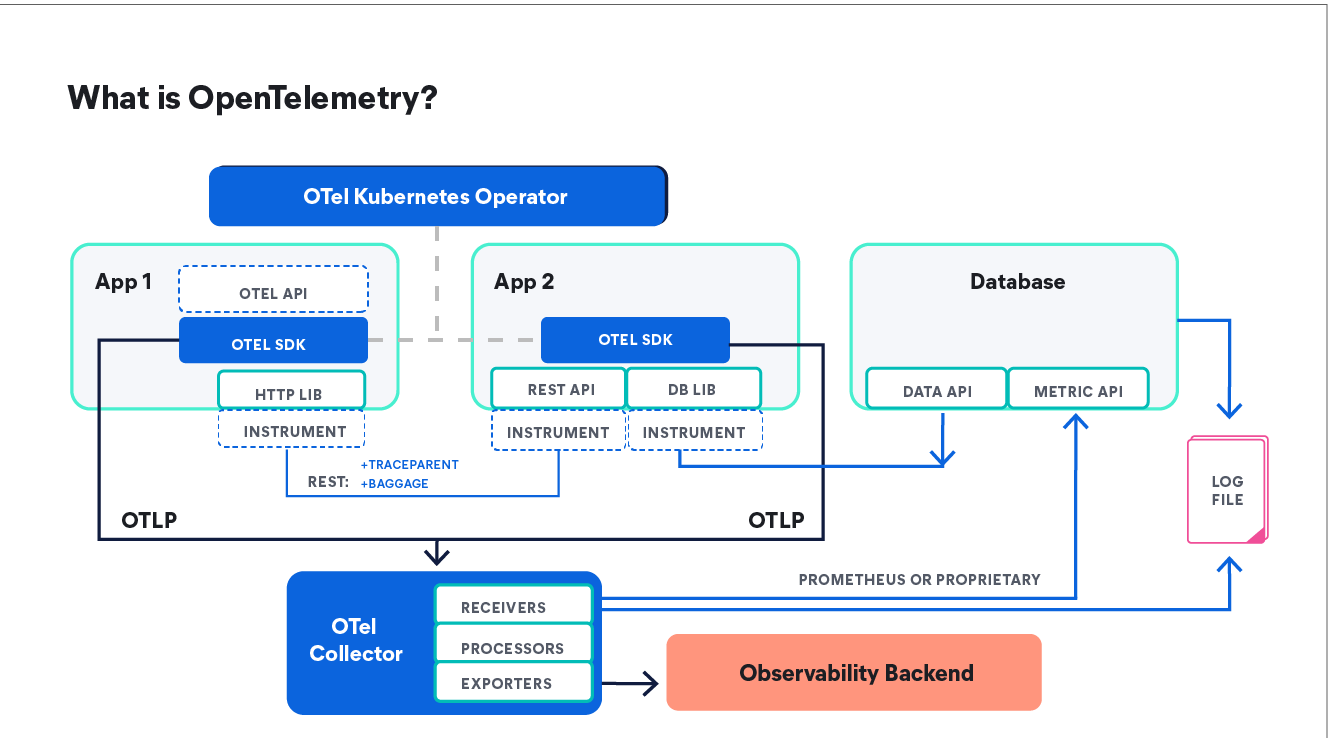
OpenTelemetry changes things completely. Here are the three main reasons why.
- Vendor neutrality: Your instrumentation code becomes portable. The same OTEL SDK can send data to any compliant backend.
- OpenTelemetry semantic conventions: All your telemetry (logs, metrics, traces, profiles, wide-events) shares common metadata like service names, resource attributes, and trace context.
- Auto-instrumentation: For the most popular languages and frameworks, you get rich telemetry with zero code changes.
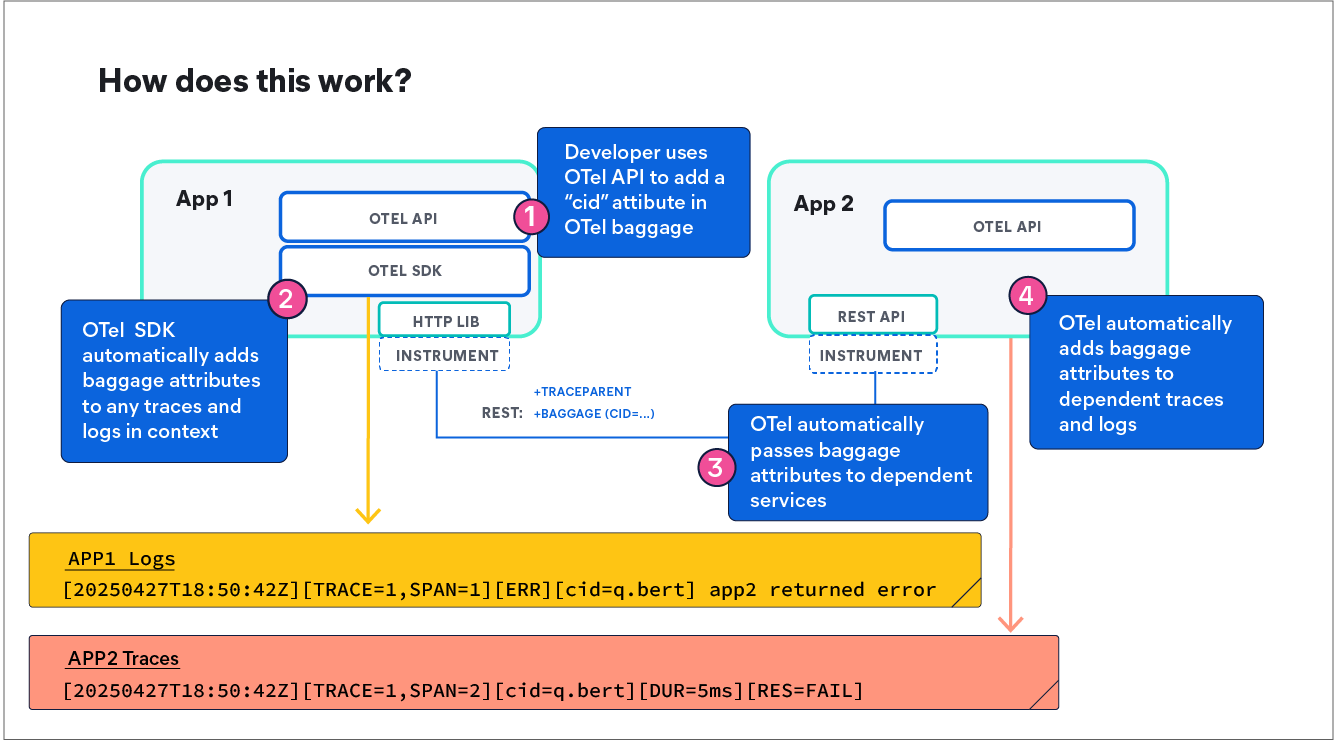
OTEL also makes manual instrumentation incredibly valuable with minimal effort. Adding a single line like this:
baggage.set_baggage("customer.id", "alice123")In your authentication service, the customer ID automatically flows through every downstream service call, every database query, and every log message. Suddenly, you can search all your telemetry data by customer ID across your entire distributed system.
The trajectory is clear: within a few years, OTel will be as ubiquitous and invisible as Kubernetes is becoming today. Runtimes will include it by default, cloud providers will offer OTel collectors at the edge, and frameworks will come pre-instrumented.
Correlation: The Secret Sauce That Makes Everything Click
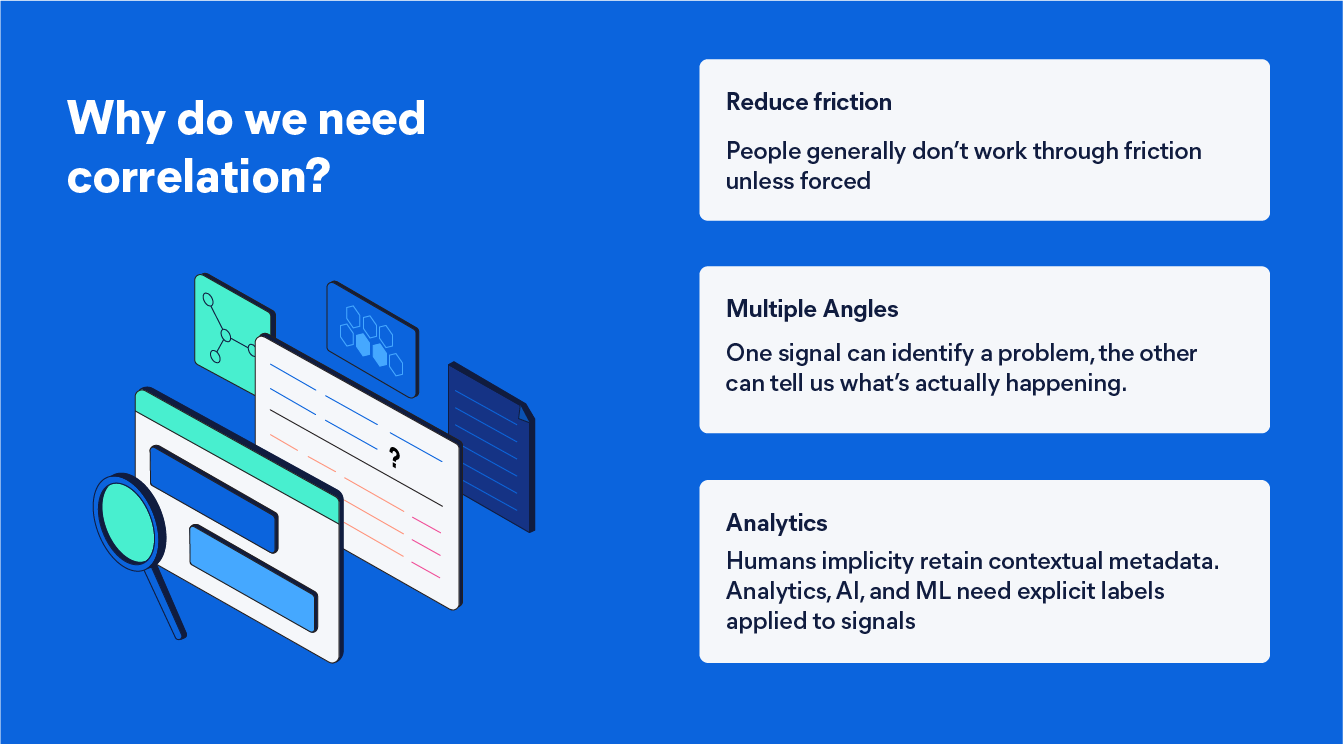
You get an alert about high latency. You check your metrics dashboard, yep, 95th percentile is spiking. You switch to your tracing system, and you can see some slow requests. You hop over to your logging system, and there are some error messages around the same time. Now comes the fun part: figuring out which logs correspond to which traces and whether they're related to the metric that alerted you.
This context-switching nightmare is exactly what proper correlation eliminates. When your telemetry data shares common identifiers, for example, trace IDs in logs, consistent service names, synchronized timestamps, or even customer IDs, you can seamlessly pivot between different signal types without losing context.
But correlation goes beyond just technical convenience. When you can search all your logs by customer.id and immediately see the traces and metrics for that customer's journey through your system, you transform how you approach support and debugging. When you can filter your entire observability stack by deployment version and instantly understand the impact of a release, you change how you think about deployments.
Metrics? Yes, even metrics can be correlated by using OpenTelemetry exemplars. For example, using Python, you would turn on exemplars as follows.
# Setup metrics with exemplars enabled

exemplar_filter = ExemplarFilter(trace_based=True)

exemplar_reservoir = ExemplarReservoir(

    exemplar_filter=exemplar_filter,`

    max_exemplars=5
)
This would then associate metrics with a trace that happens to be occurring, so you get some metrics correlated to your traces.
Then Again, Why Correlate at All?
You may be thinking that this is great, and I can see this being a useful strategy. It is especially useful when you have metrics, logs, and traces in separate systems; however, pretty soon you realize that it's a lot of effort when you could combine all this data in a single data structure and avoid the need to correlate at all. The observability industry agrees and has recently been espousing the benefits of a new signal type called wide-events.
Wide events are really just structured logs. The idea is to put metric data, trace data, and log data all into the same wide data structure, which can make analysis much easier. Think about it: if you have a single data structure, you can run queries and aggregations very quickly without joining any data, which can get pretty expensive.
Additionally, you are increasing the information density per log record, which is particularly great for AI applications. AI gets a context-rich dataset to do analysis on with minimal latency, a single record with enough descriptive capability to quickly find the root cause of your issue without having to dig around in other data stores and try to figure out whatever schema those data stores are using.
LLMs especially love context, and if you can give them all the context they need without having them try to find it, your investigation time will significantly reduce.
This isn't just about making SRE life easier (though it does that). It's about creating a rich, interconnected dataset that AI and ML systems need to understand your infrastructure's behavior patterns.
AI-Driven Investigations
Observability tools today have been pretty good at addressing alerting fatigue and dashboarding; things have gotten quite mature there. Alert correlation and other techniques drastically reduce the noise in these domains, not to mention a focus on being alerted by SLOs instead of pure technical metrics. Life has gotten better over the past few years for SREs here.
Now alerts are one piece of the puzzle, but the latest AI techniques using LLMs and agentic AI can unlock time savings in a different spot, during investigations. Think about it, investigations are typically what drags on when you have an outage, the cognitive overload while the pressure is on is very real and pretty stressful for SREs.
The good news is that when we get our data in good shape with correlation, enrichment, and adopting wide events, and we store the data in full fidelity, we now have the tools to help us drive faster investigations.
LLMs can take all that rich data and do some very powerful analysis that can cut down your investigation time. Let's walk through an example.
Imagine we have the following basic log. We only have a limited amount of data for an LLM to reason about. All it can tell is that a database failed.
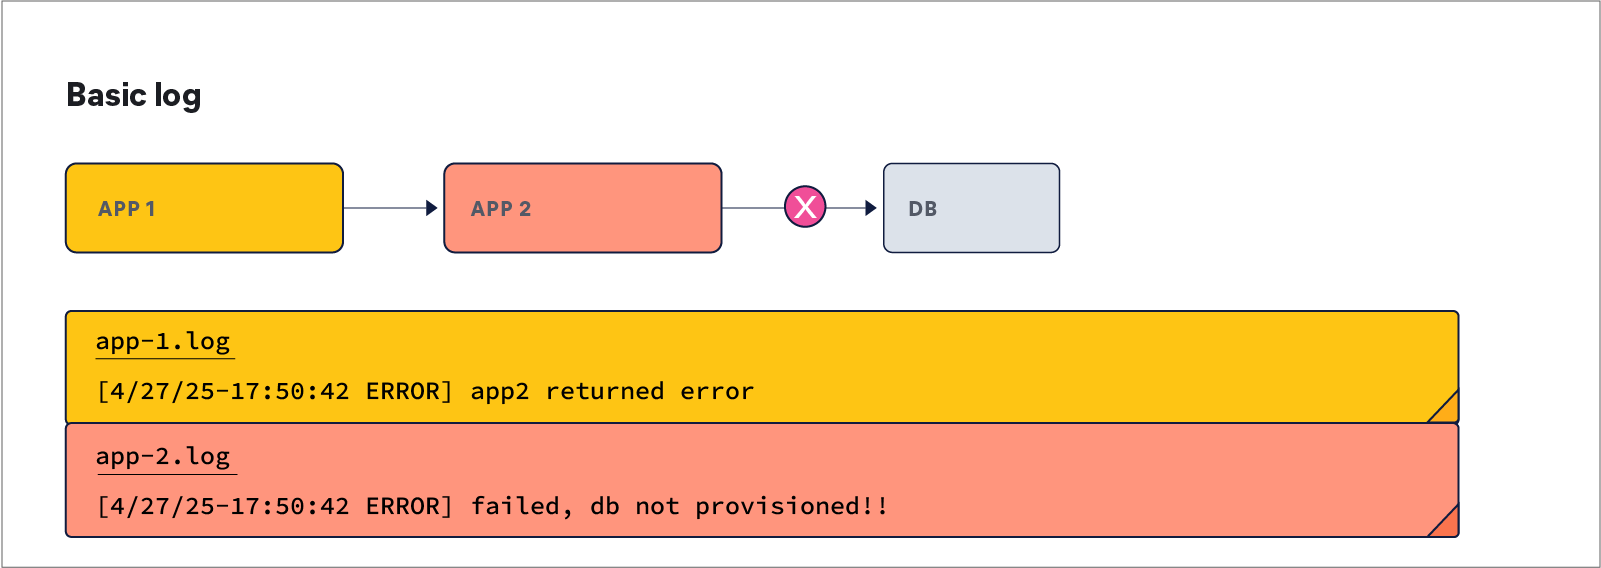
Let's see what this looks like when we use a wide event. Notice that already we can see some significant benefits. Firstly, we only had to visit the log from a single node, the node that serviced the request. We didn’t have to dig into downstream logs. This already makes life easier for the LLM; it doesn't have to figure out how to correlate multiple log lines, traces, and metrics, though we do still have correlation IDs if we desperately need to look in downstream systems.
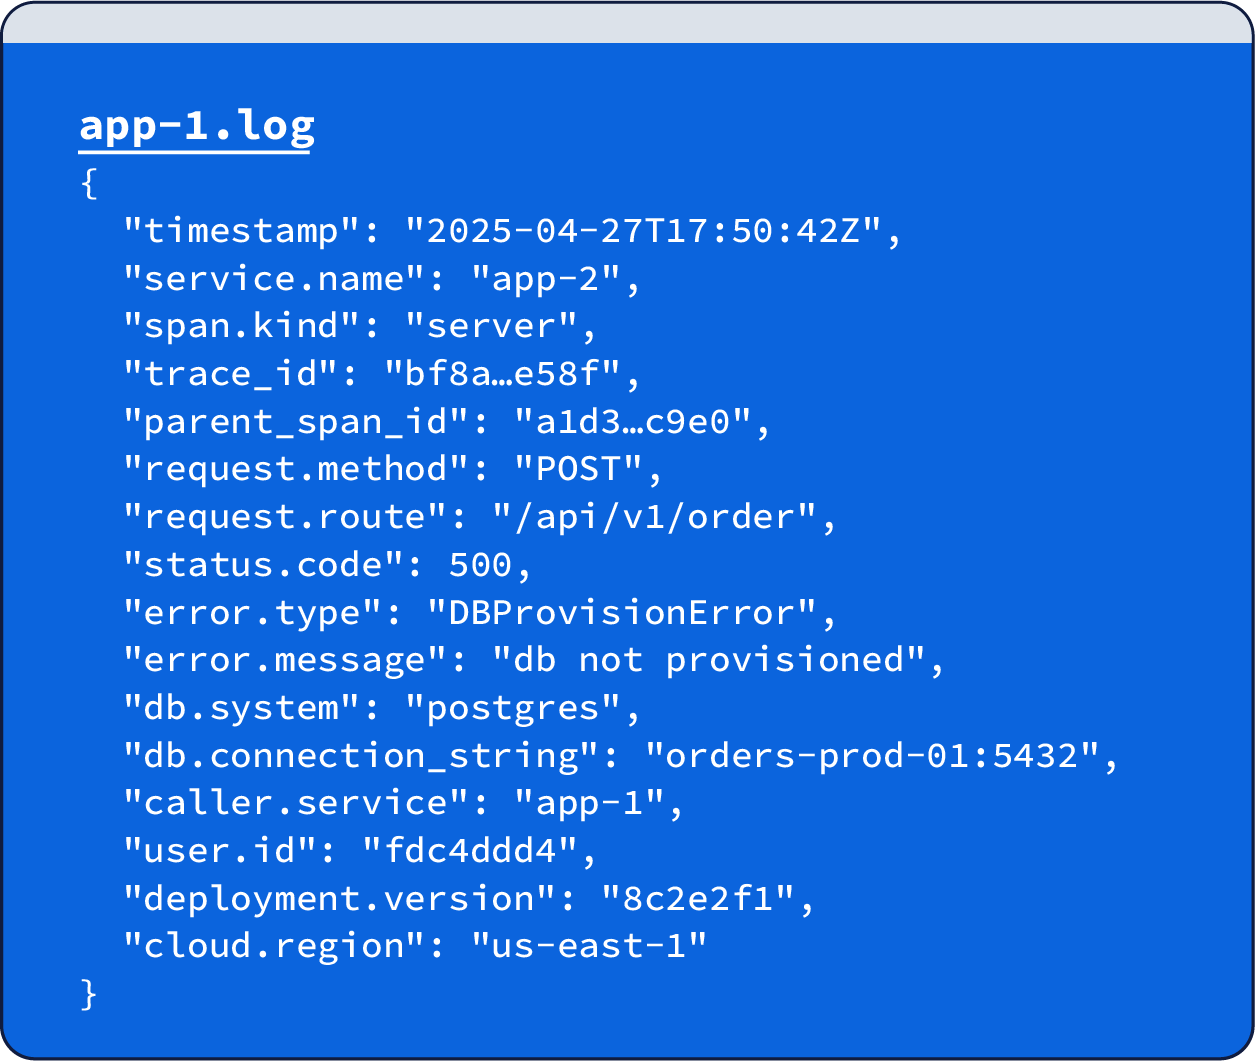
Next, we have all this additional rich data that an LLM can use to reason about what happened. LLMs work best with context, and if you can feed them as much context as possible, they will work more effectively to reduce your investigation time.
| Field | How an LLM uses it |
|---|---|
|
|
Thread every hop together without parsing free-text |
|
|
Precise failure class; no NLP guess-work |
|
|
Root-cause surface ("postgres isn't provisioned") |
|
|
Instant blast-radius queries |
|
|
Correlation with new releases |
Notice that we didn’t remove the unstructured error message; it is still useful context! LLMs are great at processing unstructured text, so this textual description helps them better understand the problem.
Large language models shine when they’re handed complete, context-rich evidence, exactly what wide-event logging supplies. Invest once in richer logs, and every downstream AI workflow (summaries, anomaly detection, natural-language queries) becomes simpler, cheaper, and far more reliable.
Building Toward the Future
As I look ahead, three trends seem inevitable:
- OpenTelemetry semantic conventions power wide-events: OTel semantic conventions will become as standard as logging is today to create wide-events. Cloud providers, runtimes, and frameworks will use it by default.
- Making sense of logs with LLMs: Both improving the richness of your data and having LLMs automatically improve the richness of your existing logs will become essential for shortening investigation times.
- AI will be essential: As system complexity outpaces human cognitive ability to understand it, AI assistance will become necessary for maintaining reasonable investigation times.
The organizations that start building toward this future now, adopting OpenTelemetry, investing in richer observability, and beginning to experiment with AI-assisted debugging will have a significant advantage as these trends accelerate.
Your Next Steps
If you're dealing with the observability gap in your own environment, here's where I'd start
- Evaluate your logs: Do your logs have the richness of data you need to shorten investigation times? Can LLMs help provide additional context?
- Start experimenting with OpenTelemetry: Even if you can't migrate everything immediately, instrumenting new services with OTel and using semantic conventions to produce wide-events gives you experience with the technology and starts building your enriched dataset.
- Add high-value context: Customer IDs, session IDs, deployment versions, even small amounts of contextual metadata can dramatically improve your debugging capabilities.
- Think beyond storage costs: Instead of sampling data away, investigate modern storage architectures that let you keep everything at a reasonable cost for your most critical services.
The complexity rocket ship has left the station, and it's not slowing down. The question isn't whether your observability strategy needs to evolve; it's whether you'll evolve it proactively or reactively. I know which approach leads to better sleep at night.
Comments