OpenTracing Spring Boot Instrumentation
OpenTracing is an open standard designed for distributed tracing. Here, we see how to get it integrated with a Spring Boot app and switching between tracing systems.
Join the DZone community and get the full member experience.
Join For Freein this demo series, we are going to look at how simple it is to instrument various java frameworks using opentracing . you will see that it requires minimal changes to the application code. by the time we're done, we will have microservice apps deployed on kubernetes and all services will be traced with an opentracing-compliant tracing system.
in this first demo, we are going to develop and trace a simple spring boot app.
create a web app
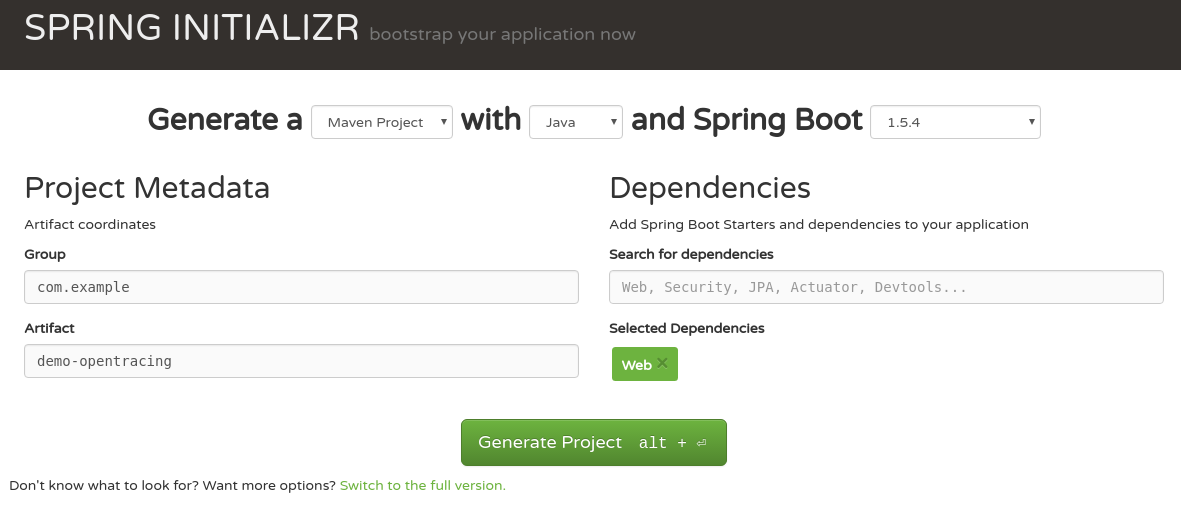
first, let’s write a simple web app. or better, let’s generate it! all we have to do is just to select a web dependency.
now the application is generated, but it does not contain a web controller. we are going to implement a simple controller with two methods. one will return a greeting and the other creates an http request which calls hello. this demonstrates simple request chaining between services. do not worry, all the code is on github . at the bottom of this article, you will find all necessary links.
hello controller:
@restcontroller
public class hellocontroller {

    @autowired
    private resttemplate resttemplate;

    @requestmapping("/hello")
    public string hello() {
        return "hello from spring boot!";
    }

    @requestmapping("/chaining")
    public string chaining() {
        responseentity<string> response = resttemplate.getforentity("http://localhost:8080/hello", string.class);
        return "chaining + " + response.getbody();
    }
}
now the application can serve requests for urls
http://localhost:8080/hello
and
http://localhost:8080/chaining
. the app is still not instrumented, we won’t see any data coming to a tracing system.
instrumentation
instrumentation with opentracing integrations is very simple. for spring boot, there is an auto-configuration that instruments all rest controllers and
resttemplate
beans. just add the following dependency to the classpath:
<dependency>
    <groupid>io.opentracing.contrib</groupid>
    <artifactid>opentracing-spring-web-autoconfigure</artifactid>
</dependency>
this dependency requires only one thing — a tracer bean, which will be used to report data to the chosen tracing system. if we don’t specify this bean, auto-configuration will choose
nooptracer
.
because we are using opentracing instrumentation, we are not bound to any specific tracing system. we will now show how to first use jaeger and then switch to zipkin. we will see that changing the tracing system is just a matter of configuration.
as we mentioned, the only tracing configuration needed here is to provide a tracer bean.
jaeger
creating a jaeger tracer is very simple. it just requires a sampler configuration and, because it is a demo, we are going to sample all requests. note that we are not specifying the url to a jaeger server. by default, it will assume that it runs on localhost.
@bean
public io.opentracing.tracer jaegertracer() {
    return new configuration("spring-boot", new configuration.samplerconfiguration(probabilisticsampler.type, 1),
        new configuration.reporterconfiguration())
        .gettracer();
now we can start the jaeger server using
docker run --rm -it --network=host jaegertracing/all-in-one
, then compile and run our app. when everything is up and running, generate some requests to the urls defined in the previous section.
open the jaeger ui on
http://localhost:16686
:
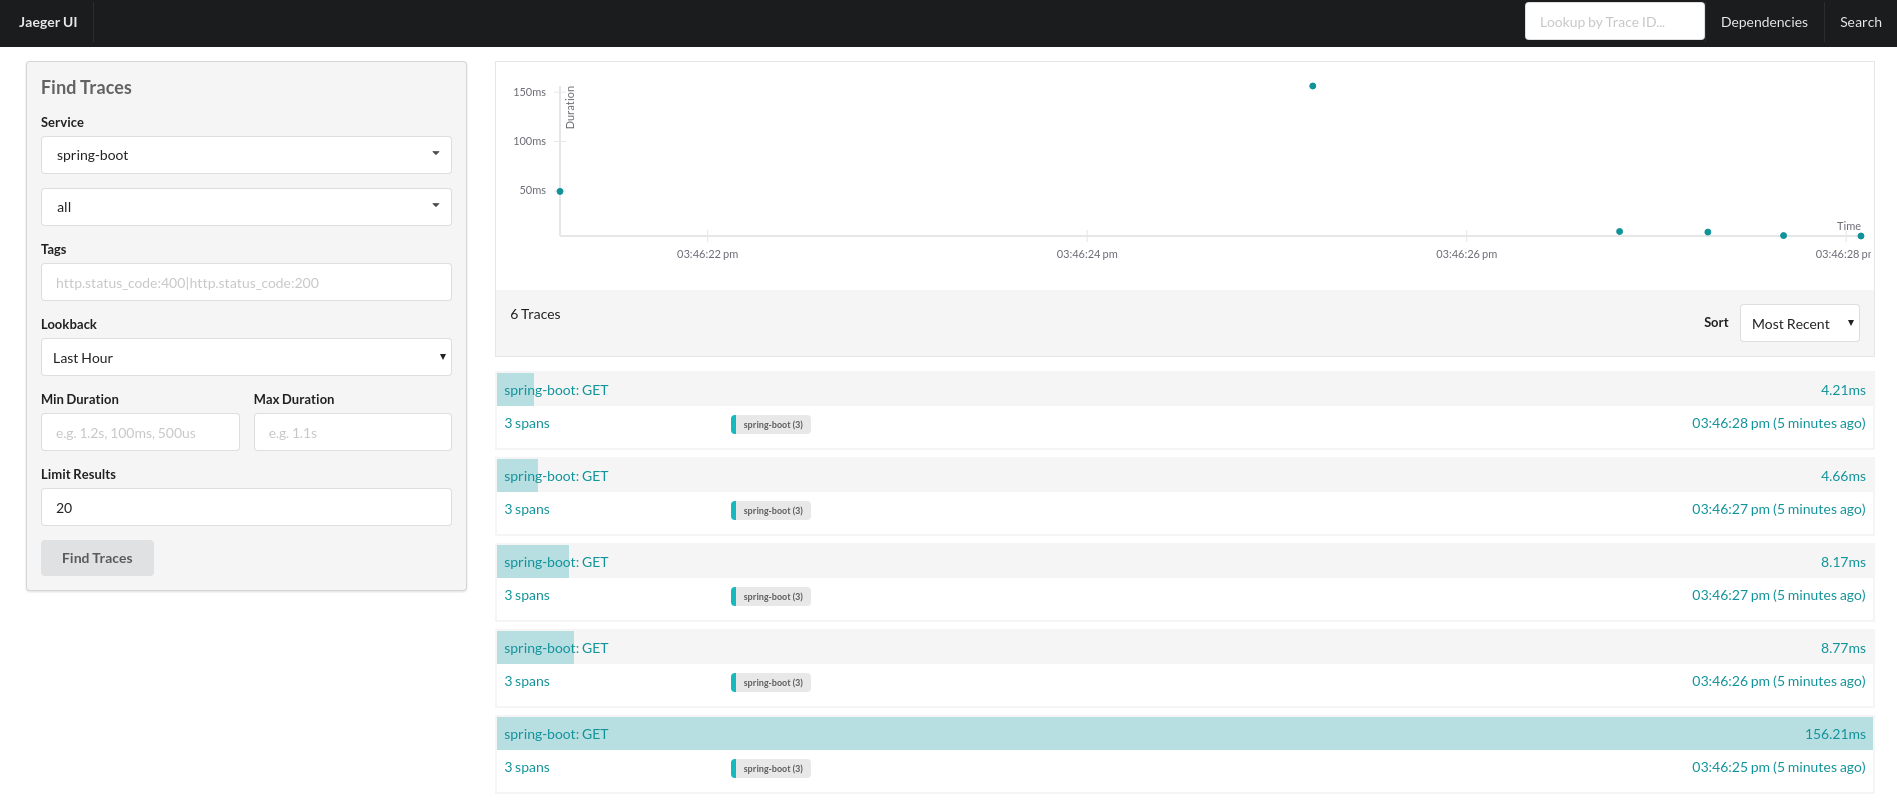
 figure 2: jaeger showing reported traces.
in the picture, we can see traces for the request to the
/chaining
endpoint. there are three spans: one representing server processing of
/chaining
, the second representing a client request to
/hello
, and the third being the server processing of the
/hello
endpoint.
zipkin
now let’s benefit from opentracing and switch tracing systems with o(1) effort. to do that, we just need to provide an instance of the zipkin tracer bean. do not forget to comment out the jaeger tracer bean. otherwise, instrumentation would not know which tracer to use.
the zipkin configuration is very similar — it just needs to know the zipkin url:
@bean
public io.opentracing.tracer zipkintracer() {
    okhttpsender okhttpsender = okhttpsender.create("http://localhost:9411/api/v1/spans");
    asyncreporter<span> reporter = asyncreporter.builder(okhttpsender).build();
    tracing bravetracer = tracing.newbuilder().localservicename("spring-boot").reporter(reporter).build();
    return bravetracer.create(bravetracer);
}
the zipkin server can be started with
docker run --rm -it -p 9411:9411 openzipkin/zipkin
. now we have to rebuild and start our demo app and generate requests.
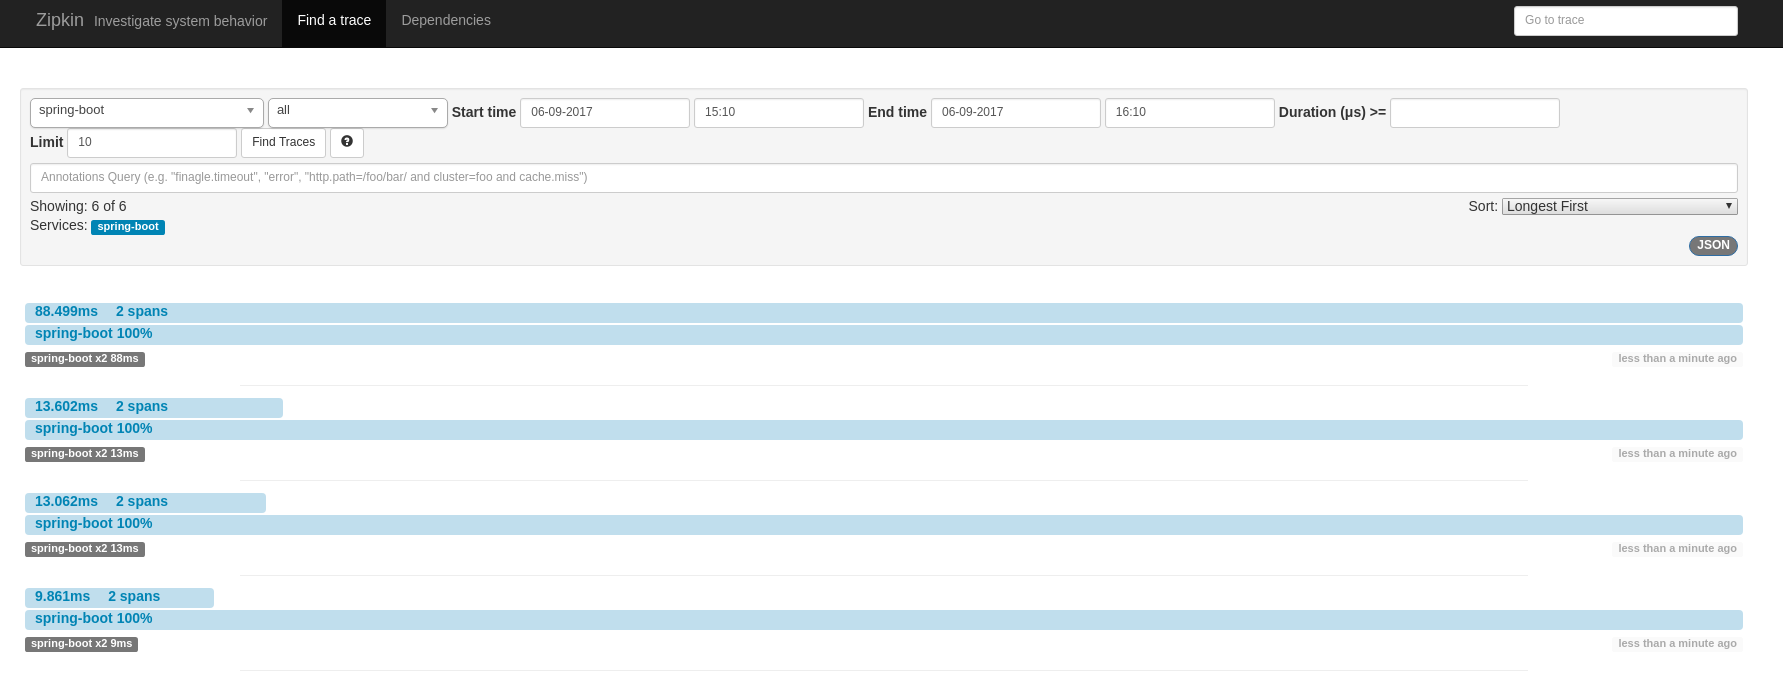
 figure 3: zipkin showing reported traces.
this screenshot also shows traces for the invocation of the
/chaining
endpoint. in this case, it shows only two spans because zipkin uses a shared span model, which means that client and server invocation of
/hello
uses the same span. this is a great example that shows how different opentracing providers might model and show things differently.
video
conclusion
we have seen how simple it is to instrument spring boot with opentracing. this instrumentation leverages all key opentracing benefits like: vendor-neutrality, o(1) change of tracing systems, or wiring different instrumentations together. in the next blog post, we will look at jax-rs instrumentation, and in the last demo, all the applications will be deployed on kubernetes and traced using jaeger’s production deployment with a cassandra cluster.
links
- opentracing: http://opentracing.io
- github repository with demo: https://github.com/pavolloffay/opentracing-java-examples
- opentracing spring boot instrumentation: https://github.com/opentracing-contrib/java-spring-web
- jaeger: https://github.com/uber/jaeger
- zipkin: https://github.com/openzipkin/zipkin
Published at DZone with permission of Pavol Loffay, DZone MVB. See the original article here.
Opinions expressed by DZone contributors are their own.


Comments