A Hands-On Guide to OpenTelemetry: Visualizing Instrumentation for Developers Using Jaeger
This article continues the journey by learning the first steps developers can take with visualizing instrumentation using Jaeger on their observability journey.
Join the DZone community and get the full member experience.
Join For FreeAre you ready to start your journey on the road to collecting telemetry data from your applications? Great observability begins with great instrumentation!
In this series, you'll explore how to adopt OpenTelemetry (OTel) and how to instrument an application to collect tracing telemetry. You'll learn how to leverage out-of-the-box automatic instrumentation tools and understand when it's necessary to explore more advanced manual instrumentation for your applications. By the end of this series, you'll have an understanding of how telemetry travels from your applications to the OpenTelemetry Collector, and be ready to bring OpenTelemetry to your future projects. Everything discussed here is supported by a hands-on, self-paced workshop authored by Paige Cruz.
In the previous article, we explored how to leverage programmatic instrumentation in our application as developers would in their daily coding using OTel libraries. In this article, we carry onwards to improve the visualization of our telemetry data that was being displayed in console output. We are going to programmatically instrument and configure our application to direct all telemetry data to a Jaeger instance for visual insights.
It is assumed that you followed the previous articles in setting up both OpenTelemetry and the example Python application project, but if not, go back and see the previous articles as it's not covered here.
Instrumenting With Jaeger
As mentioned previously, OTel does not provide a backend to store its collected telemetry data. Instead, it's acting as a collector of telemetry data and forwarding that to our preferred backend system. For visualizing telemetry data we need this backend storage where we then can query our data that tooling, such as Jaeger can then visualize in dashboards.
Jaeger was built with all of this in mind, providing a very quick way to get started if you supply it with OpenTelemetry Protocol (OTLP) formatted data. We are going to use the default Jaeger in-memory storage for our telemetry data by sending it to Jaeger and explore it visually using the predefined UI dashboards.
Carrying on from our previous setup where we instrumented programmatically to output our span data to the console, we'll modify this to now use the OTLPSpanExporter in our application code. This can be configured to send our span data directly to a Jaeger instance with an OTLP endpoint.
Using the downloaded project we installed from previous articles, we can open the file programmatic/Buildfile-prog and add the bold lines below to install the OTLP Exporter library:
FROM python:3.12-bullseye

WORKDIR /app

COPY requirements.txt requirements.txt

RUN pip install -r requirements.txt

RUN pip install opentelemetry-api \
    opentelemetry-exporter-otlp \
    opentelemetry-sdk \
    opentelemetry-instrumentation-flask \
    opentelemetry-instrumentation-jinja2 \
    opentelemetry-instrumentation-requests

COPY . .

CMD [ "flask", "run", "--host=0.0.0.0"]
Next, we need to adjust the application code found in programmatic/app.py to import the OLTPSpanExporter library and swap out the ConsoleSpanExporter as shown in bold:
import random
import re
import urllib3

import requests
from flask import Flask, render_template, request
from breeds import breeds


from opentelemetry.trace import set_tracer_provider
from opentelemetry.sdk.trace import TracerProvider
from opentelemetry.sdk.trace.export import SimpleSpanProcessor
from opentelemetry.exporter.otlp.proto.http.trace_exporter import OTLPSpanExporter
from opentelemetry.instrumentation.flask import FlaskInstrumentor
from opentelemetry.instrumentation.jinja2 import Jinja2Instrumentor
from opentelemetry.instrumentation.requests import RequestsInstrumentor

provider = TracerProvider()
processor = SimpleSpanProcessor(OTLPSpanExporter())
provider.add_span_processor(processor)

set_tracer_provider(provider)
...
Next, we insert the imports needed for flask, jinja2, and requests instrumentation libraries above the section we just created. The code to be added is shown in bold below:
import random
import re
import urllib3

import requests
from flask import Flask, render_template, request
from breeds import breeds


from opentelemetry.trace import set_tracer_provider
from opentelemetry.sdk.trace import TracerProvider
from opentelemetry.sdk.trace.export import SimpleSpanProcessor, ConsoleSpanExporter

from opentelemetry.instrumentation.flask import FlaskInstrumentor
from opentelemetry.instrumentation.jinja2 import Jinja2Instrumentor
from opentelemetry.instrumentation.requests import RequestsInstrumentor

provider = TracerProvider()
processor = SimpleSpanProcessor(ConsoleSpanExporter())
provider.add_span_processor(processor)

set_tracer_provider(provider)

app = Flask("hello-otel")

FlaskInstrumentor().instrument_app(app)
Jinja2Instrumentor().instrument()
RequestsInstrumentor().instrument()
...
Next, we can review the pod configuration file where all the details are found to run multiple container images in a Kubernetes pod. We will be using the Jaeger all-in-one image, which is designed for quick local testing. It includes the Jaeger UI, jaeger-collector, jaeger-query, and jaeger-agent, with an in-memory storage component.
Save and close the file programmatic/app.py and build the new container image with the following command:
$ podman build -t hello-otel:prog -f programmatic/Buildfile-prog

Successfully tagged localhost/hello-otel:prog  \
516c5299a32b68e7a4634ce15d1fd659eed2164ebe945ef1673f7a55630e22c8
Next, open the file programmatic/app_pod.yaml and review the Jaeger section. Note the ports: 16686 and 4318. The first is for the Jaeger UI and the second is for telemetry data sent via OTLP over HTTP:
...
- name: jaeger-all-in-one
image: jaegertracing/all-in-one:1.56
resources:
  limits:
    memory: "128Mi"
    cpu: "500m"
ports:
- containerPort: 16686
  hostPort: 16686
- containerPort: 4318
env:
- name: COLLECTOR_OTLP_ENABLED
  value: "true"
- name: OTEL_TRACES_EXPORTER
  value: "otlp"
Now let's run the entire configuration, putting our application and the Jaeger all-in-one containers in action in a pod with the following:
$ podman play kube programmatic/app_pod.yaml

Pod:
277dd50306eed445f4f43fc33111eedb31ed5804db1f60a6f0784a2333a54de0
Containers:
b9d5075e2051502b12510deddfb34498f32b2ae12554c5328fecd9725c7b1fe2
8505e8c8cfffaff1f473cfbbf5d9a312ca8247f32653cccf7d192305c1ca741a
Open a browser and view the Jaeger UI at http://localhost:16686 which should display the Gopher Detective as shown below:

Now we can generate telemetry data by accessing our application and making several requests to the http://localhost:8001/doggo endpoint and see something like this:

Refreshing the doggo application emits traces with spans from each instrumentation library below providing a nice visual in the Jaeger UI:
- Flask spans representing requests to the app
- Requests spans for the external request to Dog API
- Jinja2 spans for HTML template compilation
Back in our Jaeger UI, we can select hello-otel from the service dropdown menu and click on the find traces button on the bottom right. Confirm that you see traces returned for the operation /doggo, something like this:

Verify by clicking on a span name, the top one for example, and view the trace waterfall view:
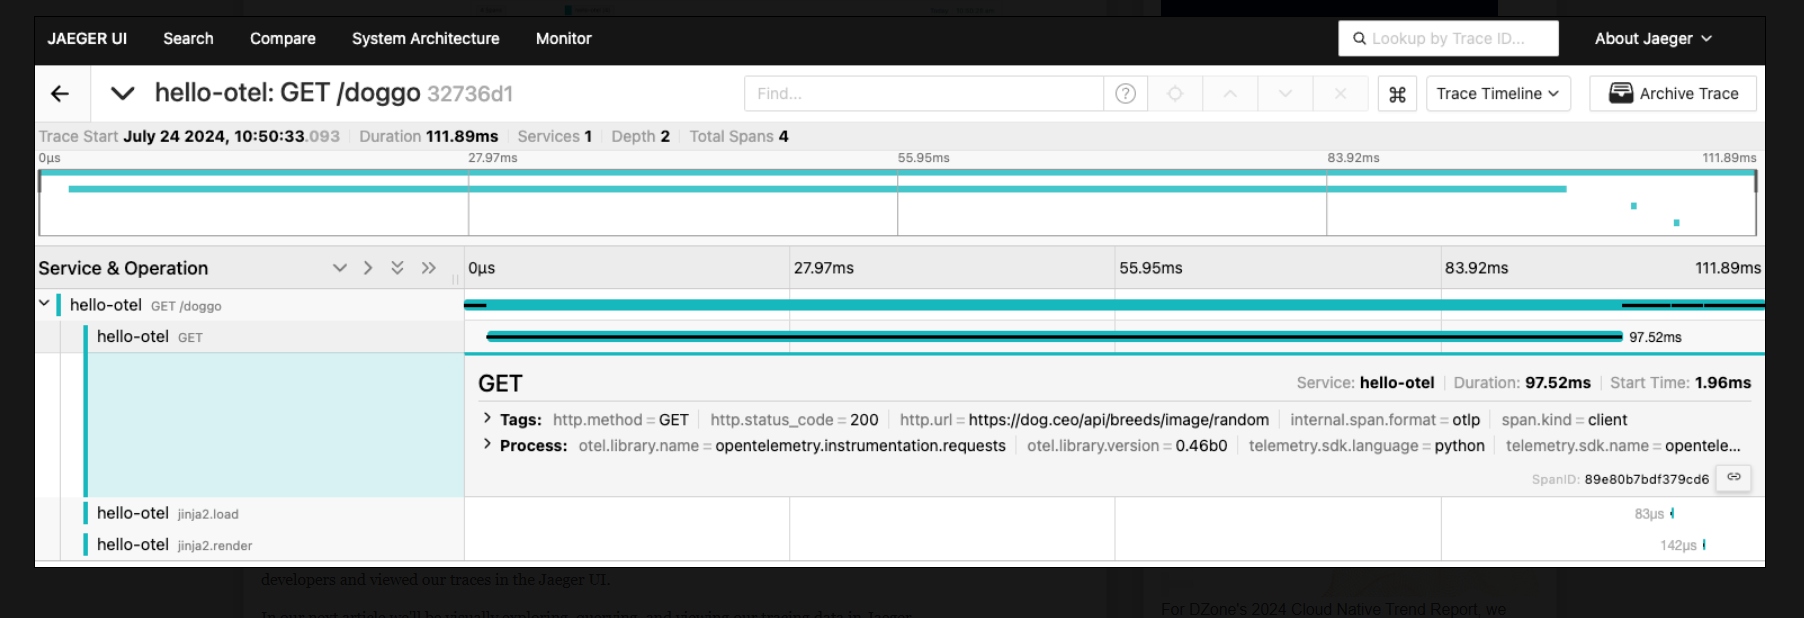
This completes the tour of programmatic instrumentation where we installed and configured OpenTelemetry API and SDK programmatically in our application, successfully sent traces, and finally configured our application to view our traces in the Jaeger UI.
These examples use code from a Python application that you can explore in the provided hands-on workshop.
What's Next?
This article completed our journey into programmatic instrumentation where we instrumented our application as developers and viewed our traces in the Jaeger UI.
In our next article, we'll be visually exploring, querying, and viewing our tracing data in Jaeger.
Published at DZone with permission of Eric D. Schabell. See the original article here.
Opinions expressed by DZone contributors are their own.
Comments