Pandas One Line Magical Code for EDA: Pandas Profile Report
A developer gives a quick tutorial on how to use Python and the pandas-profiling package to perform analyses on large data sets.
Join the DZone community and get the full member experience.
Join For FreeFor a lot of us, EDA may simply mean going deep into the data and finding some initial patterns and trends within the underlying data. It may also mean establishing correlations between variables to curate some interesting insights.
However, one thing that we as data analytics practioners cannot afford to overlook, which can potentially turn our data munging aspirations into an awry nightmare, is data hygiene or data quality. Therefore, in my opinion, data quality, description, shape, patterns, and relationships completes the EDA cycle.
Let's look at the EDA process from the perspective of various Python commands that not only showcase the level of effort but also indicates the level of complexity, when compared to a single line of code, i.e. pandas_profiling.ProfileReport() which makes data profiling and EDA process a breeze.

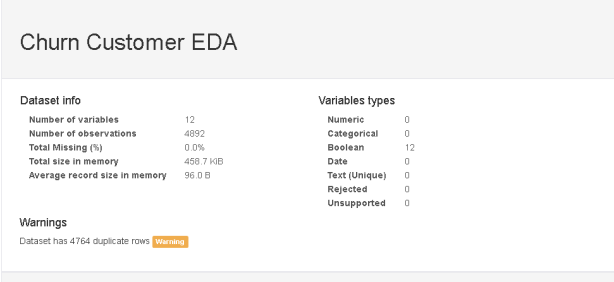
The pandas-profiling Python package is a great tool to create HTML profiling reports. For a given dataset, it computes the following statistics:
- Essentials: type, unique values, missing values.
- Quantile statistics like minimum value, Q1, median, Q3, maximum, range, interquartile range.
- Descriptive statistics like mean, mode, standard deviation, sum, median absolute deviation, coefficient of variation, kurtosis, skewness.
- Most frequent values.
- Histogram.
- Correlations highlighting of highly correlated variables, Spearman and Pearson matrixes.
Prerequisites:
- Install Python and Jupyter Notebook
- Install the pandas-profiling module
How to Use the pandas-profiling Package on a Dummy Data Set
After creating a new notebook (I am using a Google colab environment to run all the Python modules and libraries), we need to:
- Load Pandas and Pandas Profiling
- import pandas as pd
- import pandas_profiling
- Load data into a data frame

3. Run pandas-profile's report command:

4. Display the data profiling report:
The above is just the snapshot - there is more to this report!
You can view the complete EDA analysis on my GitHub Page.
The users can also export this report to the HTML format and can share with a larger audience.

Data profiling is the systematic up front analysis of the content of a data source, all the way from counting the bytes and checking cardinalities up to the most thoughtful diagnosis of whether the data can meet the high level goals of the data warehouse. - Ralph Kimball
You can refer more about this module here on GitHub.
Published at DZone with permission of Sunil Kappal. See the original article here.
Opinions expressed by DZone contributors are their own.
Comments