

Real-Time Recommendations Powered by Spanner, BigQuery, and Vector Embeddings
Through vector embeddings, this BigQuery and Spanner-powered system delivers real-time, personalized recommendations by capturing nuanced user and product similarities.
 ·
·
Join the DZone community and get the full member experience.
Join For FreeProduct recommendation systems are an integral part of a wide range of industries like e-commerce, retail, media and entertainment, financial services, etc. Product recommendation is crucial for both providers and consumers as it improves the overall consumer experience and increases sales.
Businesses collect and analyze a ton of consumer usage and behavior data to optimize their recommendations for purchase and user satisfaction. They strive to deliver these recommendations as soon as possible with the most up-to-date insights. Delays in showing relevant recommendations can result in lost sales and a bad experience for the consumer.
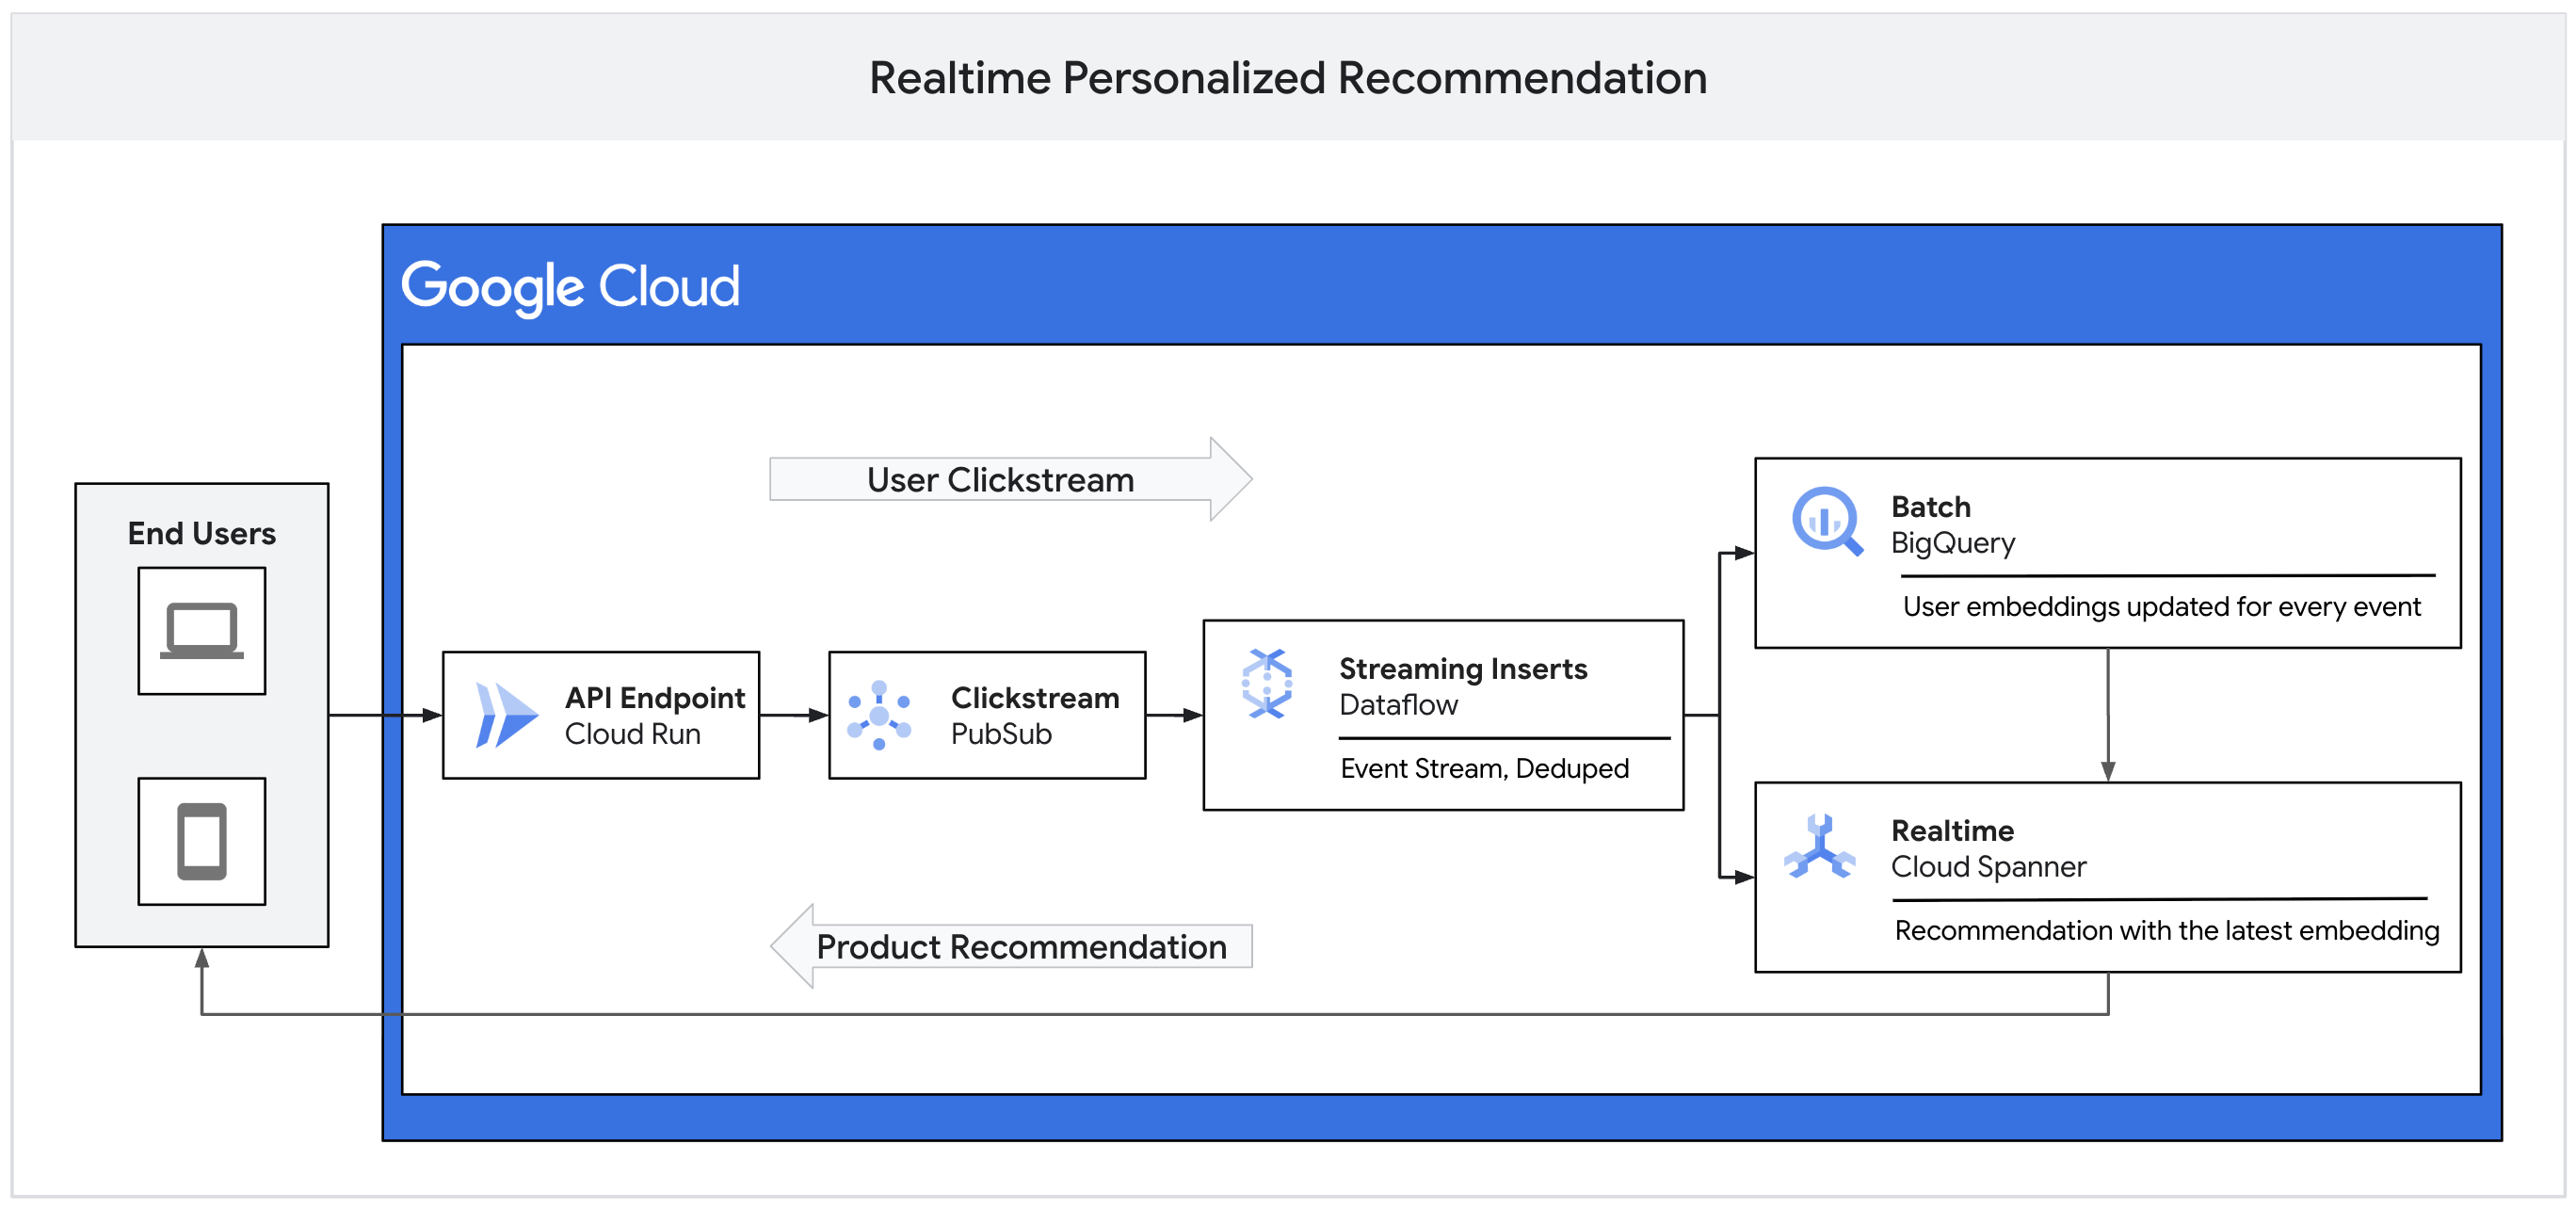
In this article, I would like to present a real-time recommendation system that operates on user and product vector embeddings and is powered by BigQuery (Google Cloud's fully managed, petabyte-scale data warehouse) and Spanner (Google Cloud's fully managed, mission-critical, global-scale database).
Vector Embeddings
Vector embeddings play a crucial role in generating recommendations. They capture user behavior, preferences, and intents based on their interaction with products or services. They also represent various features and attributes of a product or service. Vector embeddings do so by representing both users and products as high-dimensional numerical vectors. By computing distances between these vectors, we can measure similarities among products, among users, and between products and users.
Let's look at an example of vector embeddings. Below, we see two images: a baseball setup and a fishing setup. Feeding these images into Gemini and prompting something similar to "Generate a 64-dimensional vector embedding for these two images, keeping the dimensions the same for both embeddings" generates JSON arrays for two images with the same dimensions as described with the dimension labels in the images below.
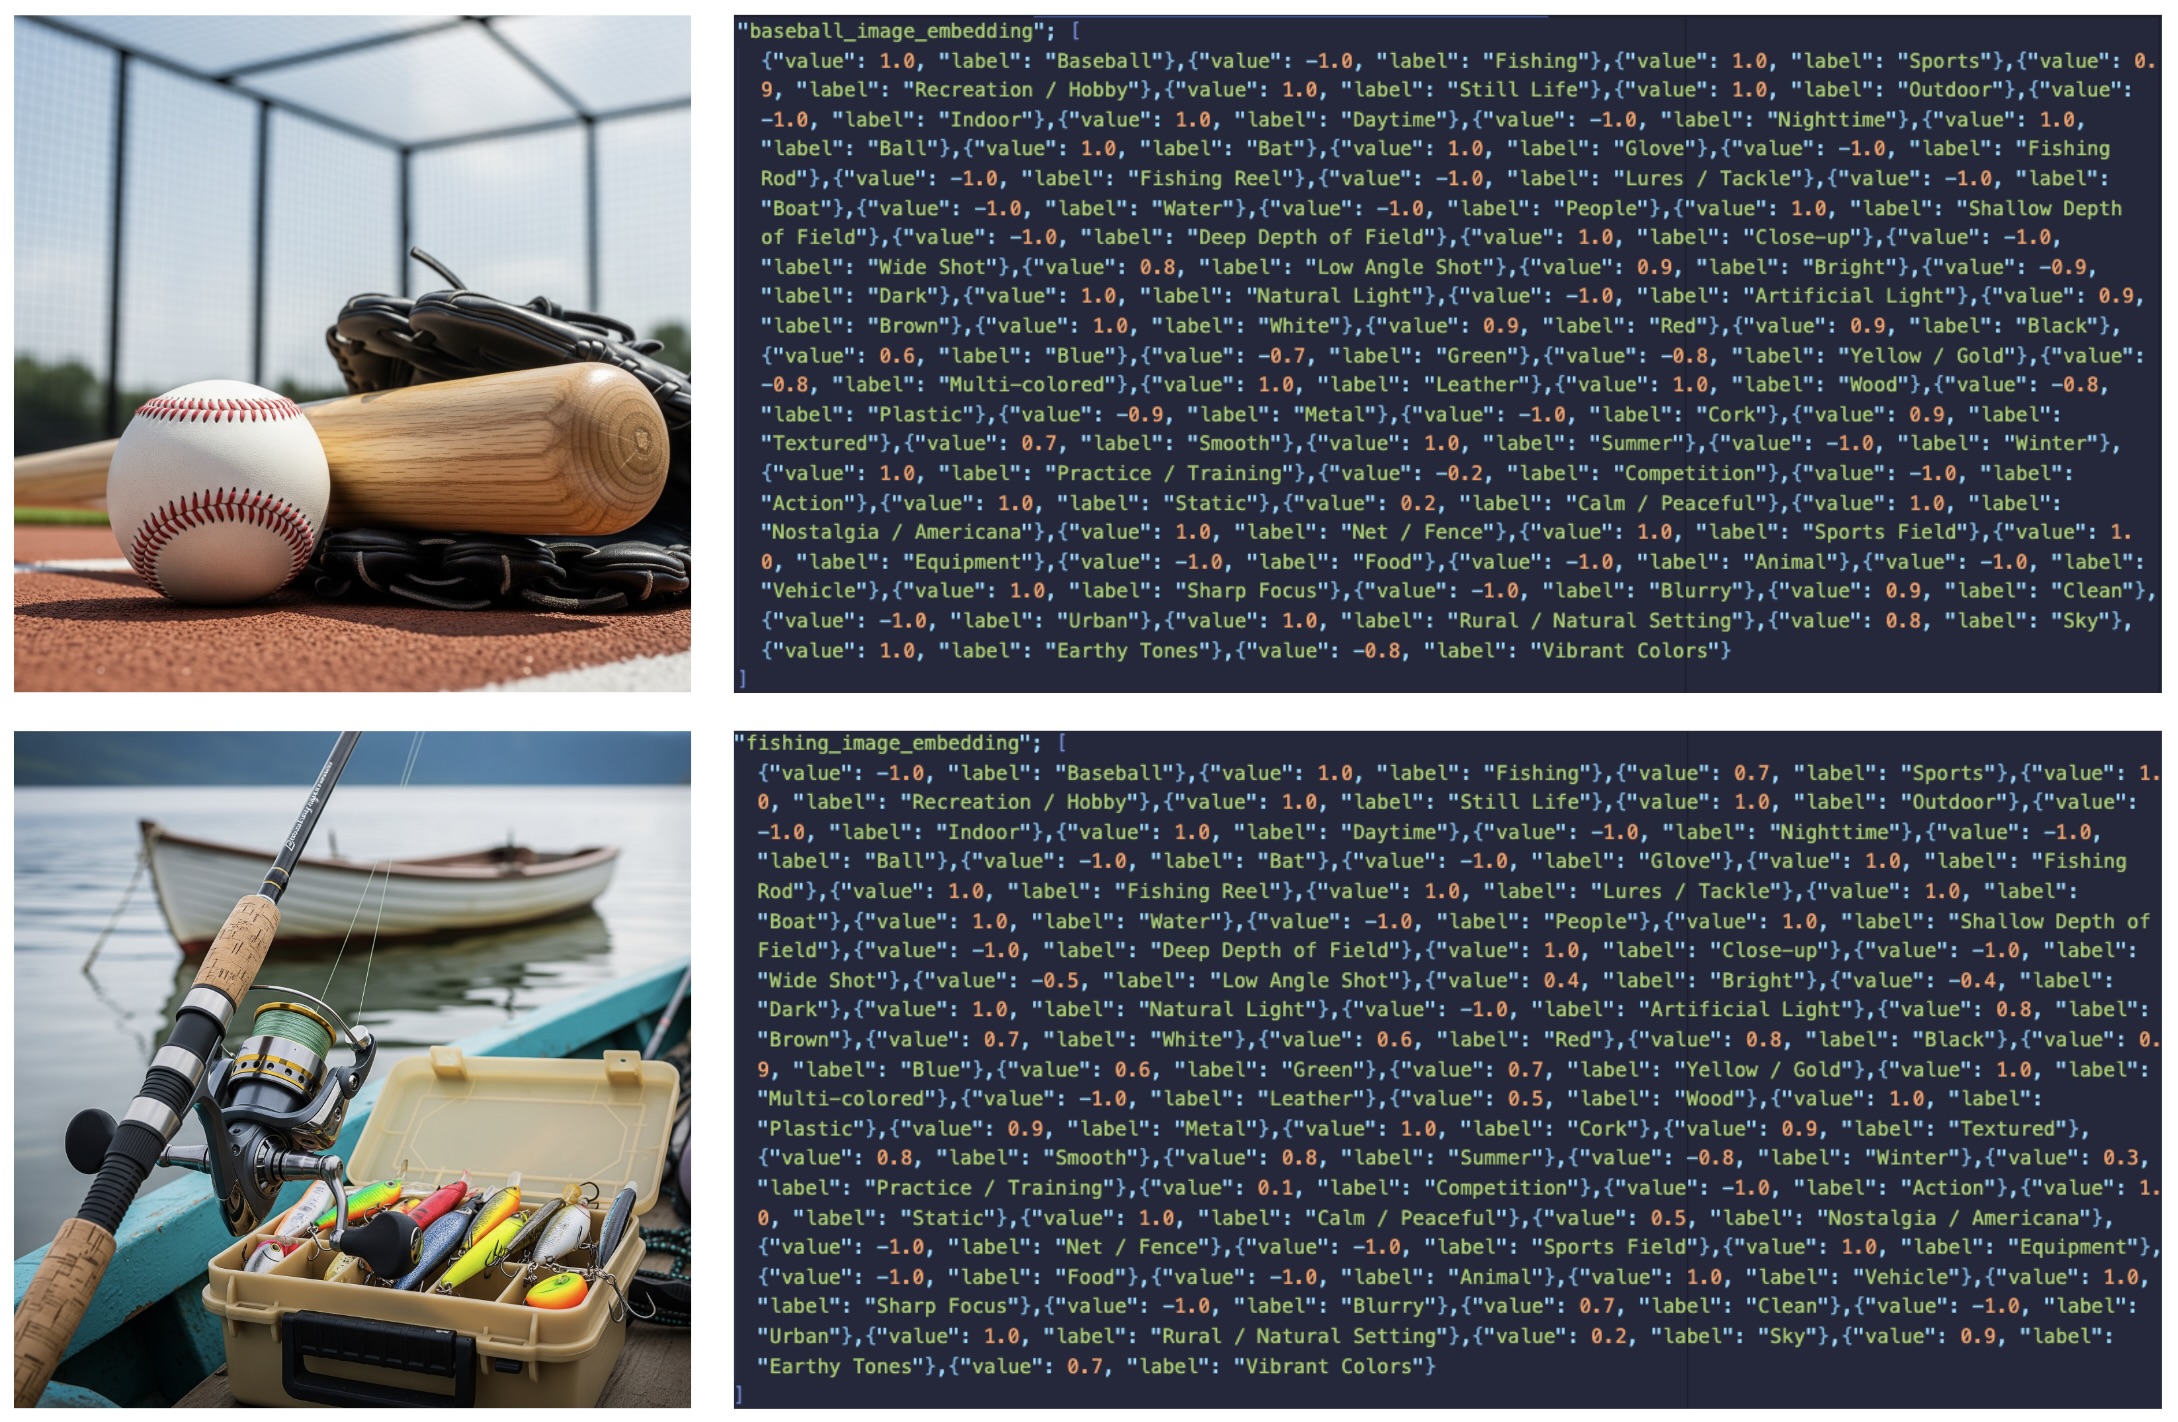
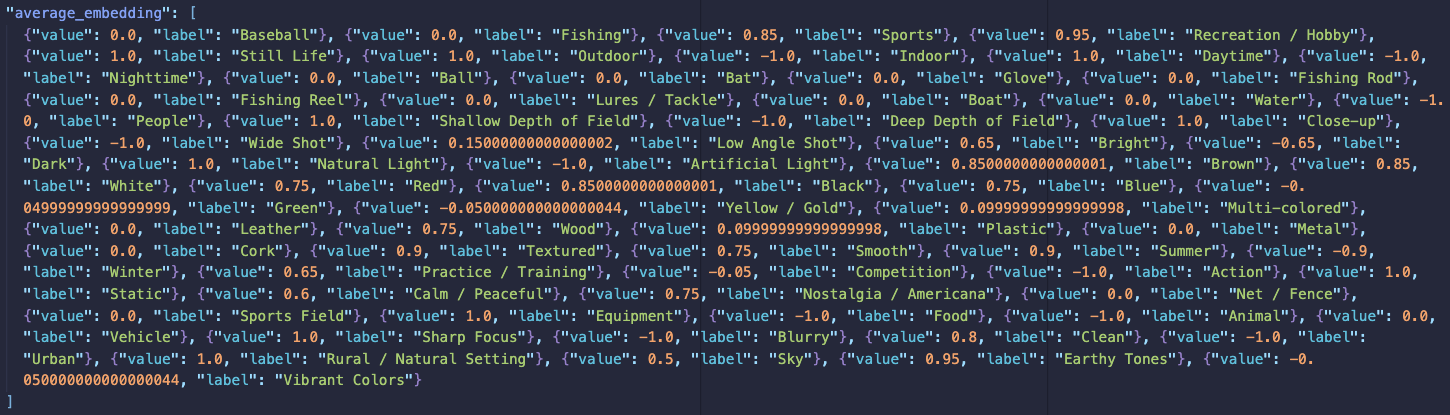
Now, let's say that the user interacts with the baseball images first. As part of this interaction, we update the user embedding by aggregating the baseball embeddings with the user's existing embeddings (assuming the user embedding has the same dimensions). In this example, we aggregate with a simple average, but based on your business rules and requirements, this can be either a weighted average or any other complex function. After interacting with the fishing image, the system averages out the two embedding vectors and applies that to the user embedding. The updated vector is shown below.
Batch With BQ
Depending on the user traffic on the website or app, the amount of data flowing through the pipeline can be huge. Based on their interactions, most users may not need immediate product recommendations. We collect and batch-process these high-volume, high-velocity user interaction feeds in BigQuery with target (website and app elements like images, banners, buttons, etc.) embeddings. We then perform rolling aggregations with previously computed user embeddings and update the final user embeddings. These user embeddings are then pushed out to Spanner (via reverse ETL mechanisms) for real-time product recommendations for a given user ID.
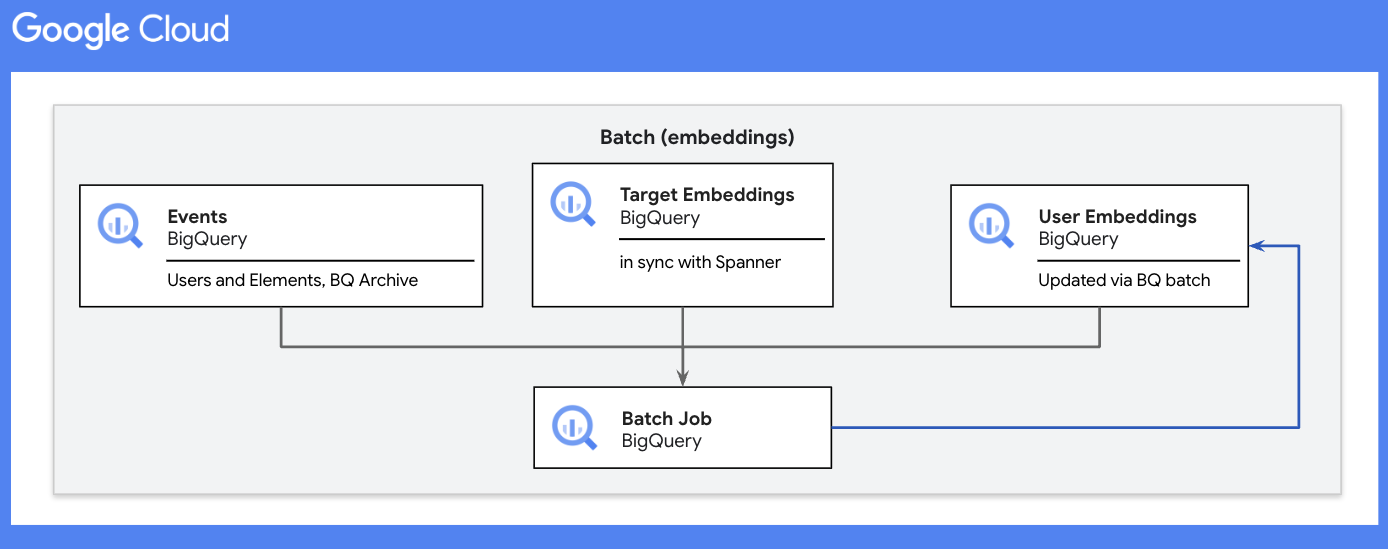
Batch processing steps:
- For the given batch duration, get distinct user IDs. This is to reduce the amount of data scanned from the user table in later steps.
- For the given batch duration, join the events table with the targets table to map the target embeddings to individual user-target interactions.
- Union all mapped embeddings with the respective user IDs from the users table.
- Calculate the rolling average of the embeddings across each dimension for the respective users.
- Append the updated embeddings to the users table.
---------------------------------------------------------------------------------------------
-- BQ Schema :
---------------------------------------------------------------------------------------------
-- dataset.events
--		user_id			String,
--		target_id		String,
-- 		ts			Timestamp

-- dataset.targets
--		target_id		String,
--		target_emb		String

-- dataset.users
--		user_id			String,
--		emb			String,
-- 		last_updated_ts		Timestamp
---------------------------------------------------------------------------------------------
WITH
  -- STEP 1
  dist_user_ids AS (
  SELECT
    DISTINCT events.user_id,
  FROM
    dataset.events
  WHERE
    events.ts >= $curr_batch_ts),
  -- STEP 2
  user_target_emb AS (
  SELECT
    events.user_id,
    1 AS target_count,
    targets.target_emb AS emb,
  FROM
    dataset.events events
  JOIN
    dataset.targets targets
  ON
    events.target_id = targets.target_id
  WHERE
    events.ts >= $curr_batch_ts
    -- STEP 3
  UNION ALL
  SELECT
    usres.user_id,
    users.target_count,
    users.emb,
  FROM
    dataset.users users
  JOIN
    dist_user_ids
  ON
    users.user_id = dist_user_ids.user_id),
  -- STEP 4
  emb_average AS (
  SELECT
    user_target_emb.user_id,
    idx,
    SUM(user_target_emb.target_count) AS target_count,
    SUM(user_target_emb.target_count * emb_val)/SUM(user_target_emb.target_count) new_emb_val
  FROM
    user_target_emb,
    UNNEST(user_target_emb.emb) emb_val
  WITH
  OFFSET
    AS idx
  GROUP BY
    1,
    2),
  updated_user_embeddings AS (
  SELECT
    user_id,
    ANY_VALUE(target_count) AS target_count,
    ARRAY_AGG(new_emb_val
    ORDER BY
      idx) AS new_emb
  FROM
    emb_average
  GROUP BY
    1 )
  -- STEP 5
SELECT
  user_id,
  target_count,
  new_emb AS emb,
  CURRENT_TIMESTAMP() AS last_updated_ts
FROM
  updated_user_embeddings;
Real-Time With Spanner
The updated user embeddings for the latest batch are pushed out to the corresponding Spanner table via Reverse ETL. The corresponding table for target embeddings is also maintained in Spanner.
Event streams data in Spanner is needed only for the timestamps that are newer than the current batch being processed in BigQuery. We can schedule a job or assign TTL markers to periodically clean up this table.
In addition to the events, users, and targets tables, we also maintain the assets table, which holds the prediction assets for personalized recommendations. These assets have their own embeddings that match the dimensionality of the user and target embeddings.
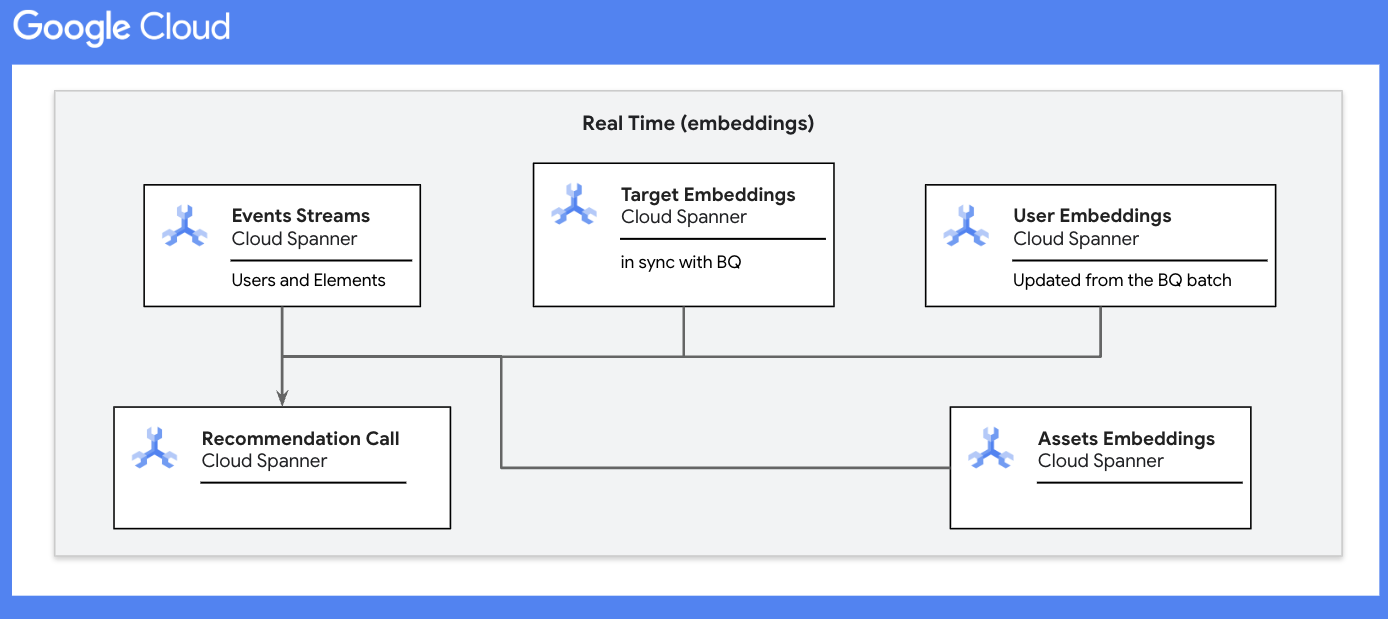
When the prediction call comes in from the frontend for a given user:
- All the latest events for that user are joined with the targets table to map the target embeddings to individual user-target interactions.
- Union all mapped embeddings with the respective user IDs from the users table.
- Calculate the final rolling average of the embeddings across each dimension for the given user.
- The final user embedding is then used to calculate the distance from the assets.
- The n closest assets are returned as part of the personalized recommendation prediction.
  ---------------------------------------------------------------------------------------------
  -- Spanner Schema :
  ---------------------------------------------------------------------------------------------
  -- events
  --		user_id			String,
  --		target_id		String,
  -- 		ts			Timestamp
  -- targets
  --		target_id		String,
  --		target_emb		String
  -- users
  --		user_id			String,
  --		emb			String,
  -- 		last_updated_ts		Timestamp
  -- assets
  --		asset_id		String,
  --		asset_emb		String,
  ---------------------------------------------------------------------------------------------
WITH
  -- STEP 1
  user_target_emb AS (
  SELECT
    events.user_id,
    1 AS target_count,
    targets.target_emb AS emb,
  FROM
    events
  JOIN
    targets
  ON
    events.target_id = targets.target_id
  WHERE
    events.user_id = "$user_id"
    -- STEP 2
  UNION ALL
  SELECT
    usres.user_id,
    users.target_count,
    users.emb,
  FROM
    users
  WHERE
    users.user_id = "$user_id" ),
  -- STEP 3
  emb_average AS (
  SELECT
    idx,
    SUM(user_target_emb.target_count * emb_val)/SUM(user_target_emb.target_count) new_emb_val
  FROM
    user_target_emb,
    UNNEST(user_target_emb.emb) emb_val
  WITH
  OFFSET
    AS idx
  GROUP BY
    1),
  updated_user_embeddings AS (
  SELECT
    ARRAY_AGG(new_emb_val
    ORDER BY
      idx) AS new_emb
  FROM
    emb_average ),
  -- STEP 4
  distances AS (
  SELECT
    asset_id,
    EUCLIDEAN_DISTANCE((
      SELECT
        new_emb
      FROM
        updated_user_embeddings),
      assets.asset_emb) AS distance,
  FROM
    assets)
  -- STEP 5
SELECT
  asset_id,
  distance
FROM
  distances
ORDER BY
  2 DESC
LIMIT
  $n
Conclusion
Based on the business requirements and guidelines, the front-end system will decide which product to show to the user as a final recommendation. This can be as simple as one with the shortest distance or a complex decision process with re-ranking of the predictions.
Putting it all together:
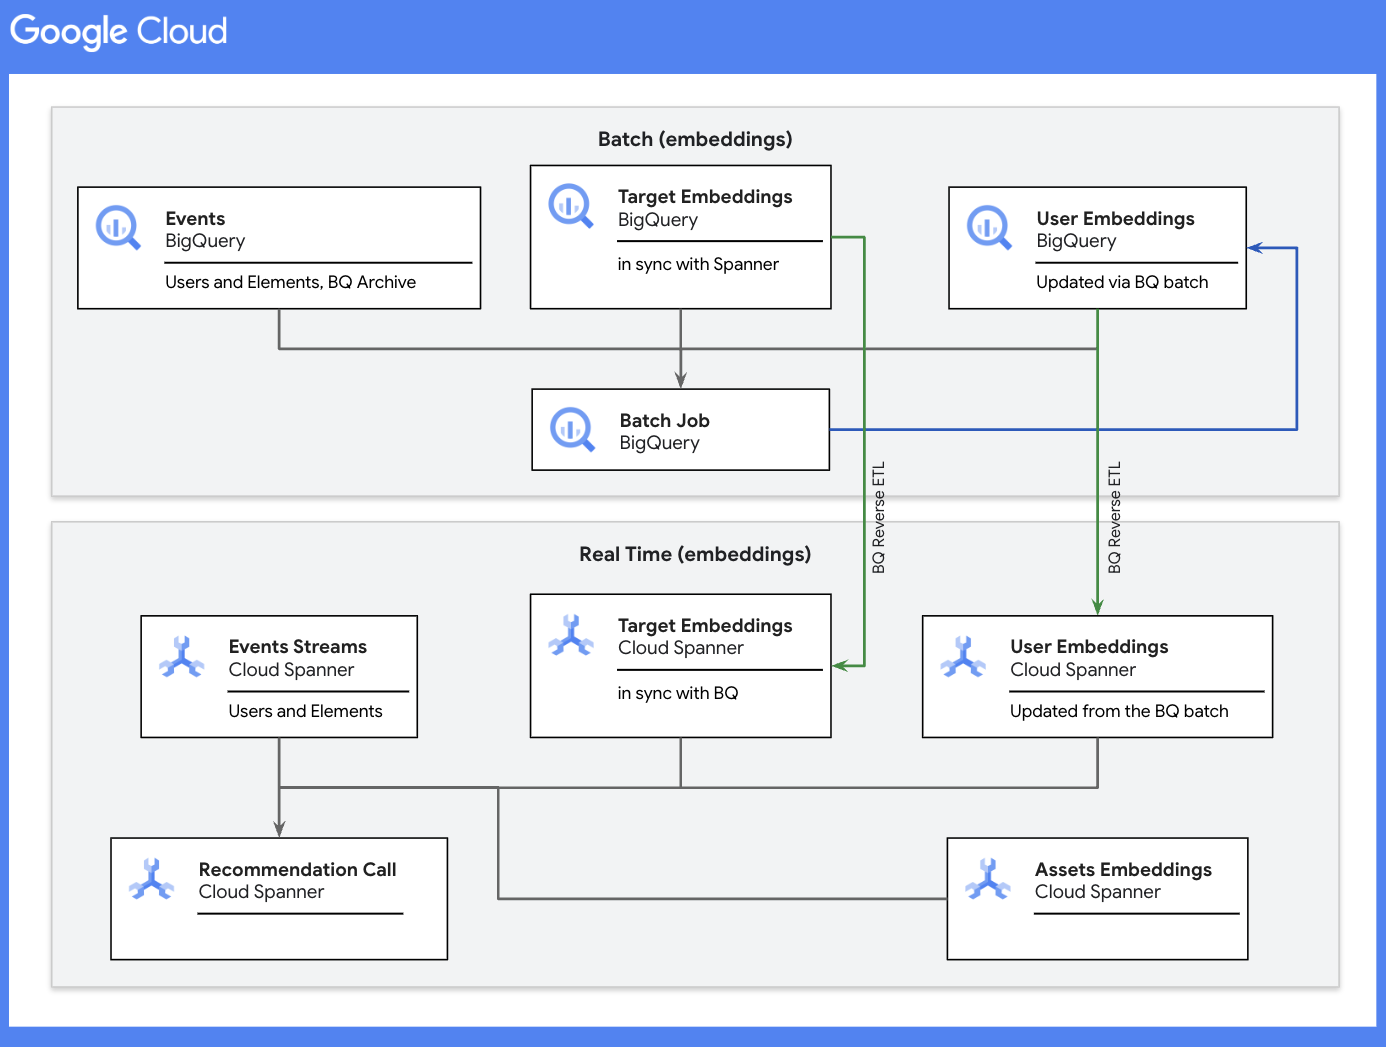
As seen above, with this combination of real-time and batch processes, we take into account each and every user interaction and are able to recommend products and services that are relevant to the users in the context of their current 'space and time'!
This architecture is also elastic in nature and can scale depending on the user traffic and application requirements.
Opinions expressed by DZone contributors are their own.
Comments