The Repo Tracker: Automating My Daily GitHub Catch-Up
Automate GitHub repo tracking with a local agent using Python, SQLite, and cron. Learn how to build a lightweight monitoring system for open-source projects.
Join the DZone community and get the full member experience.
Join For FreeWe all have that daily routine: opening a dozen browser tabs to check the health and progress of our favorite open-source projects. For me, it’s keeping a close eye on rapidly evolving ecosystems like Docling and the watsonx Agent Development Kit (ADK). Eventually, the manual refreshing had to stop. I decided to build a custom application to automate this workflow — or more accurately, a dedicated Agent.
Before you write off “Agent” as just another industry buzzword, consider this: true agency isn’t just about complex LLM reasoning; it’s about autonomous execution. An agent bridges the gap between manual human effort and automated consistency, stepping in to handle what used to require our click-by-click attention.
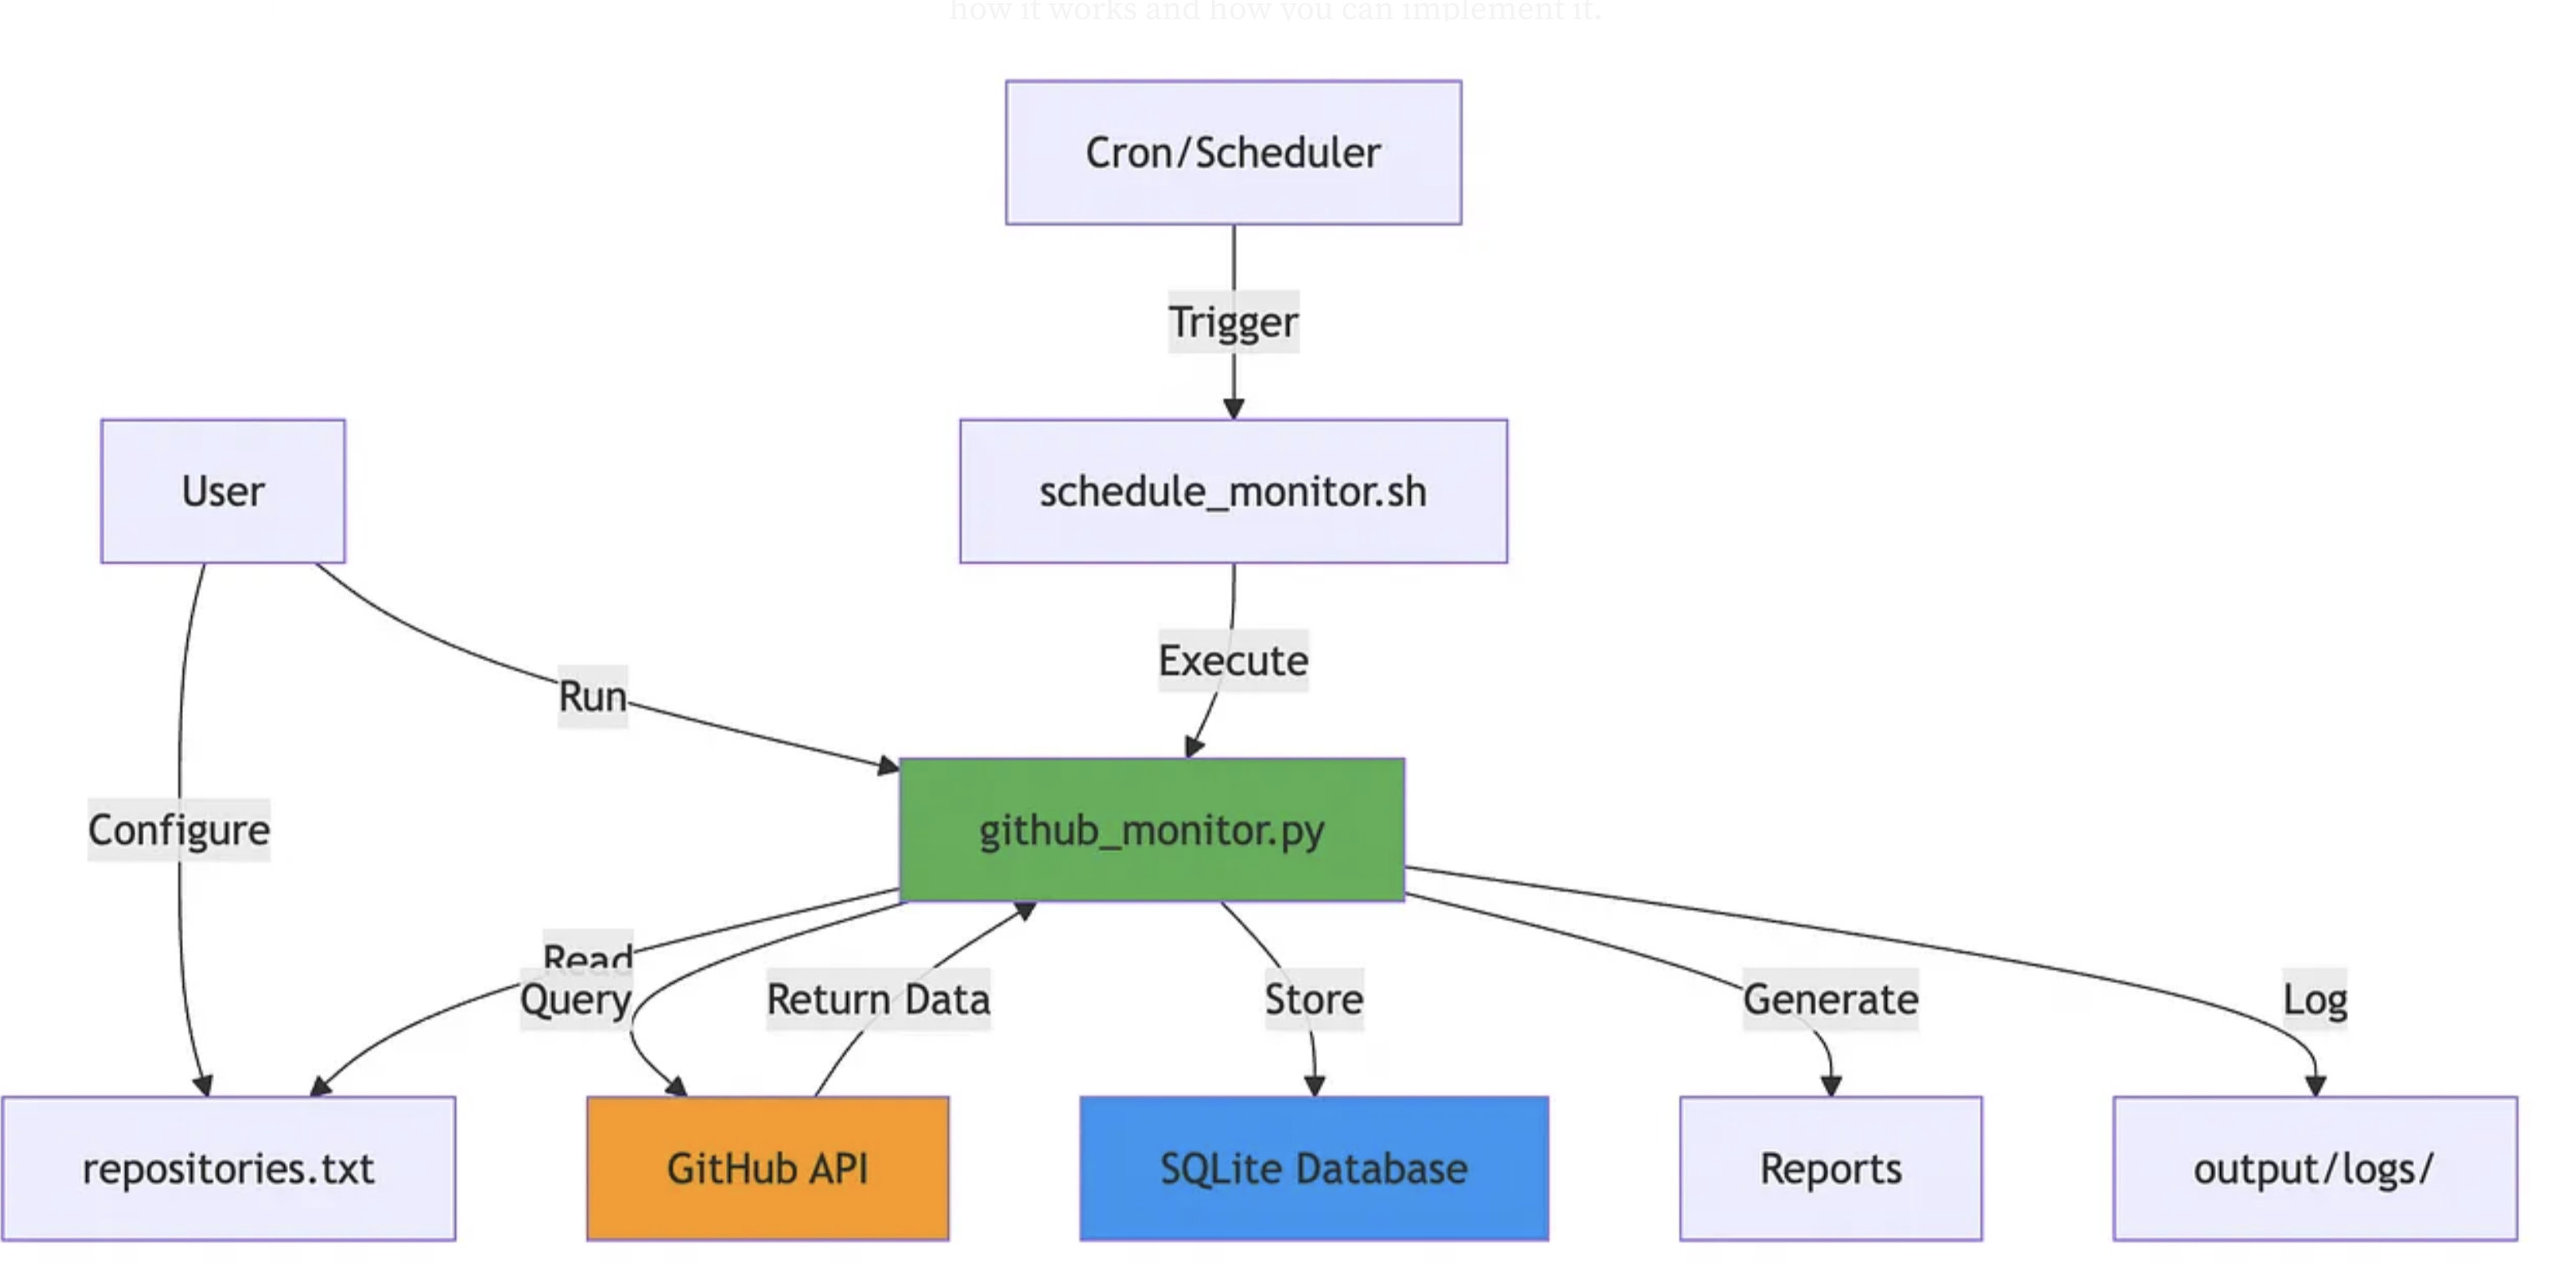
Here is how I built an automated companion to keep my pulse on the tech stacks that matter: by taking over the repetitive task of repository tracking, this tool operates as a functional agent in my development ecosystem. In this post, I’ll break down how it works and how you can implement it.
Implementation
In the following section, I’ll walk through the building block of the agent.
Building Blocks: The Tech Stack
To keep the footprint light, local, and efficient, the tool is built on a streamlined, minimal-dependency stack:
- Python 3: Handles the core application logic, parsing repository data, and orchestrating updates.
- SQLite: Acts as a lightweight, serverless database engine to persist repository states and track changes between runs.
- Bash: Bridges the application and the operating system, wrapping the execution logic into a clean, reproducible script.
- macOS &
cron: Leverages native system utilities to handle automation and schedule regular execution intervals without relying on heavy third-party orchestrators.
The Core Application
github-check/
├── github_monitor.py          # Main monitoring application
├── web_viewer.py              # Web dashboard application (Flask)
├── github_monitor.db          # SQLite database (auto-created)
├── requirements.txt           # Python dependencies (requests, flask)
├── .gitignore                 # Git ignore rules (filters .env, _* folders)
├── .gitattributes             # Git attributes configuration
├── LICENSE                    # Project license
├── README.md                  # User documentation with diagrams
│
├── Docs/
│   ├── Architecture.md        # This file - Technical architecture
│   └── WebViewer.md           # Web dashboard documentation
│
├── scripts/
│   ├── schedule_monitor.sh    # Cron scheduler script
│   ├── github-push.sh         # Git push automation script
│   ├── killer-port.sh         # Port management utility
│   └── hard-killer-port.sh    # Force kill port utility
│
├── input/
│   └── repositories.txt       # Repository list (owner/repo format)
│
├── output/
│   ├── logs/                  # Execution logs (from cron)
│   │   └── YYYYMMDD_HHMMSS_monitor.log
│   └── YYYYMMDD_HHMMSS_report.txt  # Generated reports
│
├── templates/
│   └── index.html             # Web dashboard HTML template
│
└── static/
    ├── css/
    │   └── style.css          # Dashboard styles (dark theme)
    └── js/
        └── app.js             # Dashboard JavaScript (Chart.js, API calls)
Core Initialization and State Management
The application uses an object-oriented approach via the GitHubMonitor class. Upon instantiation, it handles its own database initialization using sqlite3. It creates two core tables—repositories and updates—utilizing indexes on frequently queried fields (repo_name and update_timestamp) to ensure quick lookups as your monitored list grows.
def _init_database(self):
    """Initialize SQLite database with required schema."""
    conn = sqlite3.connect(self.db_path)
    cursor = conn.cursor()

    cursor.execute('''
        CREATE TABLE IF NOT EXISTS repositories (
            id INTEGER PRIMARY KEY AUTOINCREMENT,
            repo_name TEXT UNIQUE NOT NULL,
            first_checked_at TEXT NOT NULL,
            last_checked_at TEXT NOT NULL
        )
    ''')
    # ... updates table creation omitted for brevity ...
    cursor.execute('''
        CREATE INDEX IF NOT EXISTS idx_repo_name ON repositories(repo_name)
    ''')
    conn.commit()
    conn.close()
Resilient API Communication
To interface with GitHub, the application utilizes a persistent requests.Session(). It is designed to safely handle unauthenticated requests while seamlessly embedding a personal access token (GITHUB_TOKEN) from the environment variables to bypass restrictive API rate limits. It also includes explicit HTTP status error handling (like 403 for rate limits and 404 for missing repos) alongside network timeout guards.
self.github_token = os.getenv('GITHUB_TOKEN')  # Optional: for higher rate limits
self.session = requests.Session()

if self.github_token:
    self.session.headers.update({'Authorization': f'token {self.github_token}'})

# ... Inside _get_repo_info ...
response = self.session.get(url, timeout=10)
if response.status_code == 200:
    return response.json()
elif response.status_code == 403:
    print(f"✗ Rate limit exceeded. Consider using GITHUB_TOKEN environment variable.")
    return None
Delta Detection Logic
The core engine reads target repositories from a flat file (ignoring comments and whitespace) and loops through them. For each repository, it extracts the API’s pushed_at timestamp. It then checks the database to determine if the repository is brand new or if the remote timestamp differs from the last_checked state inside the DB, validating it against a configurable sliding time window (check_days).
# Check if repo is in database
exists, repo_id, last_checked = self._is_repo_in_db(repo_name)

if not exists:
    # First time seeing this repo
    repo_id = self._add_repository(repo_name, pushed_at)
    self._log_update(repo_id, repo_name, pushed_at, is_first_run=True)
else:
    # Check if there's a recent update and if it's a new update since last check
    if self._has_recent_update(pushed_at):
        if pushed_at != last_checked:
            self._log_update(repo_id, repo_name, pushed_at, is_first_run=False)
            print(f"  UPDATE DETECTED!")
Automated Auditing and Reporting
Beyond real-time monitoring stdout logs, the application aggregates state tracking into a clean historical markdown-style report. It runs complex SQL joins to count the frequency of updates per repository and isolates the latest ten global changes. The system automatically creates a dedicated output/ directory and writes time-stamped files to ensure snapshots are preserved for long-term auditing.
# Get all repositories with aggregated update counts
cursor.execute('''
    SELECT r.repo_name, r.first_checked_at, r.last_checked_at,
           COUNT(u.id) as update_count
    FROM repositories r
    LEFT JOIN updates u ON r.id = u.repo_id
    GROUP BY r.id
    ORDER BY r.repo_name
''')
# ... Report file generation ...
if output_file:
    timestamp = datetime.now(timezone.utc).strftime("%Y%m%d_%H%M%S")
    output_path = f"output/{timestamp}_{output_file}"
    os.makedirs("output", exist_ok=True)
    with open(output_path, 'w') as f:
        f.write(report)
The Bash Script
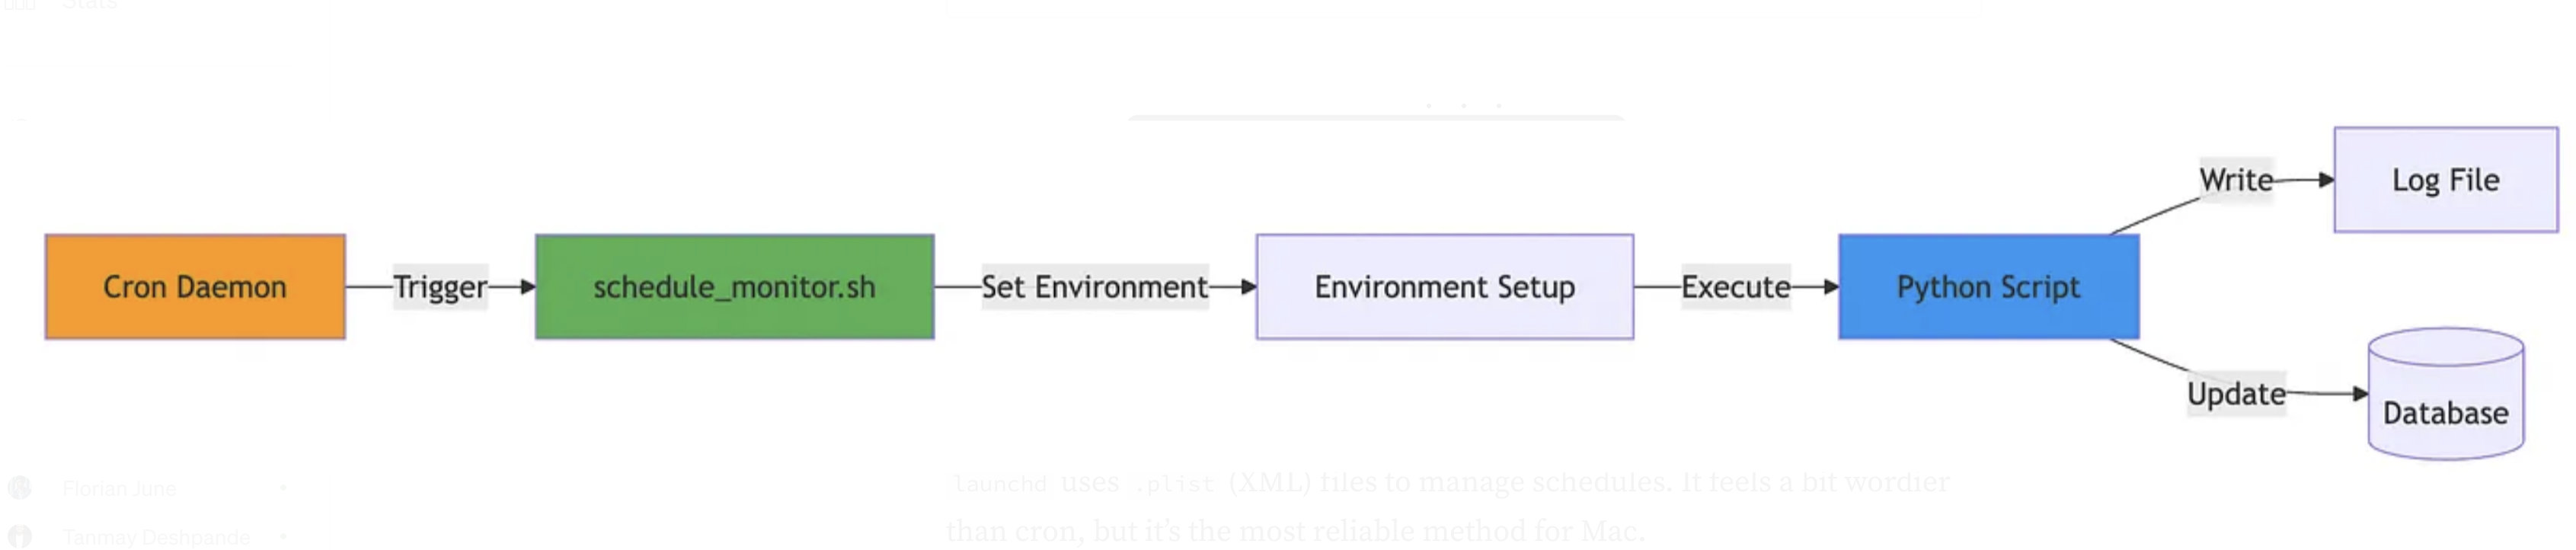
Hereafter the schedule_monitor.sh bash script, which prepares, executes, and maintains the automated tracking application.
Dynamic Path Resolution
Instead of relying on rigid, hardcoded absolute paths, the script begins by dynamically resolving its own location relative to the filesystem. By using dirname and the BASH_SOURCE environment variable, it anchors itself securely to the project layout. This ensures that no matter where the cron daemon triggers the script from, it can always accurately find the target Python application (github_monitor.py) and establish a consistent execution working directory.
Automated Logging and Diagnostics
Because a background cron job runs without a visual terminal (stdout), tracking down execution errors requires an audit trail. The script handles this by isolating a dedicated logs directory (output/logs) and utilizing a date-and-time string (date +"%Y%m%d_%H%M%S") to generate a unique file for every single runtime iteration. It appends clear timestamp banners marking exactly when a check started and concluded.
Environment Validation and Execution
Before attempting to launch the monitor, the script safely checks the host machine’s environment for valid runtimes. It runs a quiet check (command -v) to see if python3 or a fallback python command is accessible. If a Python binary is found, it triggers the underlying script, passing down the configurable time-window argument (--days 1) while explicitly routing both standard output and potential error stack traces (2>&1) straight into the active log file.
Self-Cleaning Log Retention
Running automated tasks indefinitely carries the risk of slowly cluttering local storage with thousands of historical text files. To enforce clean housekeeping, the script concludes its run with an automated garbage-collection routine. It uses the native Unix find command to scan the log directory, isolates any tracking logs older than 30 days (-mtime +30), and automatically purges them from the system.
#!/bin/bash
# GitHub Repository Monitor Scheduler
# This script can be used with cron to schedule regular checks

# Configuration
SCRIPT_DIR="$(cd "$(dirname "${BASH_SOURCE[0]}")" && pwd)"
PROJECT_DIR="$(dirname "$SCRIPT_DIR")"
PYTHON_SCRIPT="$PROJECT_DIR/github_monitor.py"
LOG_DIR="$PROJECT_DIR/output/logs"
CHECK_DAYS=1

# Create log directory if it doesn't exist
mkdir -p "$LOG_DIR"

# Generate timestamp for log file
TIMESTAMP=$(date +"%Y%m%d_%H%M%S")
LOG_FILE="$LOG_DIR/${TIMESTAMP}_monitor.log"

# Run the monitor and log output
echo "=== GitHub Monitor Run: $(date) ===" >> "$LOG_FILE"
cd "$PROJECT_DIR" || exit 1

# Check if Python 3 is available
if command -v python3 &> /dev/null; then
    PYTHON_CMD="python3"
elif command -v python &> /dev/null; then
    PYTHON_CMD="python"
else
    echo "Error: Python not found" >> "$LOG_FILE"
    exit 1
fi

# Run the monitor
$PYTHON_CMD "$PYTHON_SCRIPT" --days "$CHECK_DAYS" >> "$LOG_FILE" 2>&1

# Log completion
echo "=== Completed: $(date) ===" >> "$LOG_FILE"
echo "" >> "$LOG_FILE"

# Optional: Keep only last 30 days of logs
find "$LOG_DIR" -name "*.log" -type f -mtime +30 -delete

exit 0

# Made with Bob
TL;DR: How to Make a Cron Job on a macOS Machine?
There are several ways to do this on a macOS (my machine).
The Modern macOS Way (launchd)
launchd uses .plist (XML) files to manage schedules. It feels a bit wordier than cron, but it’s the most reliable method for Mac.
Create a .plist file: open your terminal or a text editor and create a file in ~/Library/LaunchAgents/. Let's call it com.user.myjob.plist.
Add the configuration: paste the following XML into the file. This example is set to run a script every day at 10:30 PM (22:30).
<?xml version="1.0" encoding="UTF-8"?>
<!DOCTYPE plist PUBLIC "-//Apple//DTD PLIST 1.0//EN" "http://www.apple.com/DTDs/PropertyList-1.0.dtd">
<plist version="1.0">
<dict>
    <key>Label</key>
    <string>com.user.myjob</string>

    <key>ProgramArguments</key>
    <array>
        <string>/Users/yourusername/scripts/myscript.sh</string>
    </array>

    <key>StartCalendarInterval</key>
    <dict>
        <key>Hour</key>
        <integer>22</integer>
        <key>Minute</key>
        <integer>30</integer>
    </dict>

    <key>StandardOutPath</key>
    <string>/tmp/myjob.out</string>
    <key>StandardErrorPath</key>
    <string>/tmp/myjob.err</string>
</dict>
</plist>
Load and start the job: in the Terminal, tell macOS to look at the new file and start scheduling it:
launchctl bootstrap gui/$(id -u) ~/Library/LaunchAgents/com.user.myjob.plistIf you need to stop it or unload or cancel the job, run:
launchctl bootout gui/$(id -u) ~/Library/LaunchAgents/com.user.myjob.plist
The Classic Way (cron)
If you prefer the classic Linux/Unix crontab style because you already know the syntax, macOS can still do it.
Open the crontab editor (in the terminal, and you’ll get something like vim);
crontab -eAdd your cron syntax: add the job using the standard 5-asterisk cron formatting. For example, to run a script every day at midnight:
0 0 * * * /Users/yourusername/scripts/myscript.shSave and exit!
The Crucial macOS Step for Cron
Because of macOS security restrictions, cron will often fail silently because it doesn’t have permission to access your files. You have to grant it access:
- Open System Settings > Privacy & Security > Full Disk Access.
- Click the
+icon. - Press
Cmd + Shift + Gand type/usr/sbin/cron, then hit enter. - Toggle the switch to On for
cron.
Which one should to choose?
Use
launchdif you want your job to reliably run even if your MacBook lid was closed/asleep at the exact minute it was scheduled to trigger.Use
cronif you just need something quick and familiar for a desktop Mac that is always awake.
The Database (SQLite)
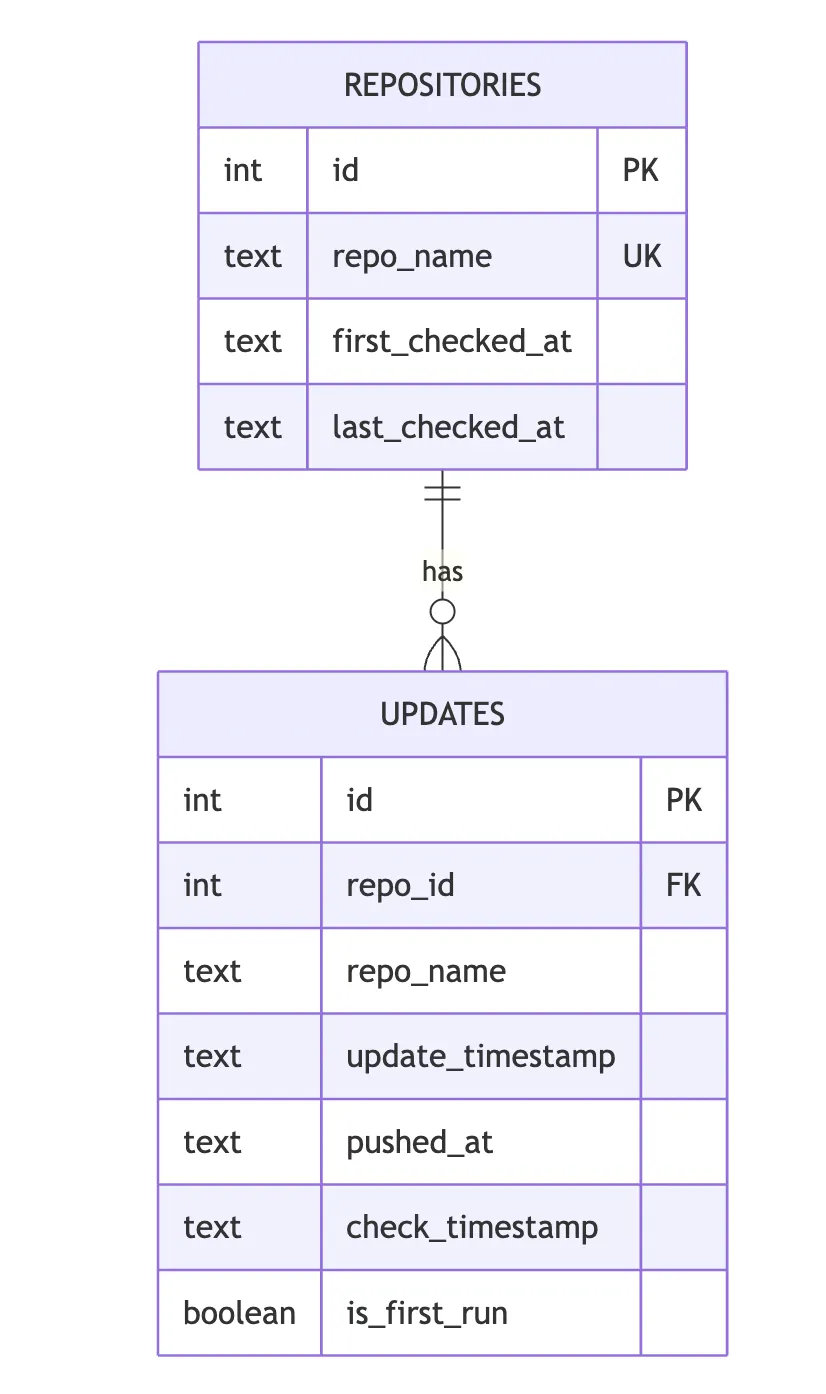
The repositories Table
This table acts as the registry for the GitHub repositories you choose to track. It records when a repository was first introduced to the monitor and mirrors its remote state by tracking the latest push timestamp.
id(INTEGER PRIMARY KEY AUTOINCREMENT): Unique internal identifier for each repository, used as the primary key.repo_name(TEXT UNIQUE NOT NULL): The full GitHub identifier in theowner/repositoryformat (e.g.,IBM/watsonx-adkorDSUR/docling). TheUNIQUEconstraint guarantees that a repository cannot be duplicated in the registry.first_checked_at(TEXT NOT NULL): An ISO 8601 UTC timestamp capturing the exact moment the repository was first indexed by your application.last_checked_at(TEXT NOT NULL): Stores the latestpushed_attimestamp fetched from the GitHub API. This field is overwritten whenever a new delta/update is detected, serving as the benchmark for future comparisons.
The updates Table
This table functions as a historical append-only ledger. Every time the tool encounters a change (or indexes a repository for the first time), it appends a record here, creating a reliable audit trail of project activity.
id(INTEGER PRIMARY KEY AUTOINCREMENT): Unique identifier for each specific update record.repo_id(INTEGER NOT NULL): Foreign key referencingrepositories(id), establishing a 1:N relationship (one repository can have many logged updates).repo_name(TEXT NOT NULL): Denormalized repository name to allow quick querying of logs without mandatory joins.update_timestamp/pushed_at(TEXT NOT NULL): Thepushed_attimestamp provided directly by the GitHub API API, indicating when the remote change actually occurred.check_timestamp(TEXT NOT NULL): An ISO 8601 UTC timestamp capturing when your local agent executed and caught the update.is_first_run(BOOLEAN NOT NULL): A flag (0or1) tracking whether this log entry represents the initial discovery of the repository or a subsequent update.
Relationship Diagram
The database structure relies on standard relational integrity:
Optimization Indexes
To prevent execution slowdowns as your tracking history grows over months of automated cron cycles, the database explicitly initializes two performance indexes:
idx_repo_nameonrepositories(repo_name): Pre-sorts rows by repository name. This ensures that when the application calls_is_repo_in_db()to check if a project exists, SQLite performs an O(logn) binary search instead of an expensive O(n) full-table scan.idx_update_timestamponupdates(update_timestamp): Optimizes time-series queries, sorting updates by their timestamps to speed up reports or dashboards isolating recent changes.
Data Storage Details
- Serverless and Local: Because SQLite is an in-process library, the entire database is stored as a single, ordinary cross-platform file (
github_monitor.db) directly within your project directory. - Dynamic Typing (Storage Classes): SQLite uses dynamic type affinity. While the schema declares standard SQL types like
TEXTandBOOLEAN, dates are stored as ISO 8601 text strings. Booleans are managed natively by SQLite as integers (0for false,1for true).
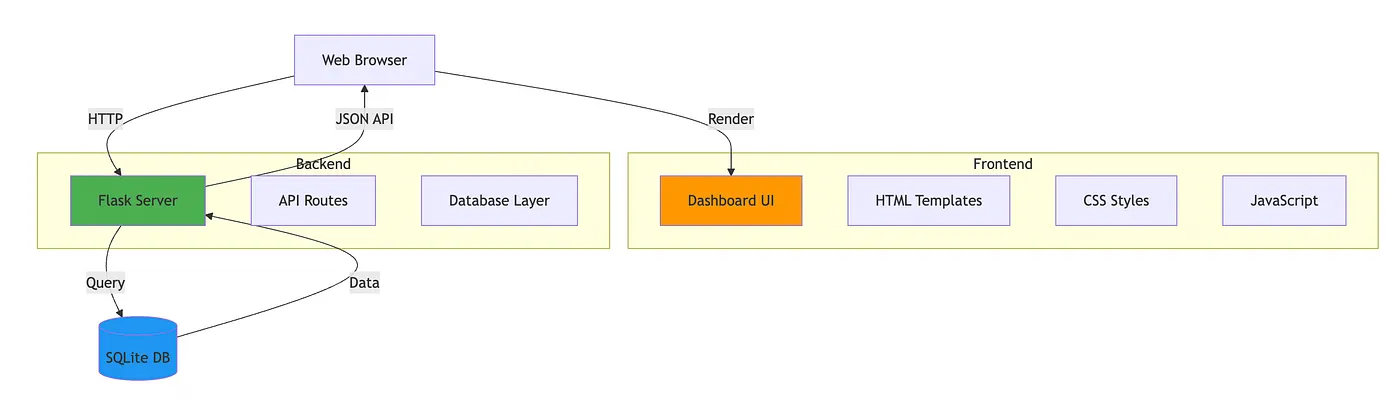
The User Interface to Monitor the Results and Access the Repositories
# web_viewer.py
Flask App
├── Routes
│ ├── index() -> Dashboard HTML
│ ├── get_stats() -> Statistics JSON
│ ├── get_repositories() -> Repositories JSON
│ ├── get_updates() -> Updates JSON
│ ├── get_timeline() -> Timeline JSON
│ └── get_repository_details(id) -> Repository JSON
│
├── Utilities
│ ├── get_db_connection() -> SQLite connection
│ └── format_timestamp() -> Formatted date string
│
└── Configuration
├── DB_PATH = 'github_monitor.db'
├── HOST = '127.0.0.1'
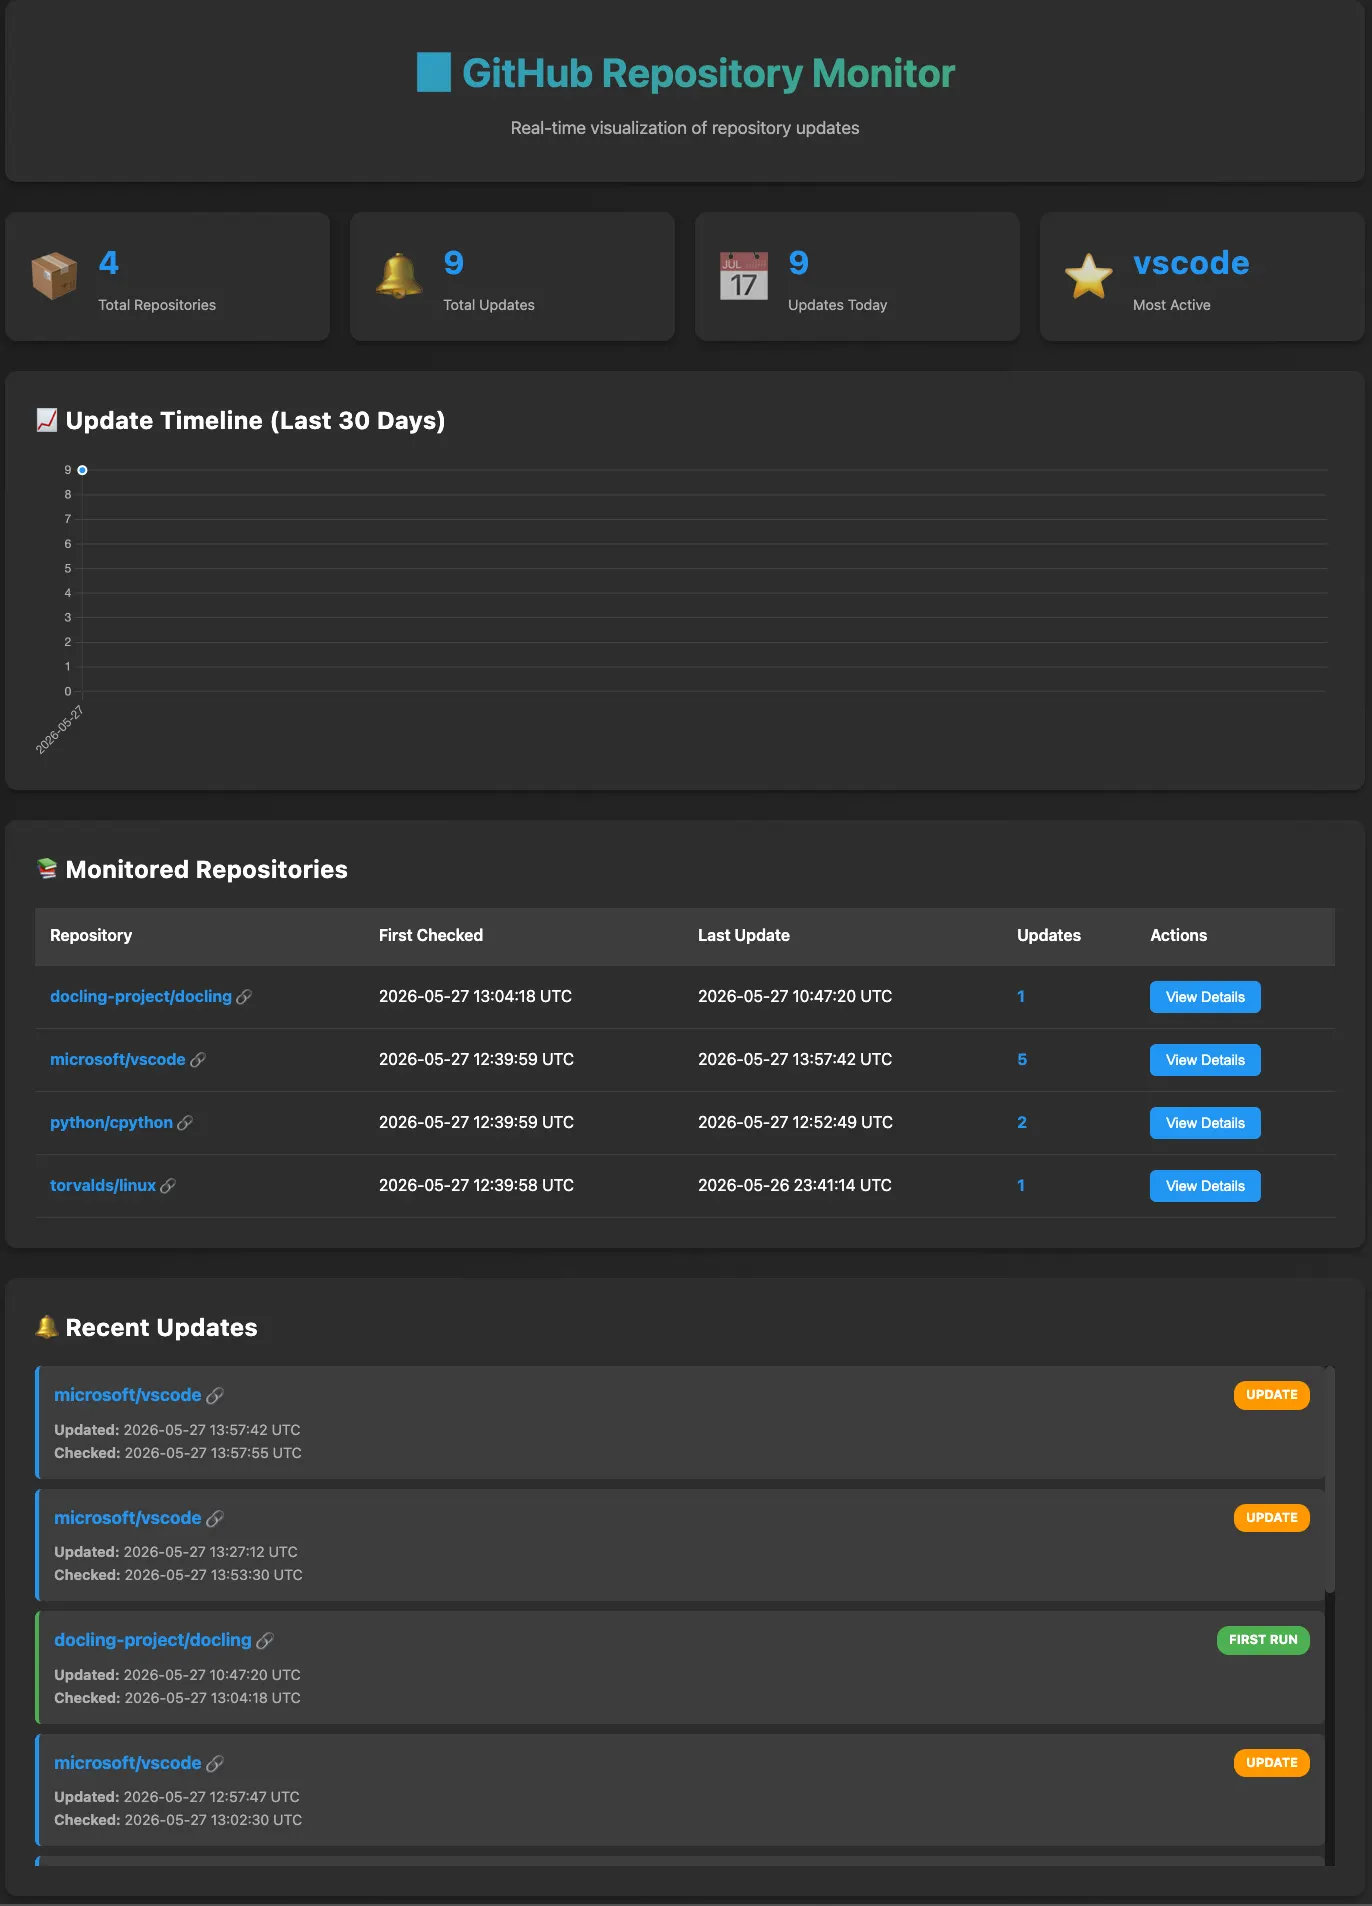
└── PORT = 5001Beyond the headless automation, the application features a clean, intuitive UI that serves as your central command center. This dashboard provides a crystal-clear visual overview of every repository currently being tracked by the agent.
Instead of parsing raw database rows, you can audit your entire tech stack at a glance and see exactly what’s under watch. Even better, it collapses the distance between discovery and action: with a single click inside the UI, you can jump directly to any chosen repository on GitHub the moment you want to investigate a new change.
#!/usr/bin/env python3
"""
GitHub Monitor Web Viewer
A simple Flask-based web application to visualize SQLite database data.
"""
from flask import Flask, render_template, jsonify
import sqlite3
from datetime import datetime
import os
app = Flask(__name__)
# Configuration
DB_PATH = 'github_monitor.db'
def get_db_connection():
"""Create a database connection."""
conn = sqlite3.connect(DB_PATH)
conn.row_factory = sqlite3.Row
return conn
def format_timestamp(ts_str):
"""Format ISO timestamp to readable format."""
try:
if 'T' in ts_str:
dt = datetime.fromisoformat(ts_str.replace('Z', '+00:00'))
return dt.strftime('%Y-%m-%d %H:%M:%S UTC')
return ts_str
except:
return ts_str
@app.route('/')
def index():
"""Main dashboard page."""
return render_template('index.html')
@app.route('/api/stats')
def get_stats():
"""Get overall statistics."""
conn = get_db_connection()
cursor = conn.cursor()
# Total repositories
cursor.execute('SELECT COUNT(*) as count FROM repositories')
total_repos = cursor.fetchone()['count']
# Total updates
cursor.execute('SELECT COUNT(*) as count FROM updates')
total_updates = cursor.fetchone()['count']
# Updates today
cursor.execute('''
SELECT COUNT(*) as count FROM updates
WHERE date(check_timestamp) = date('now')
''')
updates_today = cursor.fetchone()['count']
# Most active repository
cursor.execute('''
SELECT repo_name, COUNT(*) as update_count
FROM updates
GROUP BY repo_name
ORDER BY update_count DESC
LIMIT 1
''')
most_active = cursor.fetchone()
conn.close()
return jsonify({
'total_repos': total_repos,
'total_updates': total_updates,
'updates_today': updates_today,
'most_active': dict(most_active) if most_active else None
})
@app.route('/api/repositories')
def get_repositories():
"""Get all repositories with their update counts."""
conn = get_db_connection()
cursor = conn.cursor()
cursor.execute('''
SELECT
r.id,
r.repo_name,
r.first_checked_at,
r.last_checked_at,
COUNT(u.id) as update_count
FROM repositories r
LEFT JOIN updates u ON r.id = u.repo_id
GROUP BY r.id
ORDER BY r.repo_name
''')
repos = []
for row in cursor.fetchall():
repos.append({
'id': row['id'],
'repo_name': row['repo_name'],
'first_checked_at': format_timestamp(row['first_checked_at']),
'last_checked_at': format_timestamp(row['last_checked_at']),
'update_count': row['update_count']
})
conn.close()
return jsonify(repos)
@app.route('/api/updates')
def get_updates():
"""Get recent updates."""
limit = 50
conn = get_db_connection()
cursor = conn.cursor()
cursor.execute('''
SELECT
id,
repo_name,
update_timestamp,
check_timestamp,
is_first_run
FROM updates
ORDER BY check_timestamp DESC
LIMIT ?
''', (limit,))
updates = []
for row in cursor.fetchall():
updates.append({
'id': row['id'],
'repo_name': row['repo_name'],
'update_timestamp': format_timestamp(row['update_timestamp']),
'check_timestamp': format_timestamp(row['check_timestamp']),
'is_first_run': bool(row['is_first_run'])
})
conn.close()
return jsonify(updates)
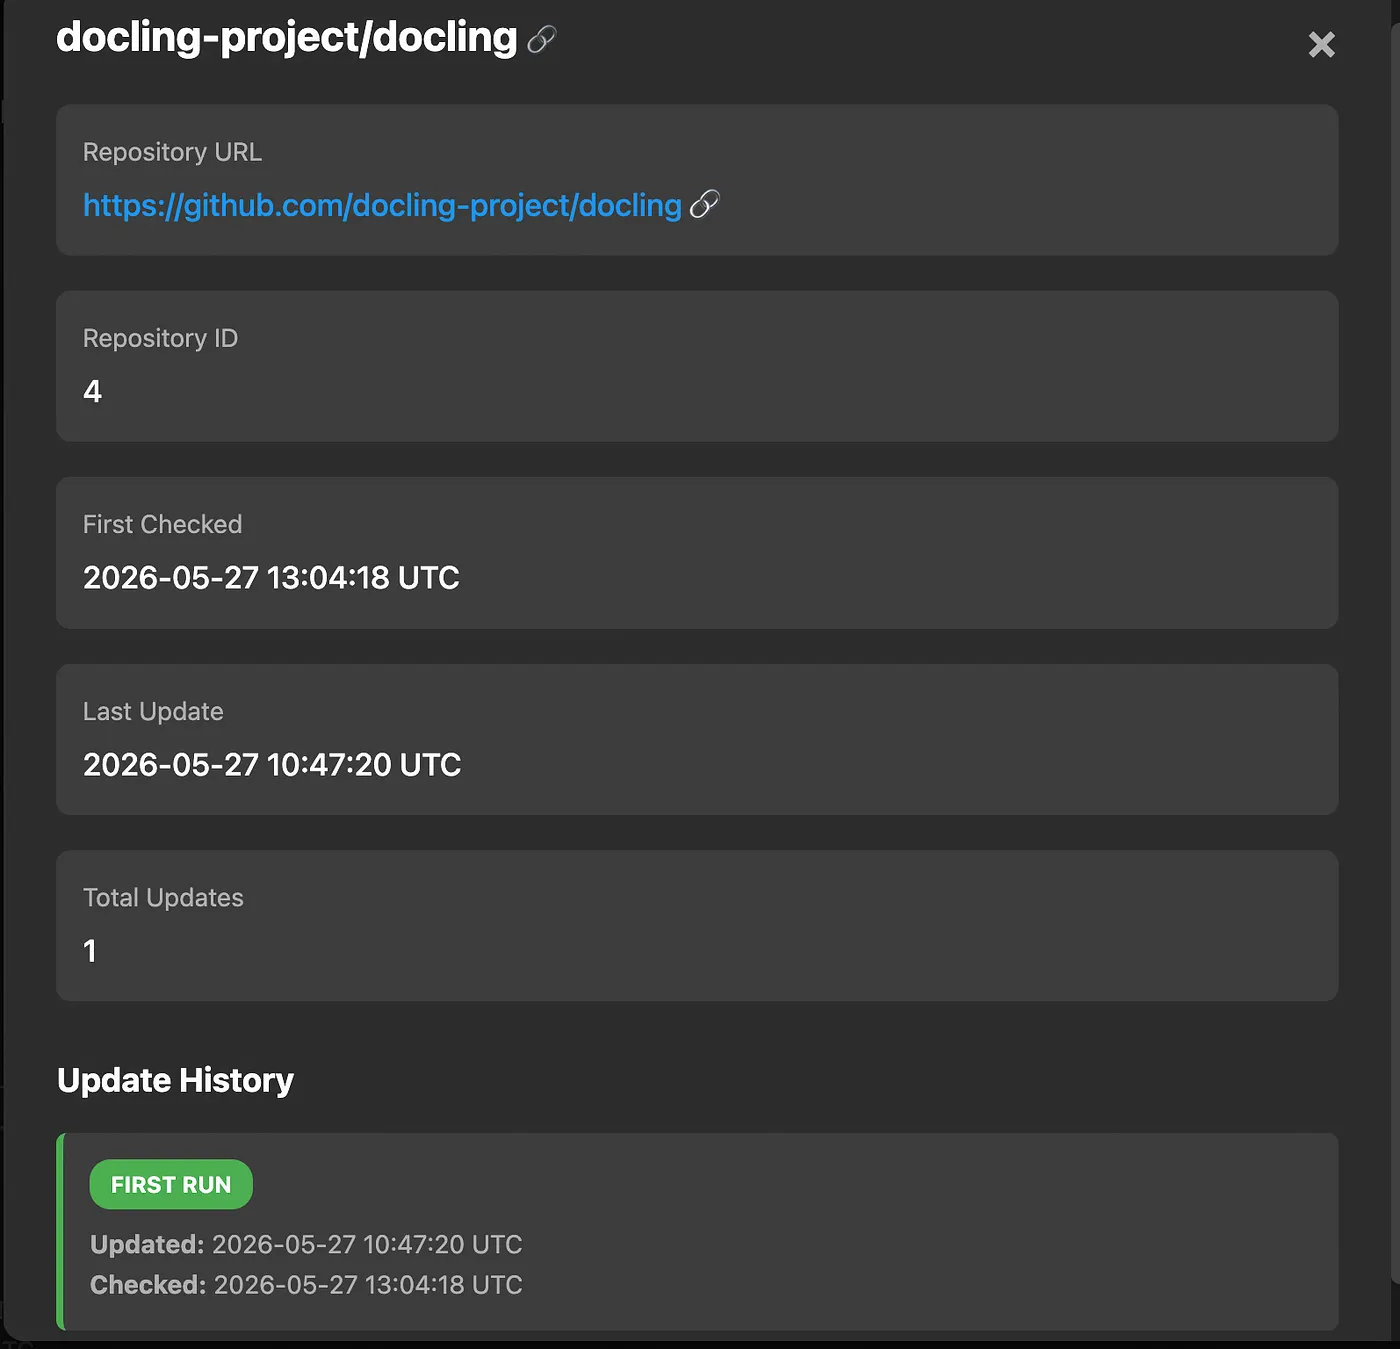
@app.route('/api/repository/<int:repo_id>')
def get_repository_details(repo_id):
"""Get detailed information about a specific repository."""
conn = get_db_connection()
cursor = conn.cursor()
# Get repository info
cursor.execute('SELECT * FROM repositories WHERE id = ?', (repo_id,))
repo = cursor.fetchone()
if not repo:
conn.close()
return jsonify({'error': 'Repository not found'}), 404
# Get updates for this repository
cursor.execute('''
SELECT * FROM updates
WHERE repo_id = ?
ORDER BY check_timestamp DESC
''', (repo_id,))
updates = []
for row in cursor.fetchall():
updates.append({
'id': row['id'],
'update_timestamp': format_timestamp(row['update_timestamp']),
'check_timestamp': format_timestamp(row['check_timestamp']),
'is_first_run': bool(row['is_first_run'])
})
conn.close()
return jsonify({
'repository': {
'id': repo['id'],
'repo_name': repo['repo_name'],
'first_checked_at': format_timestamp(repo['first_checked_at']),
'last_checked_at': format_timestamp(repo['last_checked_at'])
},
'updates': updates
})
@app.route('/api/timeline')
def get_timeline():
"""Get update timeline data for visualization."""
conn = get_db_connection()
cursor = conn.cursor()
cursor.execute('''
SELECT
date(check_timestamp) as date,
COUNT(*) as count
FROM updates
GROUP BY date(check_timestamp)
ORDER BY date DESC
LIMIT 30
''')
timeline = []
for row in cursor.fetchall():
timeline.append({
'date': row['date'],
'count': row['count']
})
conn.close()
return jsonify(timeline)
if __name__ == '__main__':
if not os.path.exists(DB_PATH):
print(f"Error: Database file '{DB_PATH}' not found!")
print("Please run github_monitor.py first to create the database.")
exit(1)
print("=" * 60)
print("GitHub Monitor Web Viewer")
print("=" * 60)
print(f"Database: {DB_PATH}")
print("Starting server...")
print("Open your browser at: http://localhost:5001")
print("Press Ctrl+C to stop")
print("=" * 60)
# Use port 5001 to avoid macOS AirDrop conflict on port 5000
app.run(debug=True, host='127.0.0.1', port=5001)
# Made with BobSo at the end we get;
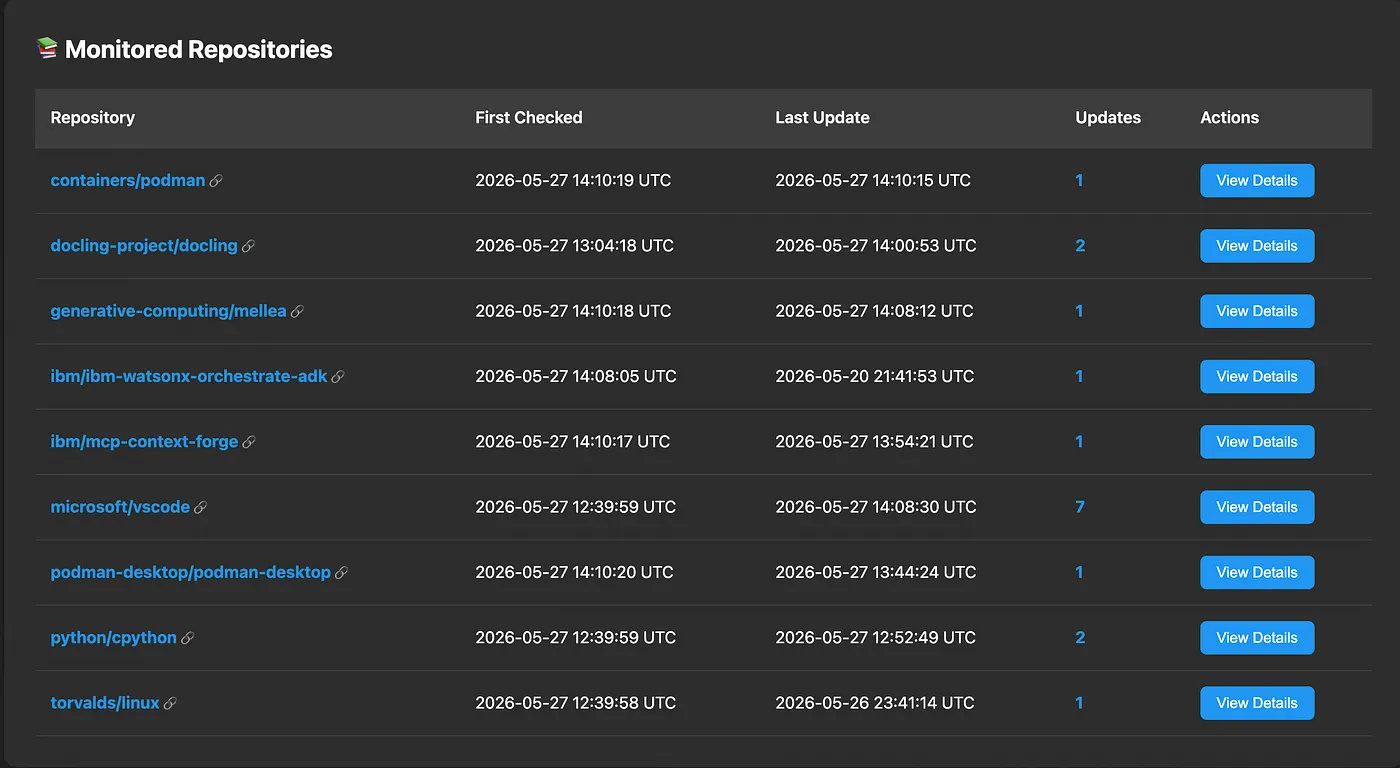
- Centralized watchlist: View all monitored repositories instantly in a clean, human-readable dashboard rather than querying the SQLite tables directly.
- One-click navigation: Every tracked repository in the UI functions as an active shortcut — clicking a project immediately takes you directly to its GitHub page to review the latest commits or releases.
Configured via Plain Text: Simple and Source-Controlled
The repository watchlist is intentionally kept detached from the core code, stored in a flat, human-readable text file named repositories.txt. This design embraces a "configuration-as-code" philosophy: you don't need to write SQL queries or modify Python variables just to change what you track. You simply list the targets in a standard owner/repo format, one per line.
The application’s parser is built to be forgiving and clean, automatically skipping empty lines and stripping out any lines prefixed with a #. This allows you to organize your watchlist with custom sections, leave developer notes, or temporarily comment out a project without losing track of it.
# GitHub Repositories to Monitor
# Format: owner/repo (one per line)
# Lines starting with # are comments and will be ignored

# Example repositories for testing:
torvalds/linux
microsoft/vscode
python/cpython

# Add your repositories below:
docling-project/docling
ibm/ibm-watsonx-orchestrate-adk
ibm/mcp-context-forge
generative-computing/mellea
containers/podman
podman-desktop/podman-desktop
Conclusion: From Concept to Production in 30 Minutes
What started as a simple, repetitive kind of daily habit — manually refreshing browser tabs to check for updates on critical frameworks like Docling and the watsonx Agent Development Kit — has been transformed into a fully automated, local developer ecosystem. By decoupling the watchlist into a frictionless, plain-text configuration file and leveraging a robust Python engine paired with an internal SQLite state ledger, the project eliminates human overhead entirely. With an OS-native cron scheduler handling the heavy lifting in the background and a sleek user interface providing one-click navigation to the source, the tool serves as a functional, autonomous agent that keeps my development workflow perfectly synchronized with the open-source world.
The most remarkable aspect of this project, however, wasn’t just the architecture — it was the velocity. By collaborating with IBM Bob as an AI-driven development partner, the entire lifecycle of this tool moved from ideation to a production-ready implementation in exactly 30 minutes. From initializing the database schemas and crafting resilient API delta logic to wrapping the application in a self-cleaning bash scheduler, Bob industrialized the code creation process seamlessly. It is a powerful testament to how modern, spec-driven prototyping can compress days of development overhead into a single focused, half-hour session, delivering immediate architectural value without the bloat.
That’s a wrap!
Links
- Blog post code repository: https://github.com/aairom/github-check
- IBM Bob: https://bob.ibm.com/
Published at DZone with permission of Alain Airom (Ayrom). See the original article here.
Opinions expressed by DZone contributors are their own.
Comments