Running a JMeter Test Via Jenkins Pipeline
We take a look at how to run a JMeter test using Jenkins' "Pipeline" project type. Read on for more details.
Join the DZone community and get the full member experience.
Join For FreeThe release of Jenkins 2.0 has introduced a new project type — Pipeline, which was previously available through plugins only. Starting from Jenkins 2.0, Pipeline projects come out of the box.
Pipeline builds have several major advantages over the usual “freestyle” projects:
Resilience — Pipeline builds can “survive” Jenkins restarts.
Pausable / Parameterizable — Pipeline builds can be stopped at any stage while waiting for user input. There is also a possibility to control Pipeline jobs execution through Jenkins API.
Power and Flexibility — Pipeline builds can have complex logic, conditional actions, be executed on multiple agents in parallel, integrate with other jobs, etc. Pipelines are defined using Groovy-based DSL so Jenkins and Java APIs can be used to define the job.
VCS Friendliness — As a Groovy script, Pipeline definition code can be put under a version control system. It can even be loaded from there on the fly during the Jenkins job execution, which is great for import/export/changes tracking and experimentation.
In today’s article you will learn about the ways of adding a JMeter test to a Pipeline project and see some code examples and demos.
This chapter assumes that you already have a working build step with executed JMeter tests against your application. If not, check out Continuous Integration 101: How to Run JMeter With Jenkins for an overview and setup instructions. If you have a Jenkins job which runs a JMeter test and it’s called “JMeter - Freestyle”, you can run it from Pipeline as simple as: build job: 'JMeter - Freestyle'
The full Pipeline code will look something like:
node {
   stage 'Build Application'
   // do what you need to do to build your application
   echo 'Compilation is done'
   stage 'Deploy Application'
   // do what you need to do to deploy your application
   echo 'Deploy is done'
   stage 'Execute JMeter Performance Tests'
   build job: 'JMeter - Freestyle'
}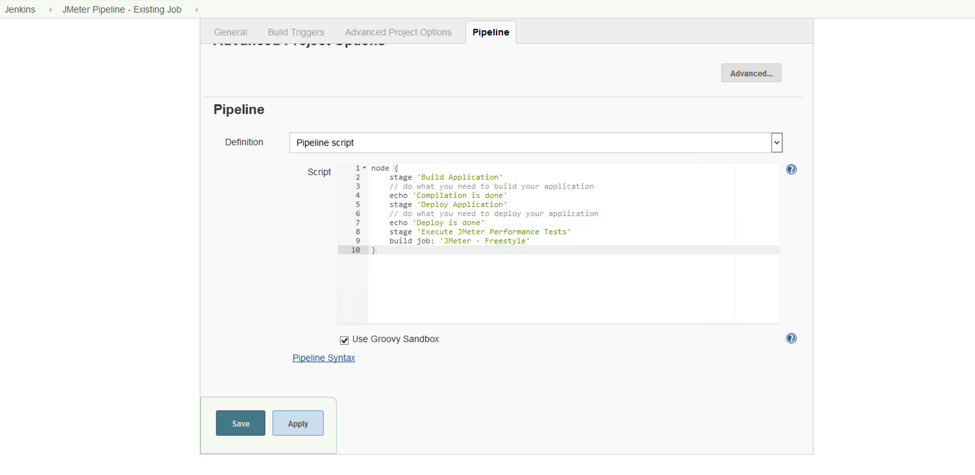
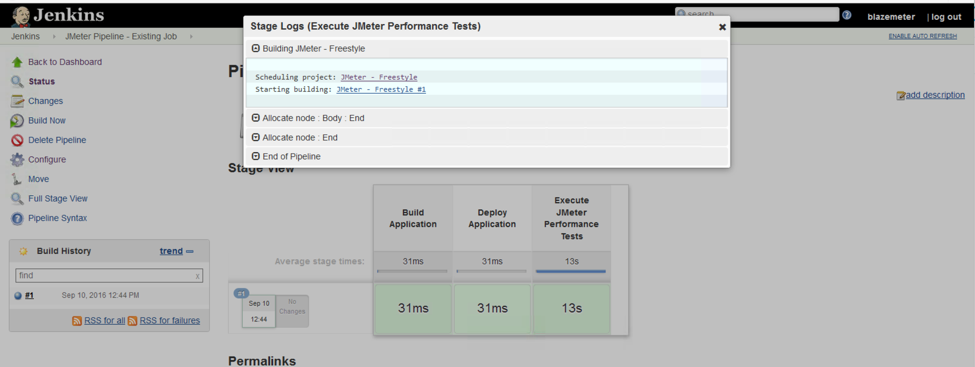
Basically, the above Pipeline configuration just triggers a predefined “JMeter - Freestyle” Jenkins Job as a part of the Pipeline build, and reports elapsed time, success, and some logs via Pipeline Dashboard.
Specifying Build Parameters
If your existing job is parameterized the parameters can be passed via Pipeline as well like:
node {
   stage 'Execute JMeter Performance Tests'
   build job: 'JMeter - Freestyle', parameters: [[$class: 'StringParameterValue', name: 'VirtualUsers', value: '100']]
}
Given the Groovy-based nature of Pipeline projects, you can start any process using Groovy syntax. Jenkins in turn provides some short-hand variables to make it easier. For example you can use sh command for Unix-based systems or bat command for Windows systems in order to kick off a shell script (JMeter startup scripts are usual shell scripts). See Basic Groovy Syntax for Pipeline Configuration Jenkins manual chapter for more details.
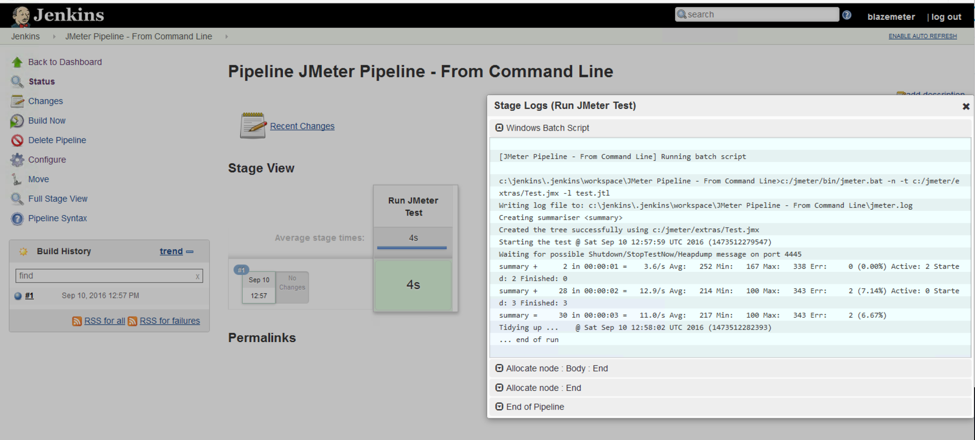
The Pipeline stage to run a command-line based JMeter test, will look as simple as:
node {
   stage 'Run JMeter Test'
   bat 'c:/jmeter/bin/jmeter.bat -n -t c:/jmeter/extras/Test.jmx -l test.jtl'
}
The output would be similar, however in this case logging information will be available in the “Run JMeter Test” stage directly.
Publishing Build Artifacts
By default, Pipeline builds doesn’t publish anything to the build dashboard. You will need to manually specify what needs to be stored, in order for results to be accessed by yourself, team members, stakeholders, etc., directly through the Jenkins web interface.
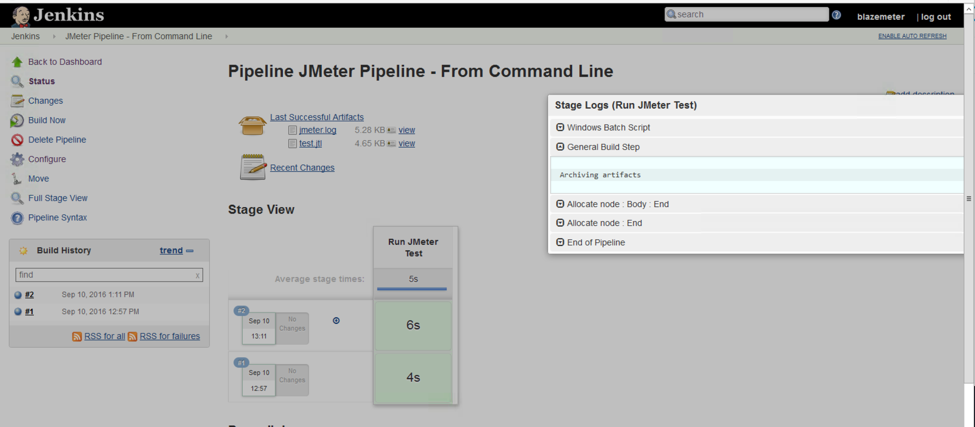
To tell Jenkins to publish i.e. JMeter .jtl results file(s) once the build finishes, you need to add the following line to your Pipeline configuration: step([$class: 'ArtifactArchiver', artifacts: '**/*.jtl'])
Or if you need to store jmeter.log file as well for later analysis: step([$class: 'ArtifactArchiver', artifacts: '**/*.jtl, **/jmeter.log'])
Once you add this step you should be able to seea “General Build Step -> Archiving Artifacts” log message, .jtl result, and jmeter.log files in your build dashboard.
Using 3rd-Party Build Tools (Ant, Maven, etc.)
Running a JMeter test via command-line is not the only option. JMeter tests can also be executed using Ant Task, Maven Plugin, Gradle Plugin, etc.
Being an ultimate continuous integration tool, Jenkins supports the aforementioned build tools out-of-the-box. You can install and configure them at the Global Tools Configuration page: Jenkins -> Manage Jenkins -> Global Tool Configuration
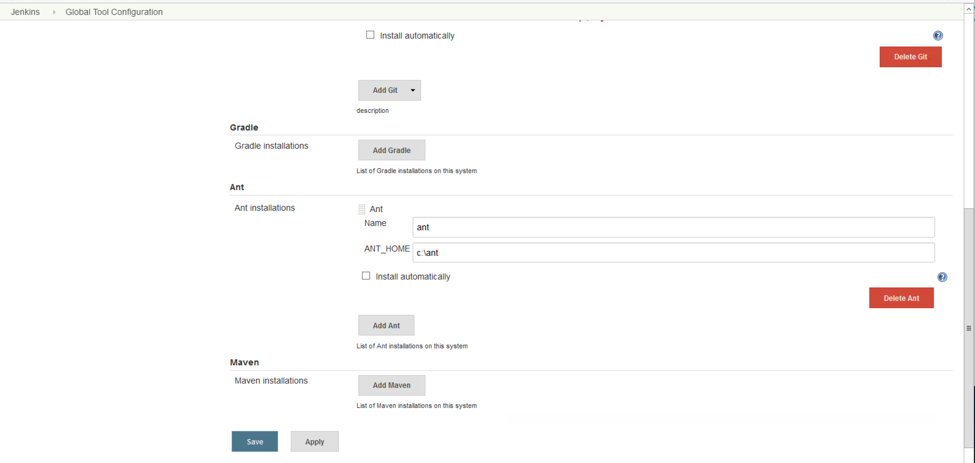
In this guide I will use Apache Ant as example. Instructions for other build systems should be similar. If you take a look at the “extras” folder of your JMeter installation, you’ll find a build.xml file sample Ant script, which is used for executing Test.jmx and converting the resulting file into HTML format using XSL templates, so you will be able to get HTML report directly on the Jenkins dashboard.
Let’s see what the associated Pipeline configuration will look like:
● First of all, we need to switch Jenkins workspace to the JMeter’s “extras” folder, as Ant build file is assumed to be launched from there and result files will be stored there as well. In Jenkins Pipeline it can be done using ws command like:
ws('c:\\jmeter\\extras') {
   //do what you need to do here
}
Second, we need to get Ant tool location from Jenkins. It can be done by using a tool command like:
def antHome = tool 'ant'Now we have the antHome variable which resolves into the location of the Ant build tool.Third and fourth: we need to run the test and publish the results. This has already been covered in previous chapter. Putting it all together, the final Pipeline code will look like:
node {
   ws('c:\\jmeter\\extras') {
       stage 'Run JMeter Test with Apache Ant'
       def antHome = tool 'ant'
       bat "pushd c:\\jmeter\\extras && ${antHome}\\bin\\ant -f build.xml"
       step([$class: 'ArtifactArchiver', artifacts: 'Test.html', fingerprint: true])
   }
}
When you start the build Jenkins will invoke Apache Ant through the Pipeline code and publish the resulting “Test.html” artifact to the build dashboard.
I believe this article will help you to get started with Jenkins Pipeline and you will be able to integrate your performance tests into your Continuous Delivery process more easily and smoothly. If anything remains unclear — don’t hesitate to ask questions using the comments!
Reference Material:
● Getting Started with Pipeline
Published at DZone with permission of Dmitri Tikhanski. See the original article here.
Opinions expressed by DZone contributors are their own.
Comments