How To Use an Automatic Sequence Diagram Generator
Sequence diagrams are useful for modeling and visualizing complex interactions between objects in a system. Learn how to generate them with the developer tool.
Join the DZone community and get the full member experience.
Join For FreeYou may have heard about or experienced the value of sequence diagrams. In this article, I’ll introduce sequence diagrams and describe what they are good for. I’ll also give you a tour of the features of sequence diagrams and explain how to use each feature to interpret the behavior of your code. Then I’ll show how AppMap makes sequence diagrams even better by (a) generating diagrams from your running code and (b) making diagrams fully interactive.
What Is a Sequence Diagram?
Sequence diagrams are a type of Unified Modeling Language (UML) diagram that shows the interactions between different components or objects in a system over time. They show the flow of messages and the order in which these messages are exchanged. They are great for understanding how code works because they show enough detail to communicate the key elements of code behavior while being compact enough to fit a lot of information onto a single page.
Uses of Sequence Diagrams
Sequence diagrams are particularly useful for designing and testing software systems that involve multiple components, asynchronous events, or complex control flows. Here are some common use cases for sequence diagrams:
- Understanding system behavior: Sequence diagrams can help you understand how different parts of a system interact with each other and how the system behaves in response to different inputs.
- Designing new systems: Sequence diagrams can be used as a tool to design new systems by helping to identify the components needed and how they should interact.
- Communication: Sequence diagrams can be used as a visual aid to communicate system behavior and design to stakeholders, such as developers, project managers, and clients.
- Documentation: Sequence diagrams can be used to document the design and behavior of a system, providing a clear and concise description of how the system works.
How To Interpret a Sequence Diagram
Let’s talk about the basic features of a sequence diagram. These features are present in any sequence diagram.
- Lifeline: A vertical line that represents an object or component in the system. The lifeline shows the lifetime of the object/component and its existence over time.
- Object header: The rectangular box attached to the top of the lifeline that contains the name of the component (package, class, etc.) that the lifeline represents.
- Activation bar: A horizontal line that represents the duration of time when an object is performing an action or processing a message. It is shown as a solid line above the lifeline.
- Message: A horizontal arrow that represents the communication between objects or components. It is shown as a line with an arrowhead pointing from the sender to the receiver. Messages can be synchronous, asynchronous, or self-referential.
- Return message: A horizontal arrow with a dashed line that represents the return message from the receiver to the sender.
- Self-message: A message that is sent by an object to itself.
- Combined fragment: A diagram fragment representing a specific flow of control. It is shown as a box with a label that indicates the condition under which it is executed.
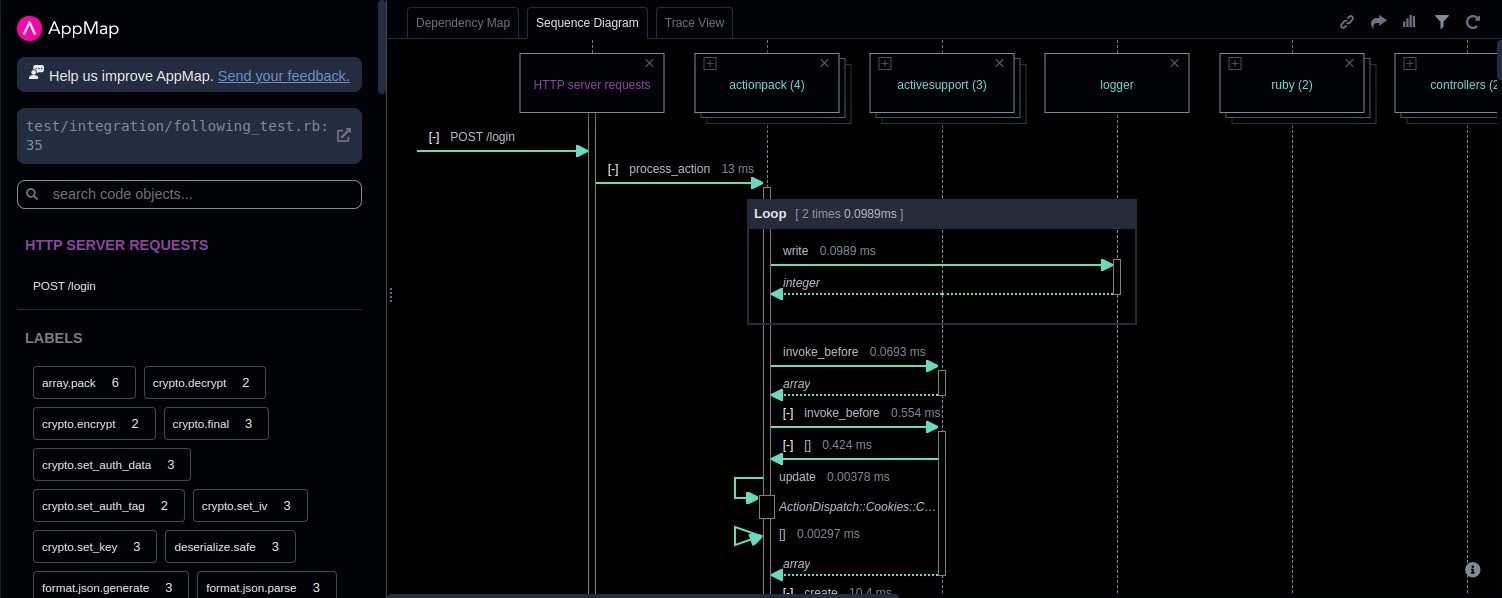
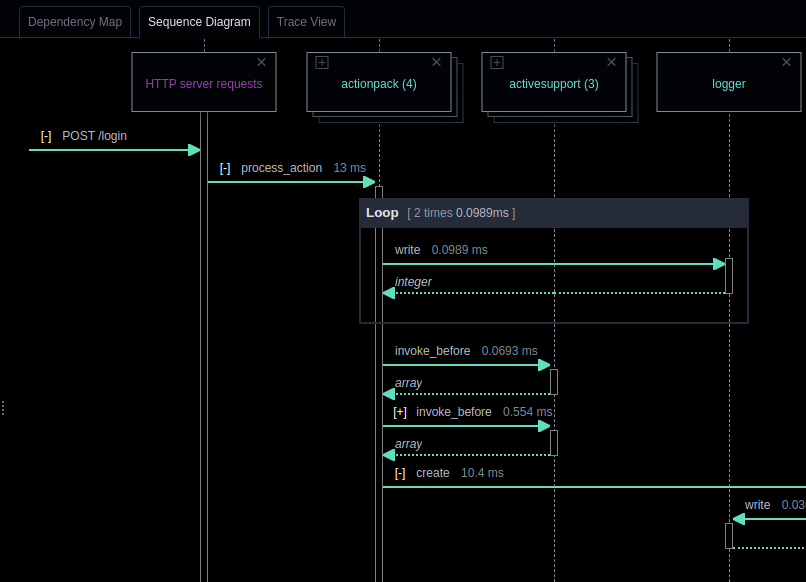
Here is what this particular sequence diagram can tell us about the code that it models. The first message begins from outside of the diagram, indicating that it originates from a source external to the system being diagrammed. In the case of this diagram, the external source is whatever entity made the POST request. The next message is the function call to process_action in the actionpack package, which then “activates” the actionpack lifeline, as can be seen from the lifeline changing from a dashed line to a rectangular box, which is the activation bar. This means that the package is now active in the system. Next, as part of the process_action message, we see a loop with two calls to the write function in the activesupport package. The loop is depicted as a combined fragment, as depicted by the grey box labeled “loop.” Within this loop box, we see our first example of a return message, which is the dashed arrow integer above it, indicating the return type. This indicates that the write function executes and returns before we proceed to the next function call. If we skip a couple of function calls to update, we see an example of a self-message, where the actionpack package makes a call from one part of itself to another, which is depicted by a message arrow originating from the actionpack lifeline and then returning to the same lifeline. You can see that this increases the width of the activation bar temporarily. There are more function calls after these, but that covers the basics. You should now have a good understanding of sequence diagrams!
Making Sequence Diagrams Interactive
As useful as sequence diagrams are, there can be made even better. AppMap is a tool that adds two great features to sequence diagrams — automatic diagram generation and interactivity.
Let's get right into an example. Here is a sequence diagram that was generated by running a test case for a Twitter-like application. The name of the test is `Following should unfollow a user with Ajax`:
When you click on this diagram, you will see immediately that the diagram is “alive.” You can expand, collapse, refine, and drill down for detailed trace information.
How To Interact With Sequence Diagrams
Here are several tips for getting the most out of these sequence diagrams:
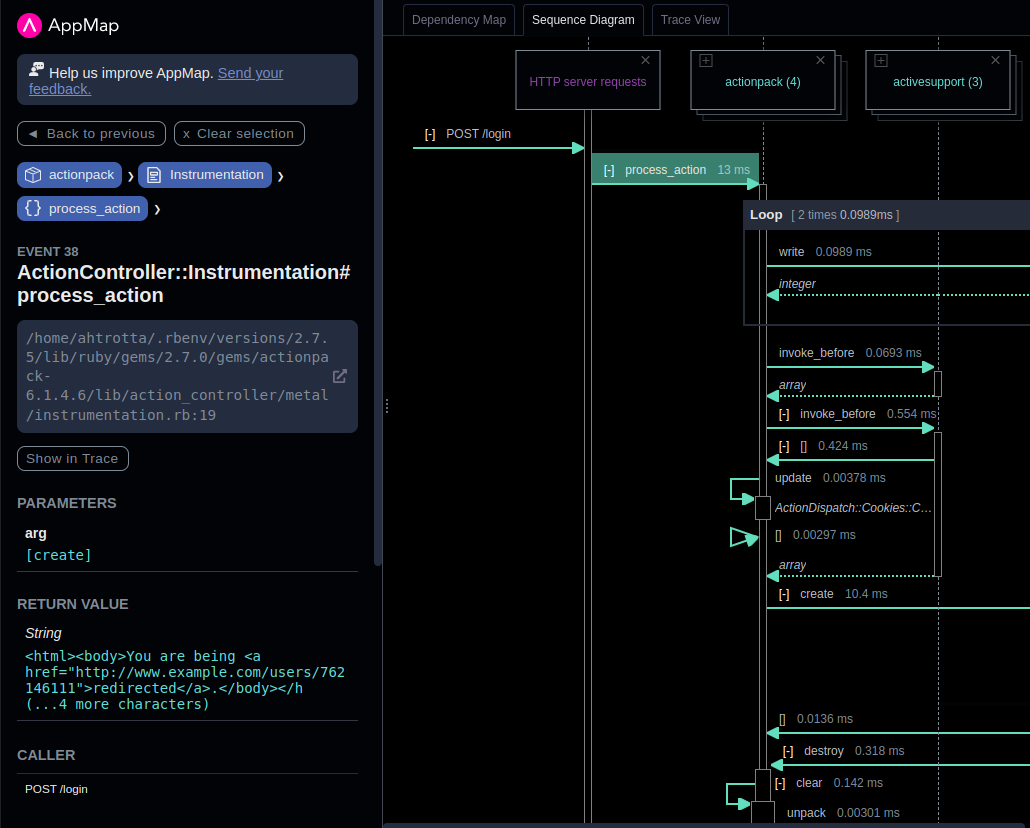
- Show event parameters, return values, and a link to source code: If you click on the name of the message arrow, then that event will be selected, and you can see more information about it in the sidebar.
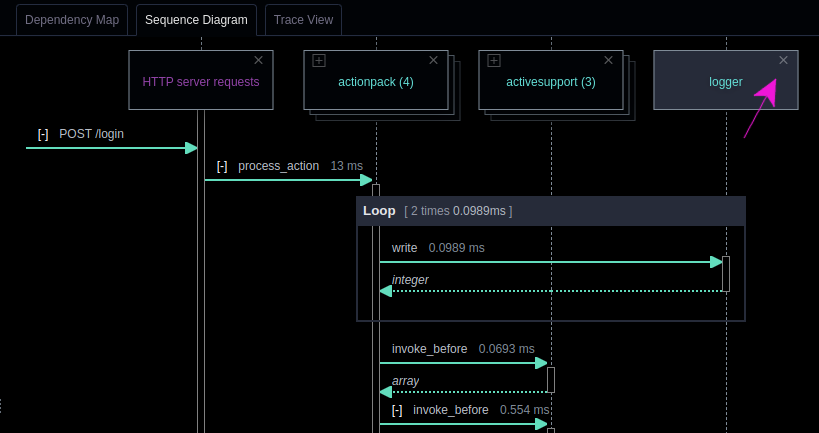
- Hide a lifeline: If you click on the small x icon in the top right corner of an Object header, then you will hide that lifeline. This can be useful if the sequence diagram is too large and contains code that is not useful for the task at hand. For example, you might suspect that there’s a bug in the code, and you have a hypothesis that the logger package is not relevant. In that case, you can hide the logger lifeline to make it easier to find the relevant information in the diagram.
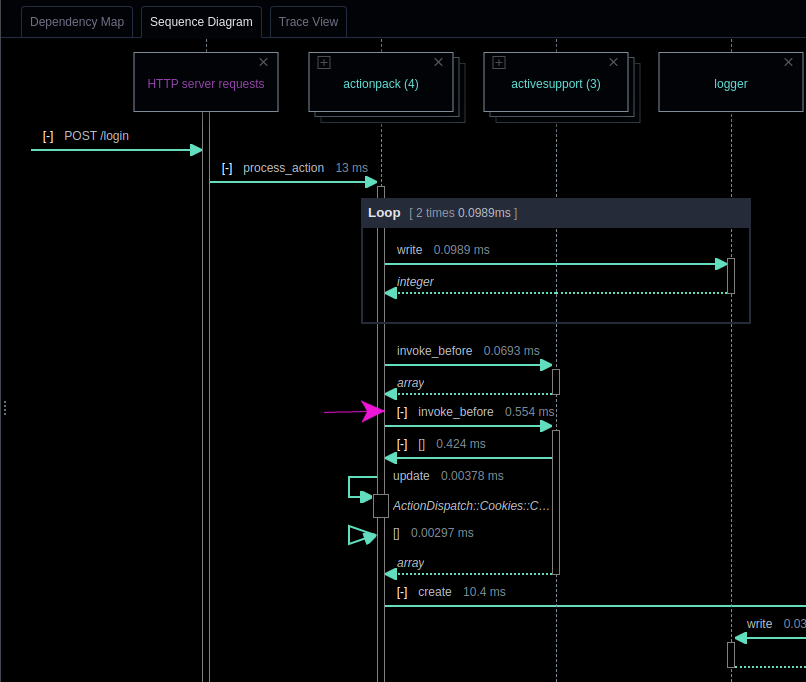
- Collapse a section of the sequence diagram: You can click on the [-] button on a message arrow next to the function name, and it will collapse that section of the diagram. This is useful in a similar way that hiding a lifeline is useful. Sometimes there is extraneous information in a diagram that is not relevant to your current task. Temporarily hiding that information is a great way to quickly find what you’re looking for.
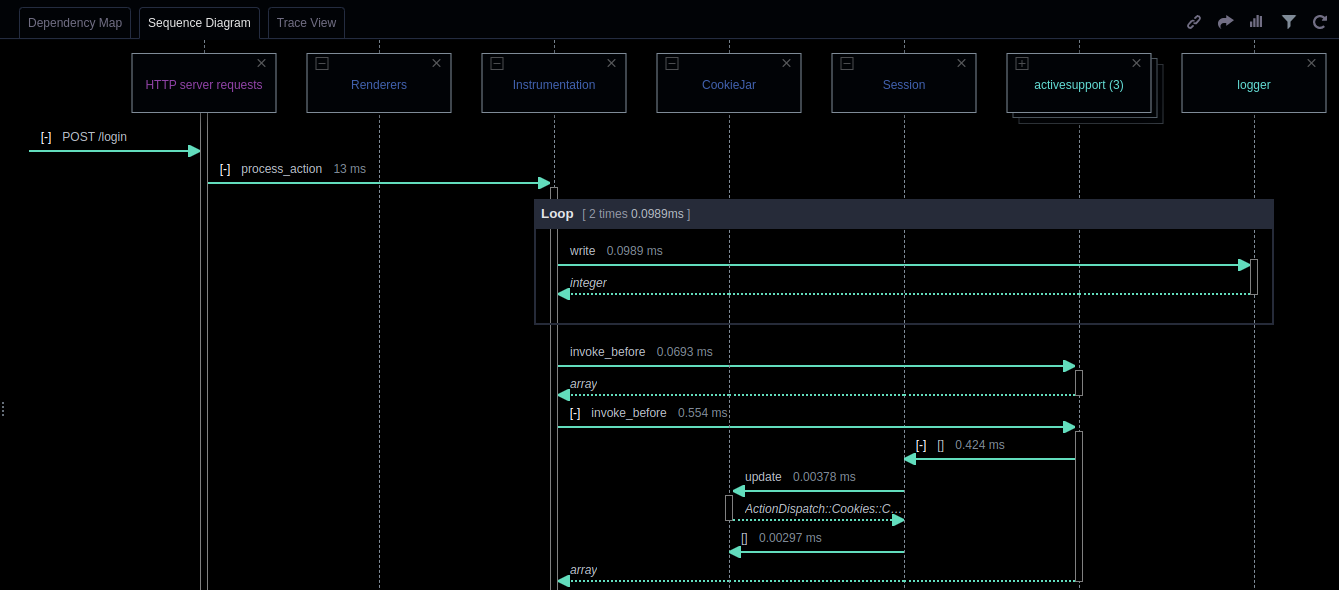
- Expand a package into classes: If an object header is a package and it contains two or more classes, then you can click on the icon in the top left corner of the object header and expand the package. This lets you get a more detailed view of the interactions between objects in the system and can help you better understand the code.
The Power of Interactive Sequence Diagrams
Sequence diagrams are a valuable tool in software engineering for modeling and visualizing complex interactions between objects in a system. To it to the next level by generating and reading sequence diagrams with tools that allow you to expand packages into classes for a detailed view, remove lifelines to focus on relevant information, select events for more details, and collapse sections to quickly find specific information.
Published at DZone with permission of Adam Trotta. See the original article here.
Opinions expressed by DZone contributors are their own.
Comments