Spring Boot Best Practices for Microservices
In this article, I'm going to propose my list of rules for building Spring Boot applications, which are a part of the microservices-based system.
Join the DZone community and get the full member experience.
Join For Free
In this article, I'm going to propose my list of "golden rules" for building Spring Boot applications, which are a part of the microservices-based system. I'm basing on my experience in migrating monolithic SOAP applications running on JEE servers into REST-based small applications built on top of Spring Boot. This list of best practices assumes you are running many microservices on the production under huge incoming traffic. Let's begin.
You may also like: Spring Boot Microservices: Building a Microservices Application Using Spring Boot
It is just amazing how metrics visualization can change an approach to the systems monitoring in the organization. After setting up monitoring in Grafana we can recognize more than 90% of bigger problems in our systems before they are a reporter by customers to our support team. Thanks to those two monitors with plenty of diagrams and alerts we may react much faster than earlier.
If you have microservices-based architecture metrics become even more important than for monoliths.
The good news for us is that Spring Boot comes with a built-in mechanism for collecting the most important metrics. We just need to set some configuration properties to expose a predefined set of metrics provided by the Spring Boot Actuator. To use it we need to include Actuator starter as a dependency:
<dependency>
<groupId> org.springframework.boot</groupId>
<artifactId>spring-boot-starter-actuator</artifactId>
</dependency>
To enable metrics endpoint we have to set the property management.endpoint.metrics.enabled to true. Now you may check out the full list of generated metrics by calling endpoint GET /actuator/metrics.
One of the most important metrics for us is http.server.requests, that it provides statistics with several incoming requests and response times. It is automatically tagged with method type (POST, GET, etc.), HTTP status and URI.
Metrics have to be stored somewhere. The most popular tools for that are InfluxDB and Prometheus. They are representing two different models of collecting data. Prometheus periodically retrieves data from endpoint exposed by the application, while InfluxDB provides REST API that has to be called by the application. The integration with those two tools and several other is realized with the Micrometer library. To enable support for InfluxDB we have to include the following dependency.
xxxxxxxxxx
<dependency>
<groupId>io.micrometer</groupId>
<artifactId>micrometer-registry-influx</artifactId>
</dependency>
We also have to provide at least URL and Influx database name inside application.yml file.
xxxxxxxxxx
management
metrics
export
influx
dbspringboot
urihttp//192.168.99.1008086
To enable Prometheus HTTP endpoint we first need to include the appropriate Micrometer module and also set property management.endpoint.prometheus.enabled to true.
xxxxxxxxxx
<dependency>
<groupId>io.micrometer</groupId>
<artifactId>micrometer-registry-prometheus</artifactId>
</dependency>
By default, Prometheus tries to collect data from a defined target endpoint once a minute. The rest of the configuration has to be provided inside Prometheus. A scrape_config section is responsible for specifying a set of targets and parameters describing how to connect with them.
xxxxxxxxxx
scrape_configs
job_name'springboot'
metrics_path'/actuator/prometheus'
static_configs- targets'person-service:2222'
Sometimes it is useful to provide additional tags to metrics, especially if we have many instances of a single microservice that logs to a single Influx database. Here's the sample of tagging for applications running on Kubernetes.
x
class ConfigurationMetrics {
("\${spring.application.name}") lateinit var appName: String
("\${NAMESPACE:default}") lateinit var namespace: String
("\${HOSTNAME:default}") lateinit var hostname: String
fun tags(): MeterRegistryCustomizer<InfluxMeterRegistry> {
return MeterRegistryCustomizer { registry -> registry.config().commonTags("appName", appName).commonTags("namespace", namespace).commonTags("pod", hostname)
}
}
}
Here's a diagram from Grafana created for http.server.requests metric of a single application.
![balances [success rate] chart](https://piotrminkowski.files.wordpress.com/2019/12/spring-boot-best-practices-metrics.png?w=700)
Logging is something that is not very important during development but is the key point during maintenance. It is worth remembering that in the organization your application would be viewed through the quality of the logs. Usually, an application is maintenance by the support team, so your logs should be significant. Don't try to put there everything, only the most important events should be logged.
It is also important to use the same standard of logging for all the microservices. For example, if you are logging information in JSON format, do the same for every single application. If you use the tag appName for indicating application name or instanceId to distinguish different instances of the same application do it everywhere.
Why? You usually want to store the logs collected from all microservices in a single, central place. The most popular tool for that (or rather the collection of tools) is Elastic Stack (ELK). To take advantage of storing logs in a central place, you should ensure that query criteria and response structure would be the same for all the applications, especially that you will correlate the logs between different microservices.
How to that? Of course by using the external library. I can recommend my library for Spring Boot logging. To use it you should include it to your dependencies.
xxxxxxxxxx
<dependency>
<groupId>com.github.piomin</groupId>
<artifactId>logstash-logging-spring-boot-starter</artifactId>
<version>1.2.2.RELEASE</version>
</dependency>
This library will force you to use some good logging practices and automatically integrates with Logstash (one of three ELK tools responsible for collecting logs). Its main features are:
- an ability to log all incoming HTTP requests and outgoing HTTP responses with a full-body, and send those logs to Logstash with the proper tags indicating calling method name or response HTTP status
- an ability to calculate and store an execution time for each request
- an ability to generate and propagate correlationId for downstream services calling with Spring
RestTemplate
To enable sending logs to Logstash we should at least provide its address and property logging.logstash.enabled to true.
xxxxxxxxxx
logging.logstash
enabledtrue
url192.168.99.1005000
After including the library logstash-logging-spring-boot-starter you may take advantage of logs tagging in Logstash. Here's the screen from Kibana for the single response log entry.

We may also include Spring Cloud Sleuth library to our dependencies.
xxxxxxxxxx
<dependency>
<groupId>org.springframework.cloud</groupId>
<artifactId>spring-cloud-starter-sleuth</artifactId>
</dependency>
Spring Cloud Sleuth propagates headers compatible with Zipkin - a popular tool for distributed tracing. Its main features are:
- It adds trace (correlating requests) and span IDs to the Slf4J MDC.
- It records timing information to aid in latency analysis.
- It modifies a pattern of log entry to add some information like additional MDC fields.
- It provides integration with other Spring components like OpenFeign, RestTemplate or Spring Cloud Netflix Zuul.
In most cases, your application will be called by other applications through REST-based API. Therefore, it is worth to take care of proper and clear documentation. The documentation should be generated along with the code. Of course, there are some tools for that. One of the most popular of them is Swagger.
You can easily integrate Swagger 2 with your Spring Boot application using the SpringFox project. To expose the Swagger HTML site with API documentation we need to include the following dependencies.
The first library is responsible for generating Swagger descriptor from Spring MVC controllers code, while the second embed Swagger UI to display the representation of Swagger YAML descriptor in your web browser.
xxxxxxxxxx
<dependency>
<groupId>io.springfox</groupId>
<artifactId>springfox-swagger2</artifactId>
<version>2.9.2</version>
</dependency>
<dependency>
<groupId>io.springfox</groupId>
<artifactId>springfox-swagger-ui</artifactId>
<version>2.9.2</version>
</dependency>
It's not all. We also have to provide some beans to customize default Swagger generation behavior. It should document only methods implemented inside our controllers, for example, not the methods provided by Spring Boot automatically like /actuator/* endpoints. We may also customize UI appearance by defining UiConfiguration bean.
x
public class ConfigurationSwagger {
Optional<BuildProperties> build;
public Docket api() {
String version = "1.0.0";
if (build.isPresent())
version = build.get().getVersion();
return new Docket(DocumentationType.SWAGGER_2)
.apiInfo(apiInfo(version))
.select()
.apis(RequestHandlerSelectors.any())
.paths(PathSelectors.regex
("(/components.*)"))
.build()
.useDefaultResponseMessages(false)
.forCodeGeneration(true); }
public UiConfiguration uiConfig() {
return UiConfigurationBuilder.builder()
.docExpansion(DocExpansion.LIST)
.build(); }
private ApiInfo apiInfo(String version) {
return new ApiInfoBuilder()
.title("API - Components Service")
.description("Managing Components.")
.version(version) .build();
}
}
Here's an example of Swagger 2 UI for a single microservice.

The next case is to define the same REST API guideline for all microservices. If you are building an API of your microservices consistently, it is much simpler to integrate with it for both external and internal clients. The guideline should contain instructions on how to build your API, which headers need to be set on the request and response, how to generate error codes etc.
Such a guideline should be shared with all developers and vendors in your organization. For a more detailed explanation of generating Swagger documentation for Spring Boot microservices including exposing it for all the applications on API gateway, you may refer to my article Microservices API Documentation with Swagger2.
If you are using Spring cloud for communication between microservices, you may leverage Spring Cloud Netflix Hystrix or Spring Cloud Circuit Breaker to implement circuit breaking. However, the first solution has been already moved to the maintenance mode by the Pivotal team, since Netflix does not develop Hystrix anymore. The recommended solution is the new Spring Cloud Circuit Breaker built on top of the resilience4j project.
xxxxxxxxxx
<dependency>
<groupId>org.springframework.cloud</groupId>
<artifactId>spring-cloud-starter-circuitbreaker-resilience4j</artifactId> </dependency>
Then we need to configure required settings for the circuit breaker by defining Customizer a bean that is passed a Resilience4JCircuitBreakerFactory. We are using default values as shown.
xxxxxxxxxx
public Customizer<Resilience4JCircuitBreakerFactory> defaultCustomizer() {
return factory -> factory.configureDefault(id -> new Resilience4JConfigBuilder(id)
.timeLimiterConfig(TimeLimiterConfig.custom()
.timeoutDuration(Duration.ofSeconds(5)).build()) .circuitBreakerConfig(CircuitBreakerConfig.ofDefaults())
.build());
}
We should not forget that one of the most important reasons for migration into microservices architecture is a requirement of continuous delivery. Today, the ability to deliver changes fast gives an advantage on the market. You should be able even to deliver changes several times during the day.
Therefore, it is important what's the current version, where it has been released and what changes it includes.
When working with Spring Boot and Maven we may easily publish such information like date of last changes, Git commits id or numerous versions of the application. To achieve that we just need to include following Maven plugins to our pom.xml.
xxxxxxxxxx
<plugins>
<plugin>
<groupId>org.springframework.boot</groupId>
<artifactId>spring-boot-maven-plugin</artifactId>
<executions>
<execution>
<goals>
<goal>build-info</goal>
</goals>
</execution>
</executions>
</plugin>
<plugin>
<groupId>pl.project13.maven</groupId>
<artifactId>git-commit-id-plugin</artifactId>
<configuration>
<failOnNoGitDirectory>false</failOnNoGitDirectory>
</configuration>
</plugin>
</plugins>
Assuming you have already included Spring Boot Actuator (see Section 1), you have to enable /info the endpoint to be able to display all interesting data.
management.endpoint.info.enabled: true
Of course, we have many microservices consisting of our system, and there are a few running instances of every single microservice. It is desirable to monitor our instances in a single, central place — the same as with collecting metrics and logs.
Fortunately, there is a tool dedicated to the Spring Boot application, that can collect data from all Actuator endpoints and display them in UI. It is a Spring Boot Admin developed by Codecentric. The most comfortable way to run it is by creating a dedicated Spring Boot application that includes Spring Boot Admin dependencies and integrates with the discovery server, for example, Spring Cloud Netflix Eureka.
xxxxxxxxxx
<dependency>
<groupId>de.codecentric</groupId>
<artifactId>spring-boot-admin-starter-server</artifactId>
<version>2.1.6</version>
</dependency>
<dependency>
<groupId>org.springframework.cloud</groupId>
<artifactId>spring-cloud-starter-netflix-eureka-client</artifactId>
</dependency>
Then we should enable it for Spring Boot application by annotating the main class with @EnableAdminServer.
x
public class Application {
public static void main(String[] args) {
SpringApplication.run(Application.class, args);
}
}
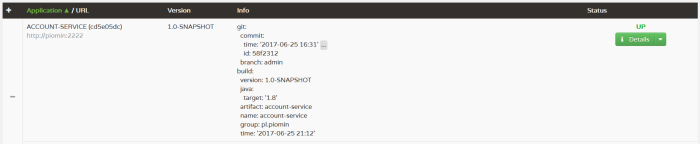
With Spring Boot Admin we may easily browse a list of applications registered in discovery server and check out the version or commit info for each of them.
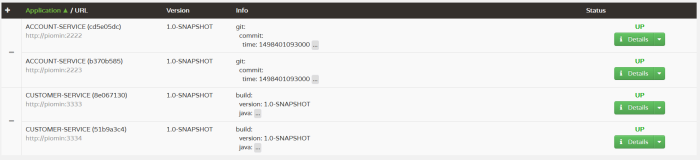
We can expand details to see all elements retrieved from /info endpoint and much more data collected from other Actuator endpoints.
Consumer-Driven Contract ( CDC) testing is one of the methods that allow you to verify integration between applications within your system. The number of such interactions may be really large especially if you maintain microservices-based architecture.
It is relatively easy to start with contract testing in Spring Boot thanks to the Spring Cloud Contract project. There are some other frameworks designed especially for CDC like Pact, but Spring Cloud Contract would probably be the first choice since we are using Spring Boot.
To use it on the producer side we need to include Spring Cloud Contract Verifier.
xxxxxxxxxx
<dependency>
<groupId>org.springframework.cloud</groupId>
<artifactId>spring-cloud-starter-contract-verifier</artifactId>
<scope>test</scope>
</dependency>
On the consumer side, we should include Spring Cloud Contract Stub Runner.
xxxxxxxxxx
<dependency>
<groupId>org.springframework.cloud</groupId>
<artifactId>spring-cloud-starter-contract-stub-runner</artifactId>
<scope>test</scope>
</dependency>
The first step is to define a contract. One of the options to write it is by using Groovy language. The contract should be verified on both the producer and consumer side. Here's
x
import org.springframework.cloud.contract.spec.Contract
Contract.make
{ request
{ method 'GET' urlPath
('/persons/1') } response
{ status OK() body(
[ id: 1,
firstName: 'John',
lastName: 'Smith',
address:
([ city: $(regex(alphaNumeric())),
country: $(regex(alphaNumeric())),
postalCode: $(regex('[0-9]{2}-[0-9]{3}')),
houseNo: $(regex(positiveInt())),
street: $(regex(nonEmpty())) ]) ])
headers { contentType(applicationJson()) } } }
The contract is packaged inside the JAR together with stubs. It may be published to a repository manager like Artifactory or Nexus, and then consumers may download it from there during the JUnit test. The generated JAR file is suffixed with stubs.
xxxxxxxxxx
(SpringRunner.class) (webEnvironment =
WebEnvironment.NONE)
(ids = {"pl.piomin.services:person-
service:+:stubs:8090"}, consumerName = "letter-consumer", stubsPerConsumer =
true, stubsMode = StubsMode.REMOTE, repositoryRoot =
"http://192.168.99.100:8081/artifactory/libs-snapshot-local")
public class PersonConsumerContractTest {
private PersonClient personClient; public void verifyPerson() {
Person p = personClient.findPersonById(1); Assert.assertNotNull(p);
Assert.assertEquals(1, p.getId().intValue());
Assert.assertNotNull(p.getFirstName());
Assert.assertNotNull(p.getLastName());
Assert.assertNotNull(p.getAddress());
Assert.assertNotNull(p.getAddress().getCity());
Assert.assertNotNull(p.getAddress().getCountry());
Assert.assertNotNull(p.getAddress().getPostalCode());
Assert.assertNotNull(p.getAddress().getStreet());
Assert.assertNotEquals(0, p.getAddress().getHouseNo()); } }
Contract testing will not verify sophisticated use cases in your microservices-based system. However, it is the first phase of testing interaction between microservices. Once you ensure the API contracts between applications are valid, you proceed to more advanced integration or end-to-end tests.
Spring Boot and Spring Cloud relatively often release the new versions of their framework. Assuming that your microservices have a small codebase it is easy to up a version of used libraries. Spring Cloud releases new versions of projects using release train pattern, to simplify dependencies management and avoid problems with conflicts between incompatible versions of libraries.
Moreover, Spring Boot systematically improves startup time and memory footprint of applications, so it is worth updating it just because of that. Here's the current stable release of Spring Boot and Spring Cloud.
xxxxxxxxxx
<parent>
<groupId>org.springframework.boot</groupId>
<artifactId>spring-boot-starter-parent</artifactId>
<version>2.2.1.RELEASE</version>
</parent>
<dependencyManagement>
<dependencies>
<dependency>
<groupId>org.springframework.cloud</groupId>
<artifactId>spring-cloud-dependencies</artifactId>
<version>Hoxton.RELEASE</version>
<type>pom</type>
<scope>import</scope>
</dependency>
</dependencies>
</dependencyManagement>
I showed you that's it is no hard to follow best practices with Spring Boot features and some additional libraries being a part of Spring Cloud. These best practices will make it easier for you to migrate into microservices-based architecture and also to run your applications in containers.
Further Reading
Quick Guide to Microservices With Spring Boot 2.0, Eureka, and Spring Cloud
Microservices Using Spring Boot and Spring Cloud — Part 1: Overview
Published at DZone with permission of Piotr Mińkowski. See the original article here.
Opinions expressed by DZone contributors are their own.
Comments