Sprinkle Some ELK on Your Spring Boot Logs
Join the DZone community and get the full member experience.
Join For Free
One day, I heard about the ELK stack and about its advantages, so I decided to get my hands on it. Unfortunately, I struggled to find solid documentation and supplemental content on getting started. So, I decided to write my own.
To start, let's get familiar with what the ELK stack is:
"ELK" is the acronym for three open source projects: Elasticsearch, Logstash, and Kibana. Elasticsearch is a search and analytics engine. Logstash is a server‑side data processing pipeline that ingests data from multiple sources simultaneously, transforms it, and then sends it to a "stash" like Elasticsearch. Kibana lets users visualize data with charts and graphs in Elasticsearch.
https://www.elastic.co/what-is/elk-stack
So basically,
- Elasticsearch takes care of the storage and manages searching and analytics via REST endpoints.
- Logstash is the “pac-man” which absorbs, filters, and sends data.
- Kibana is responsible for the fancy way of viewing the results.
For the starters, we need to download the stack (I'm on Windows):
- Elasticsearch - https://www.elastic.co/downloads/elasticsearch,
- Logstash - https://www.elastic.co/downloads/logstash (the zip archive).
- Kibana - https://www.elastic.co/downloads/kibana.
Once downloaded, you can unzip them right away. We'll come to them later. Now, we are going to set up a simple Spring Boot project that'll generate for some logs we can look at later. Here are the dependencies that we are going to need at the moment:
<dependency>
<groupId>org.springframework.boot</groupId>
<artifactId>spring-boot-starter-actuator</artifactId>
</dependency>
<dependency>
<groupId>org.projectlombok</groupId>
<artifactId>lombok</artifactId>
<optional>true</optional>
</dependency>
As simple as it is, I have decided to go with Actuator, as it'll be a fast setup to get some logs. Now, let's create a service named ActuatorMetricsService that will be responsible for our logs.
xxxxxxxxxx
public class ActuatorMetricsService {
private final MetricsEndpoint metricsEndpoint;
private final HealthEndpoint healthEndpoint;
private final InfoEndpoint infoEndpoint;
public ActuatorMetricsService(MetricsEndpoint metricsEndpoint, HealthEndpoint healthEndpoint, InfoEndpoint infoEndpoint) {
this.metricsEndpoint = metricsEndpoint;
this.healthEndpoint = healthEndpoint;
this.infoEndpoint = infoEndpoint;
}
(initialDelay = 6000, fixedDelay = 60000)
public void fetchMetrics() {
metricsEndpoint.listNames().getNames().forEach(n -> {
log.info(n + " = " + metricsEndpoint.metric(n, Collections.emptyList()).getMeasurements());
});
}
(initialDelay = 6000, fixedDelay = 30000)
public void fetchHealth() {
HealthComponent health = healthEndpoint.health();
log.info("health = {}" , health.getStatus());
}
(initialDelay = 6000, fixedDelay = 60000)
public void fetchInfo() {
infoEndpoint.info().forEach((k, v) -> log.info(k + " = " + v));
}
}
There are a few things to mention about this class if you are not familiar with what you see:
@Slf4j— Createsprivate static final org.slf4j.Logger log =org.slf4j.LoggerFactory.getLogger(LogExample.class)to be used later in our code.MetricsEndpoint,HealthEndpoint,InfoEndpoint— classes from actuator used to expose information about metrics, application health, and application information.@Scheduled— Annotation that marks a method to be scheduled. For this to work, you will have to enable scheduling with@EnableScheduling.
We will get metrics and app information every minute with an initial delay of six seconds and app health every 30 seconds with an initial delay of six seconds.
Now, let's get to setting up our logs. For that, we'll have to create the logback.xml in the resources directory.
xxxxxxxxxx
<configuration>
<property scope="context" name="log.fileExtension" value="log"></property>
<property scope="context" name="log.directory" value="/logs"></property>
<property scope="context" name="log.fileName" value="bootiful-elk"></property>
<appender name="STDOUT" class="ch.qos.logback.core.ConsoleAppender">
<layout class="ch.qos.logback.classic.PatternLayout">
<pattern>[%d{yyyy-MM-dd HH:mm:ss.SSS}] [${HOSTNAME}] [%thread] %level %logger{36}@%method:%line - %msg%n</pattern>
</layout>
</appender>
<appender name="FILE" class="ch.qos.logback.core.rolling.RollingFileAppender">
<rollingPolicy class="ch.qos.logback.core.rolling.TimeBasedRollingPolicy">
<fileNamePattern>${log.directory}/${log.fileName}.%d{yyyy-MM-dd}.${log.fileExtension}</fileNamePattern>
</rollingPolicy>
<encoder>
<pattern>[%d{yyyy-MM-dd HH:mm:ss.SSS}] [${HOSTNAME}] [%thread] %level %logger{36}@%method:%line - %msg%n</pattern>
</encoder>
</appender>
<root level="INFO">
<appender-ref ref="STDOUT"></appender>
<appender-ref ref="FILE"></appender>
</root>
</configuration>
This will get us the logs both in our console and in a file. Running the application now should give this kind of output, of course with different/same values:
[2020-03-22 20:28:25.256] [LT-IPASCARI] [scheduling-1] INFO c.e.l.b.s.ActuatorMetricsService@fetchHealth:39 - health = UP
[2020-03-22 20:28:26.262] [LT-IPASCARI] [scheduling-1] INFO c.e.l.b.s.ActuatorMetricsService@lambda$fetchMetrics$0:32 - jvm.memory.max = [MeasurementSample{statistic=VALUE, value=5.577900031E9}]
...
[2020-03-22 20:28:26.716] [LT-IPASCARI] [scheduling-1] INFO c.e.l.b.s.ActuatorMetricsService@lambda$fetchMetrics$0:32 - process.start.time = [MeasurementSample{statistic=VALUE, value=1.584901694856E9}]
[2020-03-22 20:28:26.719] [LT-IPASCARI] [scheduling-1] INFO c.e.l.b.s.ActuatorMetricsService@lambda$fetchInfo$1:44 - app = {name=bootiful-elk, description=Demo project for Spring Boot, version=0.0.1-SNAPSHOT, encoding=UTF-8, java={version=1.8.0_171}}
The same logs should be in the file too. Now that we've set up our application, it's time to get to the ELK. I am going to discuss two methods of getting your logs to be seen in Kibana:
- Tell Logstash to look into your log file(s).
- Tell Logstash to listen for log entries.
We'll start with the first one as it is the most difficult from my point of view to set up.
First of all, you need to know that there are three important parts of Logstash:
- Input plugin — enables a specific source of events to be read by Logstash. You can check out all of them here (https://www.elastic.co/guide/en/logstash/current/input-plugins.html), but we are going with
filefor this demo. - Filter plugin — performs intermediary processing on an event. Filters are often applied conditionally, depending on the characteristics of the event. Again, here, https://www.elastic.co/guide/en/logstash/current/filter-plugins.html, you can find lots of them, but we will use a few of them, such as
grok,date,mutate - Output plugin — sends event data to a particular destination. Outputs are the final stage in the event pipeline. Here are all the plugins https://www.elastic.co/guide/en/logstash/current/output-plugins.html, but in this demo, we will make use of
elasticsearchandstdout.
Now that we've got the basics, let's get our hands dirty. Find your unzipped Logstash folder and get to the config folder (logstash-7.6.1\config) and create a file named logstash-file.conf with this content:
xxxxxxxxxx
input {
file {
path => "D:/logs/*.log"
codec => "plain"
type => "logback"
}
}
output {
stdout { }
elasticsearch {
hosts => ["localhost:9200"]
index => "bootiful-elk-file-%{+YYYY.MM.dd}"
}
}
Let's take a look at what we have to do here as it is very simple for the moment.
- input plugin
- file — that means we are dealing with a file as an input
- path - this is the absolute path to your log file(s). This is a required setting.
- codec - convenient method for decoding your data before it enters the input, without needing a separate filter in your Logstash pipeline. The default one is plain, but I still used this one, as it is important.
- type - is stored as part of the event itself, so you can also use the type to search for it in Kibana.
- file — that means we are dealing with a file as an input
- output plugin
- stdout - a simple output that prints to the STDOUT of the shell running Logstash. This output can be quite convenient when debugging plugin configurations. Default codec is rubydebug: outputs event data using the ruby "awesome_print" library
- elasticsearch - if you plan to use the Kibana web interface, use the Elasticsearch output plugin to get your log data into Elasticsearch.
- hosts - sets the host(s) of the remote instance. In this case, when we'll launch Elasticsearch locally, it'll be on
127.0.0.1:9200. - index - The index to write events to. This can be dynamic using the %{foo} syntax. The default value, which is "
logstash-%{+YYYY.MM.dd}" will partition your indices by day so you can more easily delete old data or only search specific date ranges.
- hosts - sets the host(s) of the remote instance. In this case, when we'll launch Elasticsearch locally, it'll be on
Okay, now that we understand what we have in logstash-file.conf it is time to start our services and view them. We will start in the following order :
- Elasticsearch — elasticsearch-7.6.1\bin\elasticsearch.bat. You can check if started with with
curl -G 127.0.0.1:9200. - Kibana — kibana-7.6.1-windows-x86_64\bin\kibana.bat. It'll start the Kibana web interface on
127.0.0.1:5601. You can go ahead and check it out (skip all the tutorials). - Logstash — logstash-7.6.1\bin and from the command line run the following command to pick up the created configuration
logstash -f ../config/logstash-file.conf. - Application - run you Spring application.
We got our streaming of logs set up, but we want to check them out, right? To do that, we have to link our Elasticsearch index to Kibana. To do that, go to your Kibana web interface and check out the Index Patterns and click on Create index param. From there you will see our defined pattern bootiful-elk-file-2020.03.22 our defined pattern, write it in the index pattern section and click Next step, then you can add some settings, for now click I don`t want to use the Time Filter and finish the setup. From that point you can go to Discover and check out your logs.
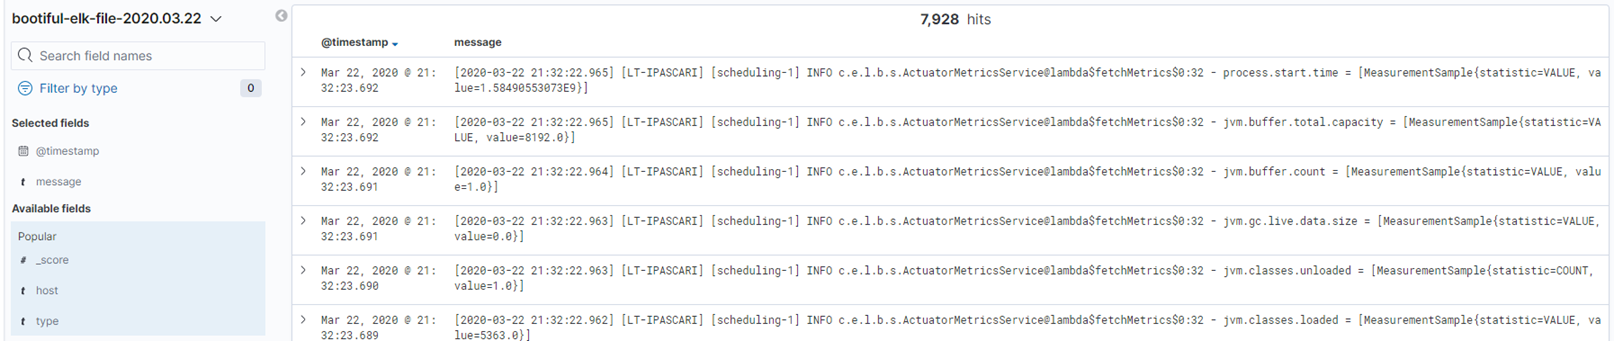
You should see something like that. If not, play around with the available filter fields. But you can see that something is not quite right, we got an entire log line as the message, which is not really useful for us as we can not make use of other fields from that log line. For that purpose we need to bring on the filter plugin which is going to break down our log line into separate fields which can be used as filter fields, sorting fields and in KQL (Kibana Query Language).
Let`s modify our configuration to look like this
xxxxxxxxxx
input {
file {
path => "D:/logs/*.log"
codec => "plain"
type => "logback"
}
}
filter {
if [message] =~ "\tat" {
grok {
match => ["message", "^(\tat)"]
add_tag => ["stacktrace"]
}
}
grok {
match => [ "message",
"(?m)\[%{TIMESTAMP_ISO8601:timestamp}\] \[%{HOSTNAME:host}\] \[%{DATA:thread}\] %{LOGLEVEL:logLevel} %{DATA:class}@%{DATA:method}:%{DATA:line} \- %{GREEDYDATA:msg}"
]
}
date {
match => [ "timestamp" , "yyyy-MM-dd HH:mm:ss.SSS" ]
}
mutate {
remove_field => ["message"]
}
}
output {
stdout { codec => rubydebug }
elasticsearch {
hosts => ["localhost:9200"]
index => "bootiful-elk-file-%{+YYYY.MM.dd}"
}
}
Now let`s discuss about what is new here
- filter plugin
- if construction - we check that if our message contains a tab and at we will qualify it as a stacktrace, so we will add the corresponding tag.
- grok - Grok is a great way to parse unstructured log data into something structured and queryable. This tool is perfect for syslog logs, apache and other webserver logs, mysql logs, and in general, any log format that is generally written for humans and not computer consumption. Make sure that your match pattern is valid corresponding to your log`s pattern, you can go ahead and validate them with online grok tool validators.
- date - is used for parsing dates from fields, and then using that date or timestamp as the logstash timestamp for the event.
- mutate - allows you to perform general mutations on fields. You can rename, remove, replace, and modify fields in your events. Here I wanted to remove the "message" fields as I broke it down in little pieces with Grok so I did not want it to just lay around.
Okay, let`s restart our Logstash - logstash-7.6.1\bin and from the command line run the following command to pick up the created configuration logstash -f ../config/logstash-file.conf and see what do we have in Kibana now, you should see something like this.
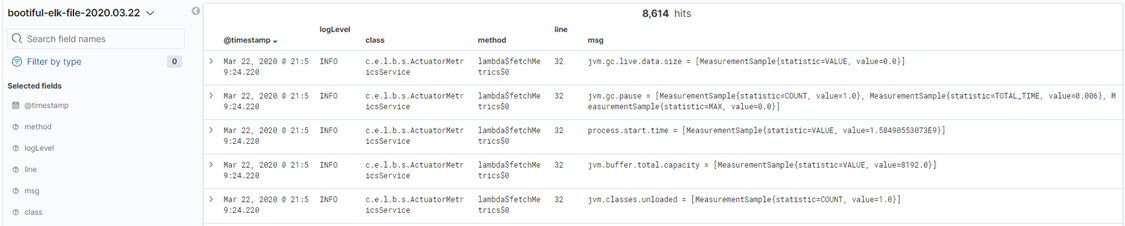
Now we got a proper output, you can observe that our long message line got broken into many separate fields which can be used now for an effective search and analysis. That is pretty much it about the first method, you can go ahead and explore more filtering options, ways of customizing your data, trying out different codecs for specific plugins etc.
About the second method, about pushing your log lines directly from Spring Boot application to Logstash -> Elasticsearch -> Kibana. For that we will need to add one more dependency to our pom.xml so it looks like this
xxxxxxxxxx
<dependency>
<groupId>org.springframework.boot</groupId>
<artifactId>spring-boot-starter-actuator</artifactId>
</dependency>
<dependency>
<groupId>net.logstash.logback</groupId>
<artifactId>logstash-logback-encoder</artifactId>
<version>6.3</version>
</dependency>
<dependency>
<groupId>org.projectlombok</groupId>
<artifactId>lombok</artifactId>
<optional>true</optional>
</dependency>
Now that we got our dependency, we can go ahead and modify our logback.xml too.
xxxxxxxxxx
<configuration>
<property scope="context" name="log.fileExtension" value="log"/>
<property scope="context" name="log.directory" value="/logs"/>
<property scope="context" name="log.fileName" value="bootiful-elk"/>
<appender name="STDOUT" class="ch.qos.logback.core.ConsoleAppender">
<layout class="ch.qos.logback.classic.PatternLayout">
<pattern>[%d{yyyy-MM-dd HH:mm:ss.SSS}] [${HOSTNAME}] [%thread] %level %logger{36}@%method:%line - %msg%n</pattern>
</layout>
</appender>
<appender name="FILE" class="ch.qos.logback.core.rolling.RollingFileAppender">
<rollingPolicy class="ch.qos.logback.core.rolling.TimeBasedRollingPolicy">
<fileNamePattern>${log.directory}/${log.fileName}.%d{yyyy-MM-dd}.${log.fileExtension}</fileNamePattern>
</rollingPolicy>
<encoder>
<pattern>[%d{yyyy-MM-dd HH:mm:ss.SSS}] [${HOSTNAME}] [%thread] %level %logger{36}@%method:%line - %msg%n</pattern>
</encoder>
</appender>
<appender name="STASH" class="net.logstash.logback.appender.LogstashTcpSocketAppender">
<destination>127.0.0.1:5000</destination>
<!-- encoder is required -->
<encoder class="net.logstash.logback.encoder.LogstashEncoder"/>
<keepAliveDuration>5 minutes</keepAliveDuration>
</appender>
<root level="INFO">
<appender-ref ref="STDOUT"/>
<appender-ref ref="STASH"/>
<appender-ref ref="FILE"/>
</root>
</configuration>
You might notice what has changed: a new appender appeared in logback.xml, that is LogstashTcpSocketAppender and LogstashEncoder, which will encode in JSON our log lines and send them via TCP to 127.0.0.1:5000.
Now that we know the format of our log lines and their destination, we have to set up a destination, which will listen for JSON events on 127.0.0.1:5000. For that, we'll create a new file in Logstash's config folder (logstash-7.6.1\config) and create a file named logstash-tcp.conf with this content:
xxxxxxxxxx
input {
tcp {
port => "5000"
codec => json_lines
}
}
output {
stdout {}
elasticsearch {
hosts => ["http://localhost:9200"]
index => "bootiful-elk-tcp-%{+YYYY.MM.dd}"
}
}
As said, I set up a destination, which is, in fact, the source/input of Logstash, tcp input plugin with port 5000 and codec json_lines. The output, as you might observe, is the same, with one important change. I did not want to flood the file logs container created previously with these log lines, so I decided on using a different index, bootiful-elk-tcp-%{+YYYY.MM.dd} . Also, I am not using any filter plugin here, as the message is encoded/decoded from JSON, which already breaks the log line into pieces.
Okay, now we can restart our Logstash — logstash-7.6.1\bin and from the command line run the following command to pick up the created configuration logstash -f ../config/logstash-tcp.conf. Restart the Spring Boot application and see what we have in Kibana now. (Don't forget to repeat the steps of creating a new Index Pattern.) You should see something like this:
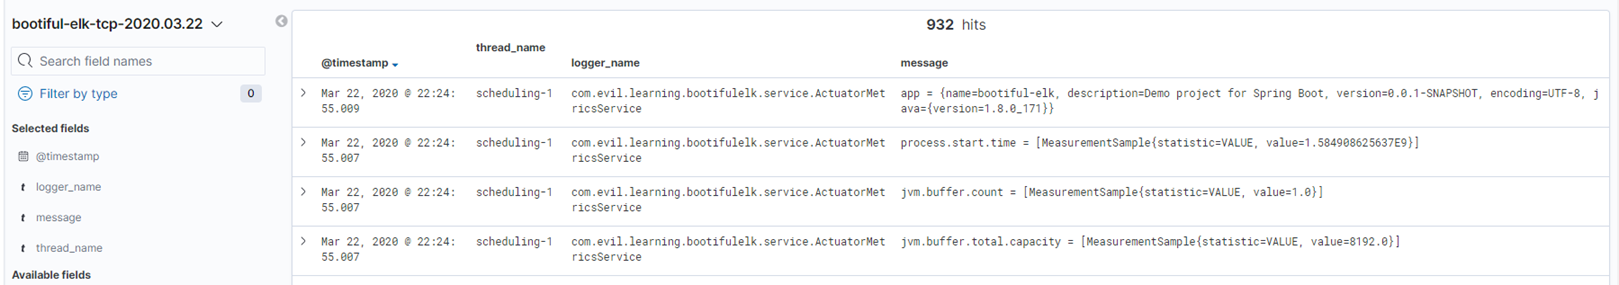
Notice that we got a bit different fields, but close to the ones that we`ve been mapping previously with Grok.
All right, basically that is it. You can find these 2 .conf files in the resources folder of my project and other related files to this article here https://github.com/theFaustus/bootiful-elk.
Opinions expressed by DZone contributors are their own.
Comments