SQL Performance Tuning: Top 5 Ways to Find Slow Queries
They happen: queries in SQL Server that run a bit too slow for anyone's liking. Here, we take a look at how to track them down quickly so you can deal with those queries!
Join the DZone community and get the full member experience.
Join For FreeSQL performance tuning is a never ending battle. I’m not a DBA, but I am a developer who has pretended to be one for 15 years. I have worked with SQL Server databases with terrabytes of RAM all the way down to Stackify’s massive fleet of little SQL Azure databases. I have seen a little bit of everything over the years.
In this article, I’m going to provide some tips for how developers can find slow SQL queries and do performance tuning in SQL Server.
5 Ways to Find Slow SQL Queries
1. Find Slow Queries With SQL DMVs
One of the great features of SQL Server is all of the dynamic management views (DMVs) that are built into it. There are dozens of them and they can provide a wealth of information about a wide range of topics.
There are several DMVs that provide data about query stats, execution plans, recent queries and much more. These can be used together to provide some amazing insights.
For example, this query below can be used to find the queries that use the most reads, writes, worker time (CPU), etc.
SELECT TOP 10 SUBSTRING(qt.TEXT, (qs.statement_start_offset/2)+1,
((CASE qs.statement_end_offset
WHEN -1 THEN DATALENGTH(qt.TEXT)
ELSE qs.statement_end_offset
END - qs.statement_start_offset)/2)+1),
qs.execution_count,
qs.total_logical_reads, qs.last_logical_reads,
qs.total_logical_writes, qs.last_logical_writes,
qs.total_worker_time,
qs.last_worker_time,
qs.total_elapsed_time/1000000 total_elapsed_time_in_S,
qs.last_elapsed_time/1000000 last_elapsed_time_in_S,
qs.last_execution_time,
qp.query_plan
FROM sys.dm_exec_query_stats qs
CROSS APPLY sys.dm_exec_sql_text(qs.sql_handle) qt
CROSS APPLY sys.dm_exec_query_plan(qs.plan_handle) qp
ORDER BY qs.total_logical_reads DESC -- logical reads
-- ORDER BY qs.total_logical_writes DESC -- logical writes
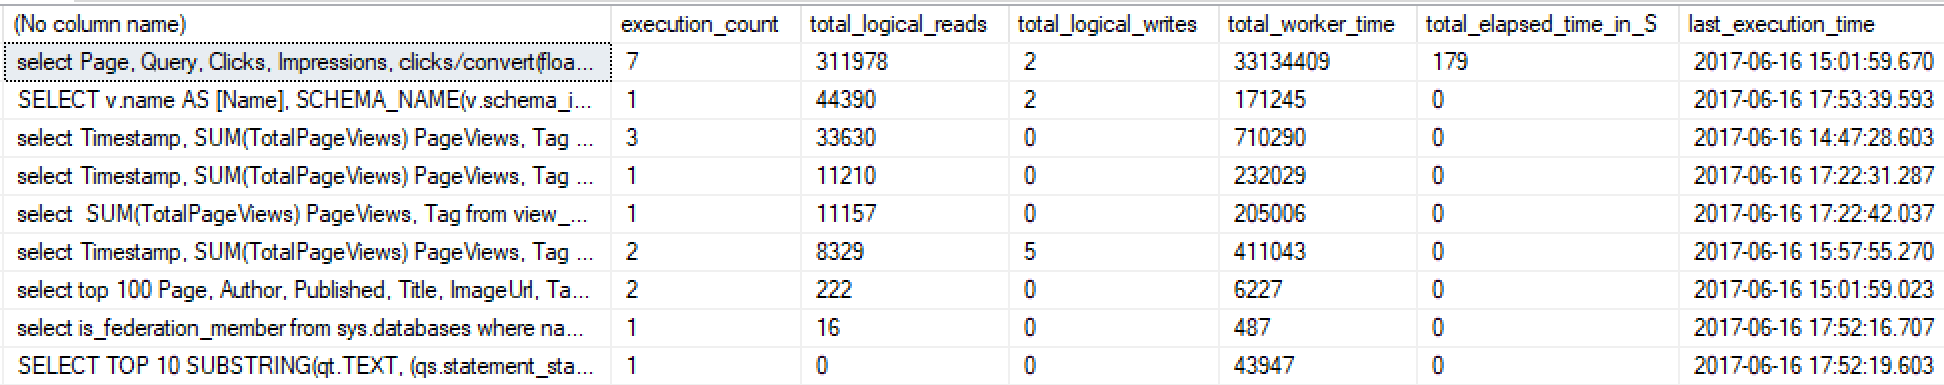
-- ORDER BY qs.total_worker_time DESC -- CPU timeThe result of the query will look something like this below. The image below is from a marketing app I made. You can see that one particular query (the top one) takes up all the resources.
By looking at this, I can copy that SQL query and see if there is some way to improve it, add an index, etc.
Pros: Always available basic rollup statistics.
Cons: Doesn’t tell you what is calling the queries. Can’t visualize when the queries are being called over time.
2. Query Reporting via APM Solutions
One of the great features of many application performance management (APM) tools is their ability to track SQL queries. For example, Retrace tracks SQL queries across multiple database providers, including SQL Server. Retrace can tell you how many times a query has been executed, how long it takes on average, and what transactions are calling it. This is really valuable information for SQL performance tuning.
APM solutions collect this data by doing lightweight performance profiling against your application code at runtime.
Below is a screenshot from Retrace’s application dashboard that shows for a particular application, which SQL queries take the longest.
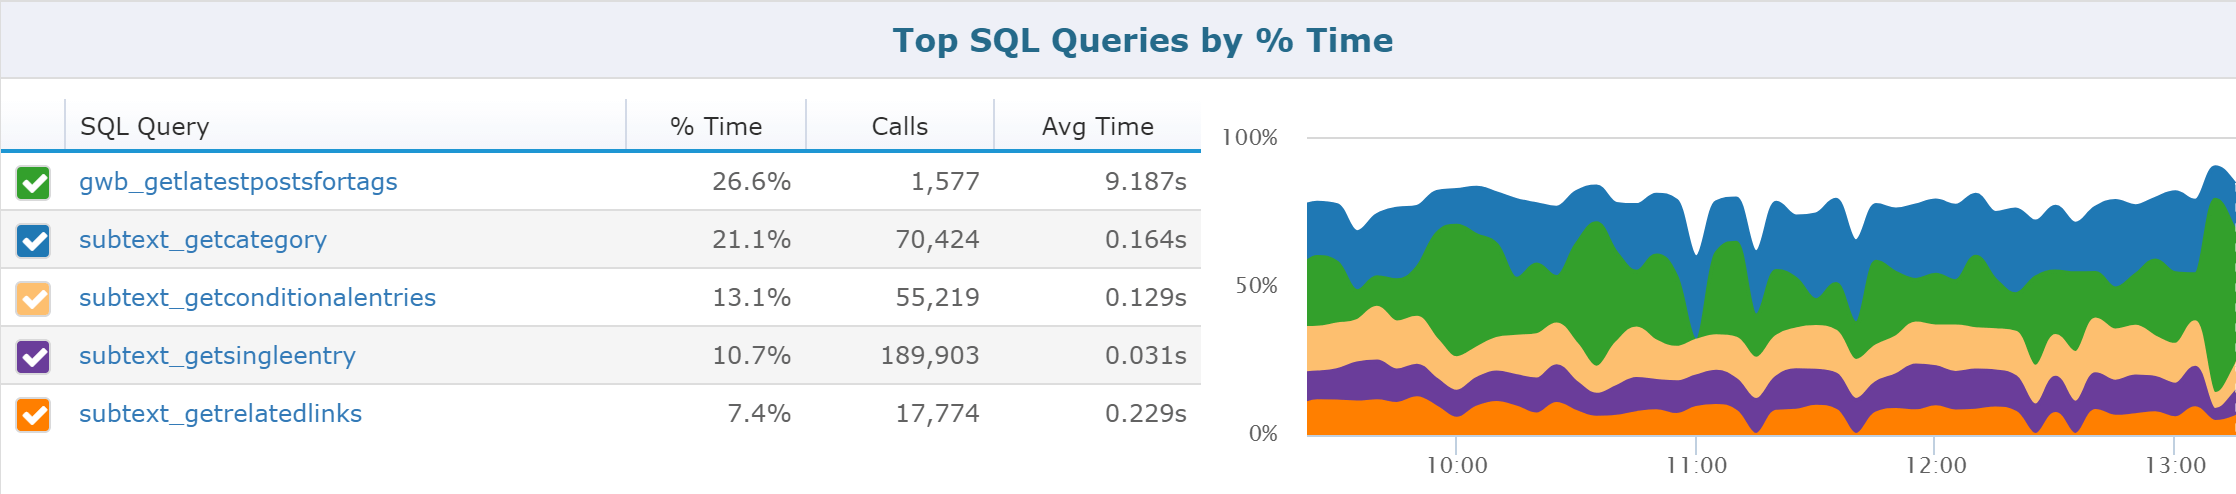
Retrace Top SQL Queries
Retrace collects performance statistics about every single SQL query being executed. You can search for specific queries to hunt down potential problems.
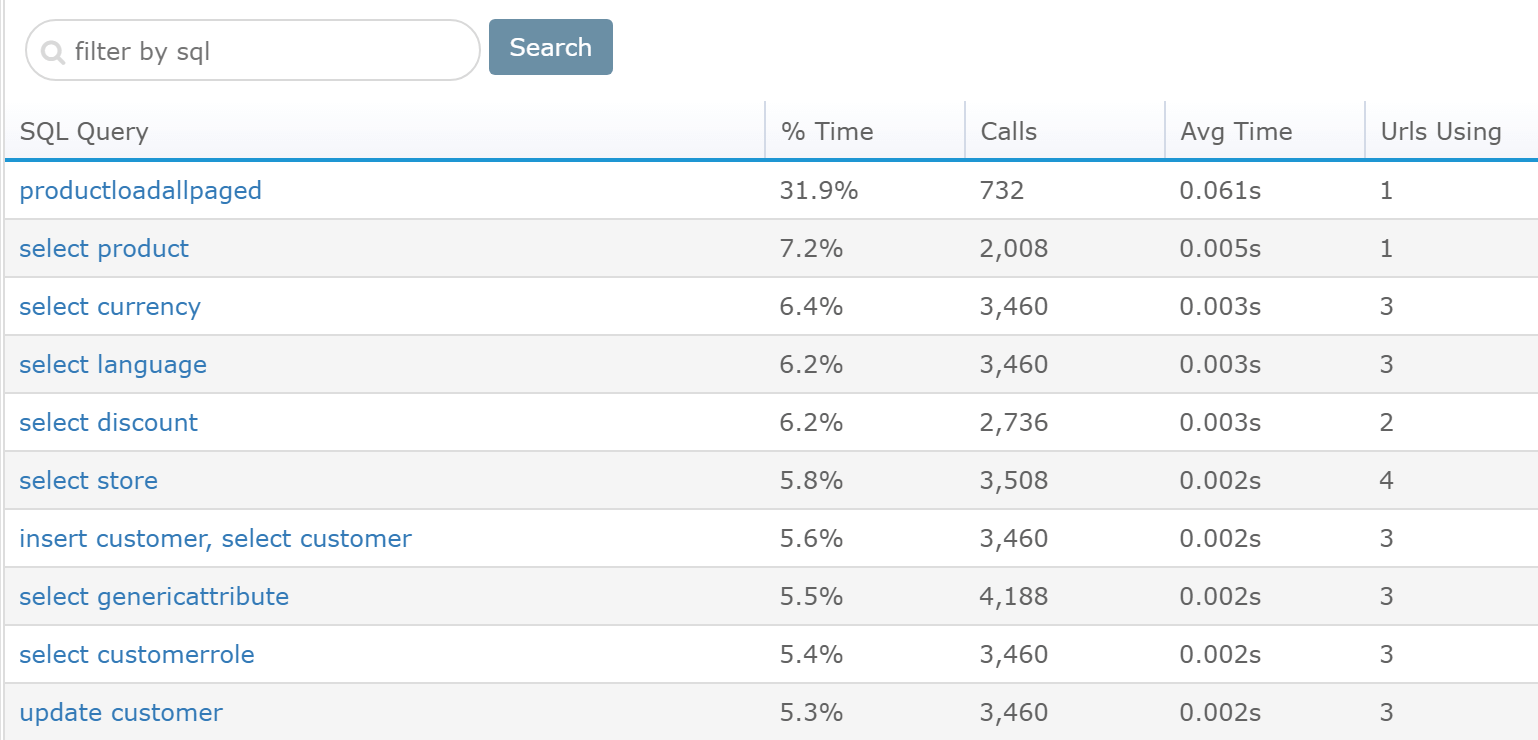
Retrace View All SQL Queries
By selecting an individual query, you can see how often that query is called over time and how long it takes. You can also see what web pages use the SQL query and how their performance is impacted by it.
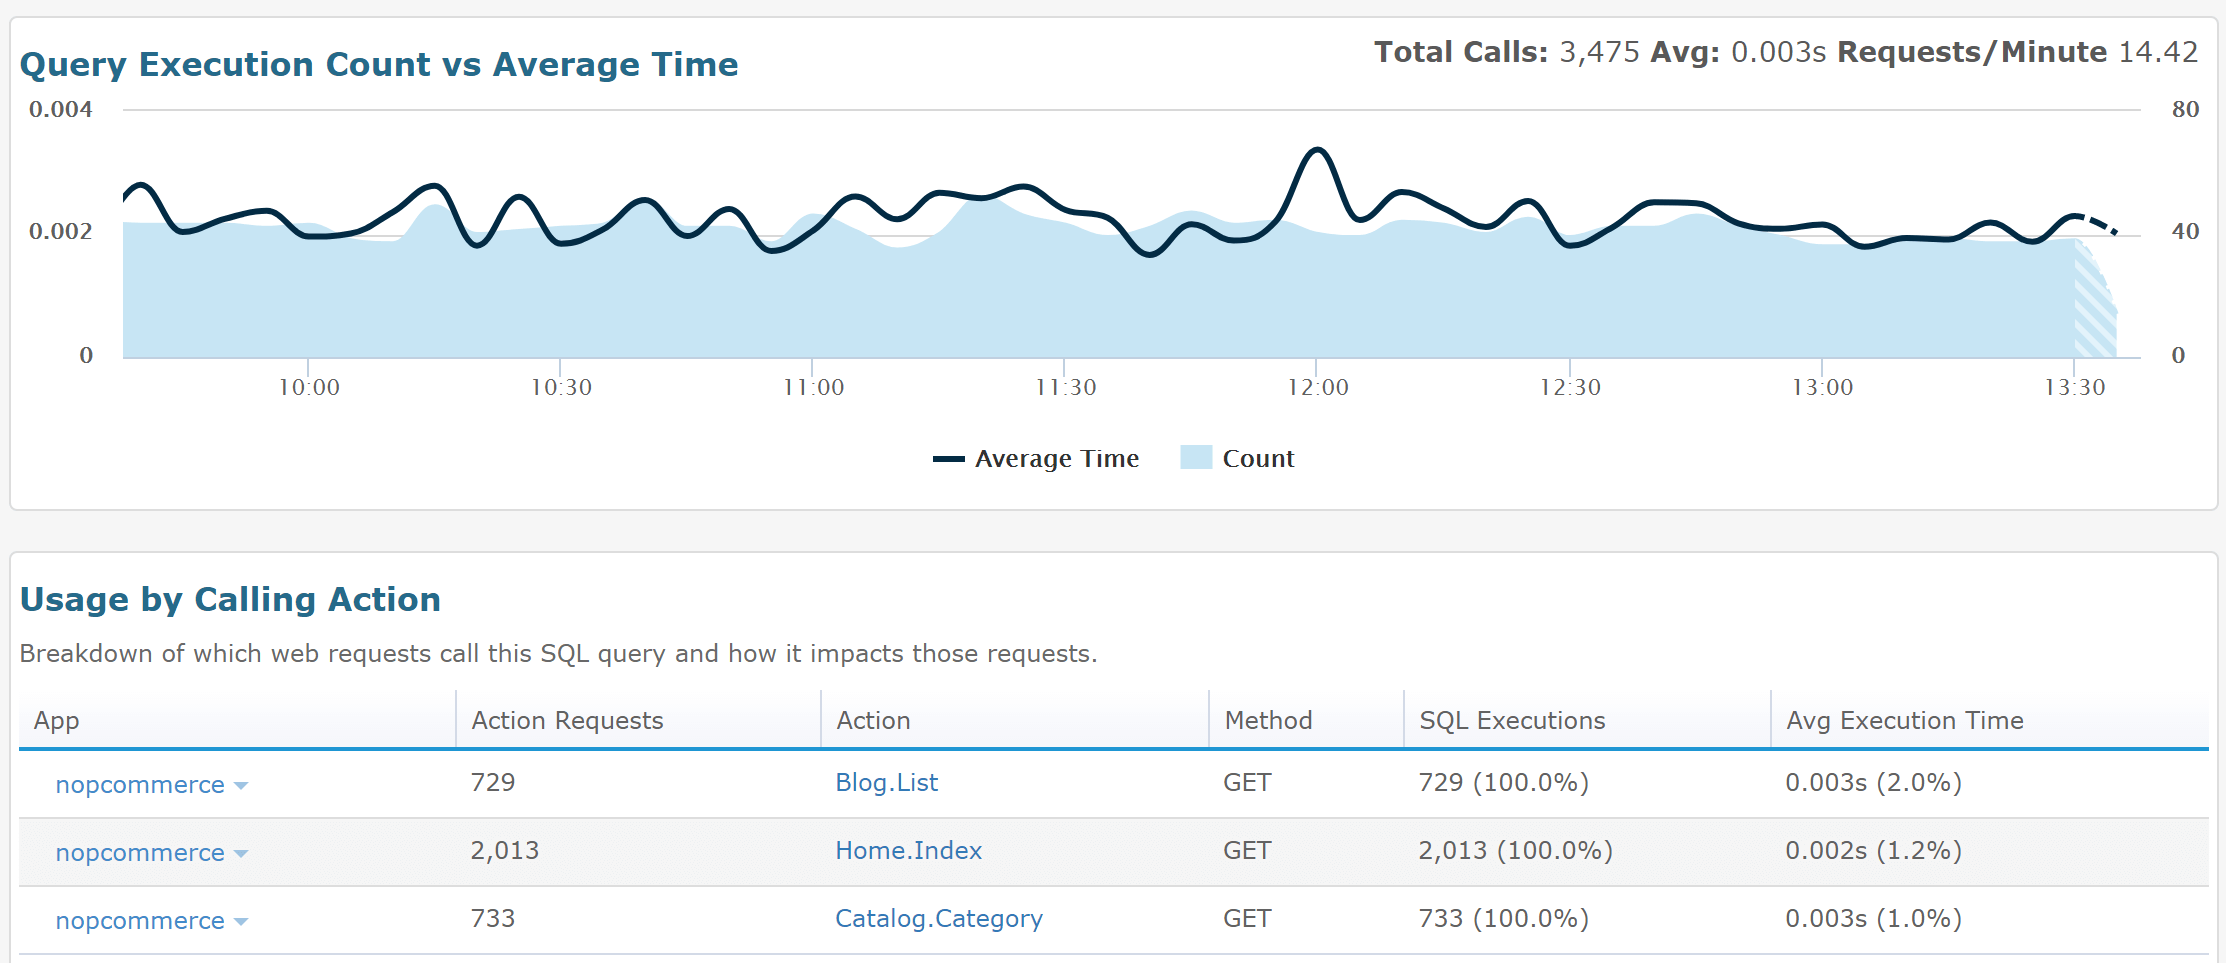
Retrace SQL Performance Over Time
Since Retrace is a lightweight code profiler and captures ASP.NET request traces, it can even show you the full context of what your code is doing.
Below is a captured trace that shows all of the SQL queries and other details about what the code was doing. Retrace can even show log messages within this same view. Also, notice that it shows the server address and database name the query is being executed on. You can also see how many records were returned.
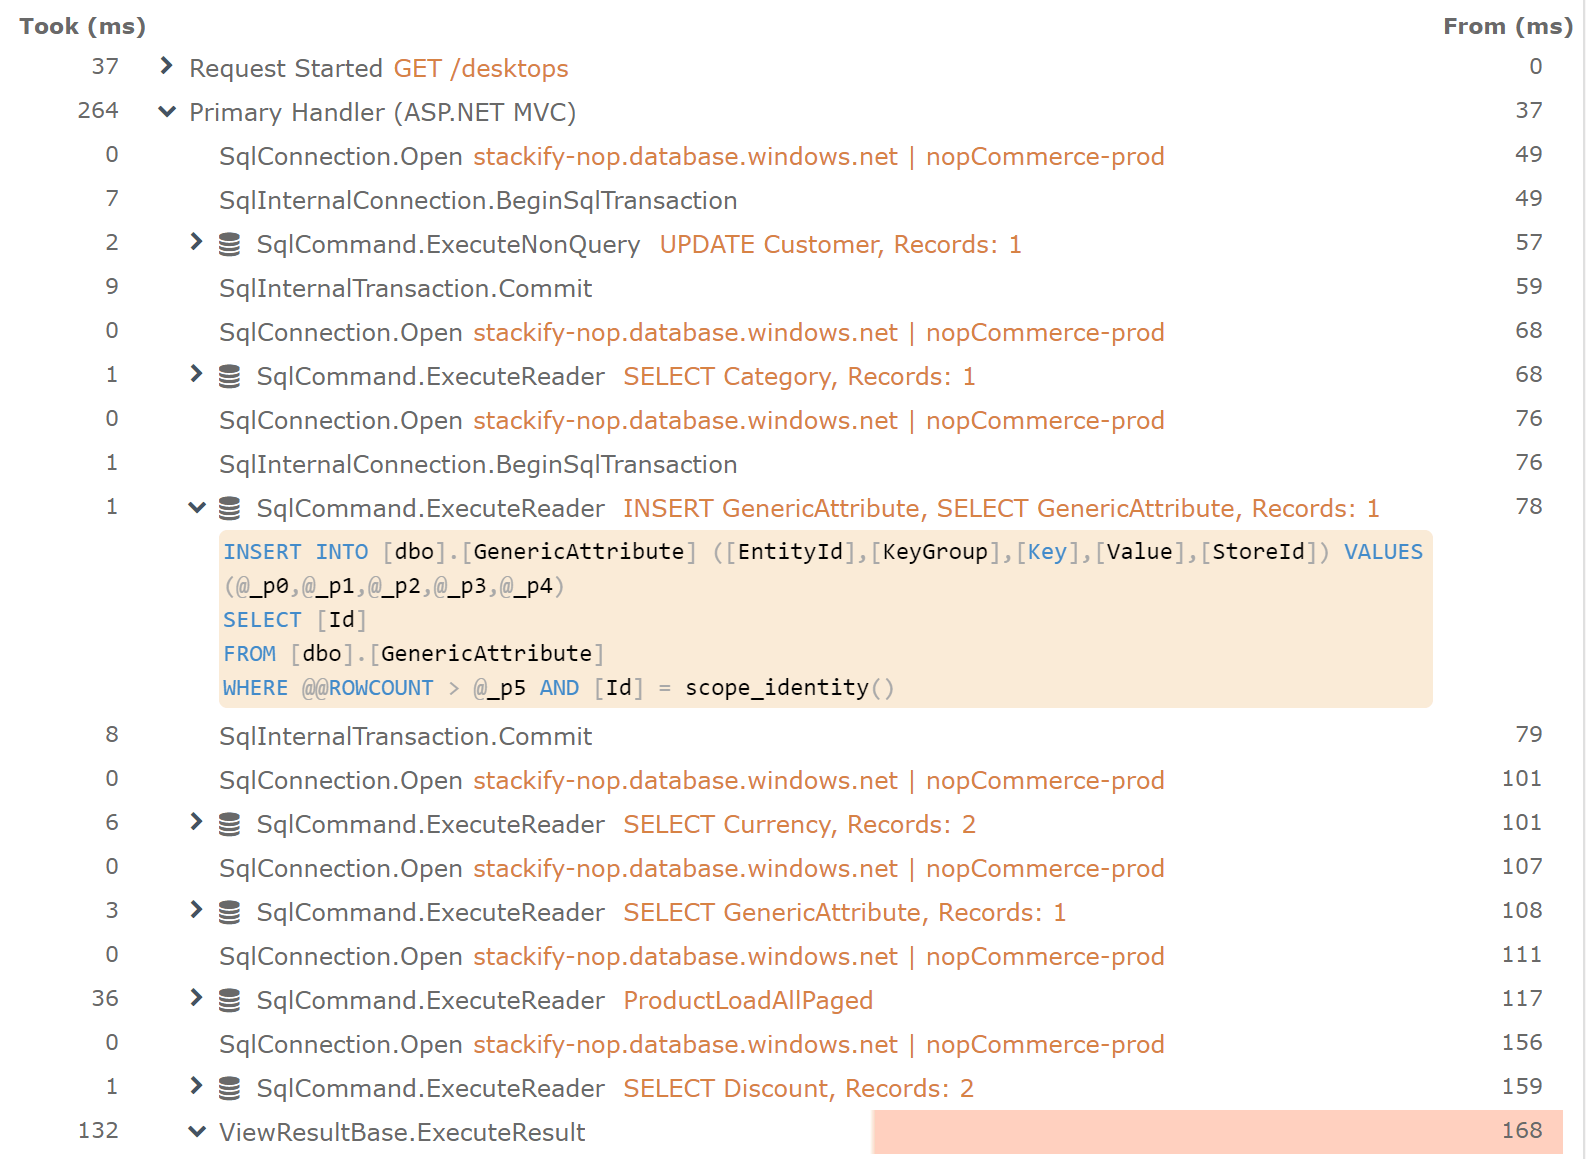
Retrace Web Transaction Trace
As you can see, Retrace provides comprehensive SQL reporting capabilities as part of its APM capabilities. It also provides multiple monitoring and alerting features around SQL queries.
Pros: Detailed reporting across apps, per app, and per query. Can show transaction traces detailed how queries are used. Starts at just $10 a month. Is always running once installed.
Cons: Does not provide the number of reads or writes per query.
3. SQL Server Profiler (DEPRECATED!)
The SQL Server Profiler has been around for a very long time. It is very useful if you are trying to see in real time what SQL queries are being executed against your database.
NOTE: Microsoft has announced that SQL Server Profiler is being deprecated!
SQL Profiler captures very detailed events about your interaction with SQL Server:
- Login connections, disconnections, and failures.
- SELECT, INSERT, UPDATE, and DELETE statements.
- RPC batch status calls.
- Start and end of stored procedures.
- Start and end of statements within a stored procedure.
- Start and end of a SQL batch.
- Errors written to the SQL Server error log.
- A lock acquired or released on a database object.
- An opened cursor.
- Security permission checks.
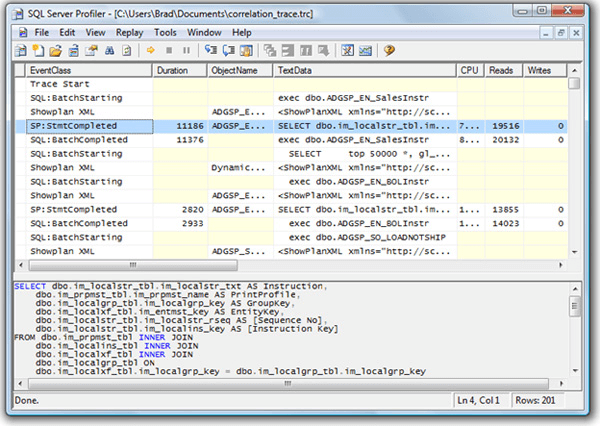
SQL Server Profiler
Tutorial: SQL Server Profiler
Pros: Very detailed data available.
Cons: You have to manually turn it on. This forces you to recreate a scenario you are trying to capture. It is eventually going away in favor of Extended Events.
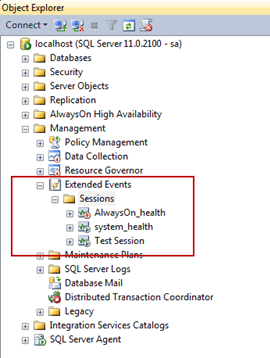
4. SQL Server Extended Events
The SQL Profiler has been replaced by SQL Server Extended Events. This is sure to anger a lot of people but I can understand why Microsoft is doing it.
Extended Events works via Event Tracing (ETW). This has been the common way for all Microsoft related technologies to expose diagnostic data.
ETW provides much more flexibility. As a developer, I could easily tap into ETW events from SQL Server to collect data for custom uses. That is really cool and really powerful.
MORE: Introducing SQL Server Extended Events
Pros: Easier to enable and leave running. Easier to develop custom solutions with.
Cons: Since it is fairly new, most people may not be aware of it.
5. SQL Azure Query Performance Insights
I am going to assume that SQL Azure’s performance reporting is built on top of Extended Events. Within the Azure Portal, you can get access to a wide array of performance reporting and optimization tips that are very helpful.
Note: These reporting capabilities are only available for databases hosted on SQL Azure.
In the screenshot below you can see how SQL Azure makes it easy to use your queries that use the most CPU, Data IO, and Log IO. It has some great basic reporting built into it.

SQL Azure Top Queries
You can also select an individual query and get more details to help with SQL performance tuning.
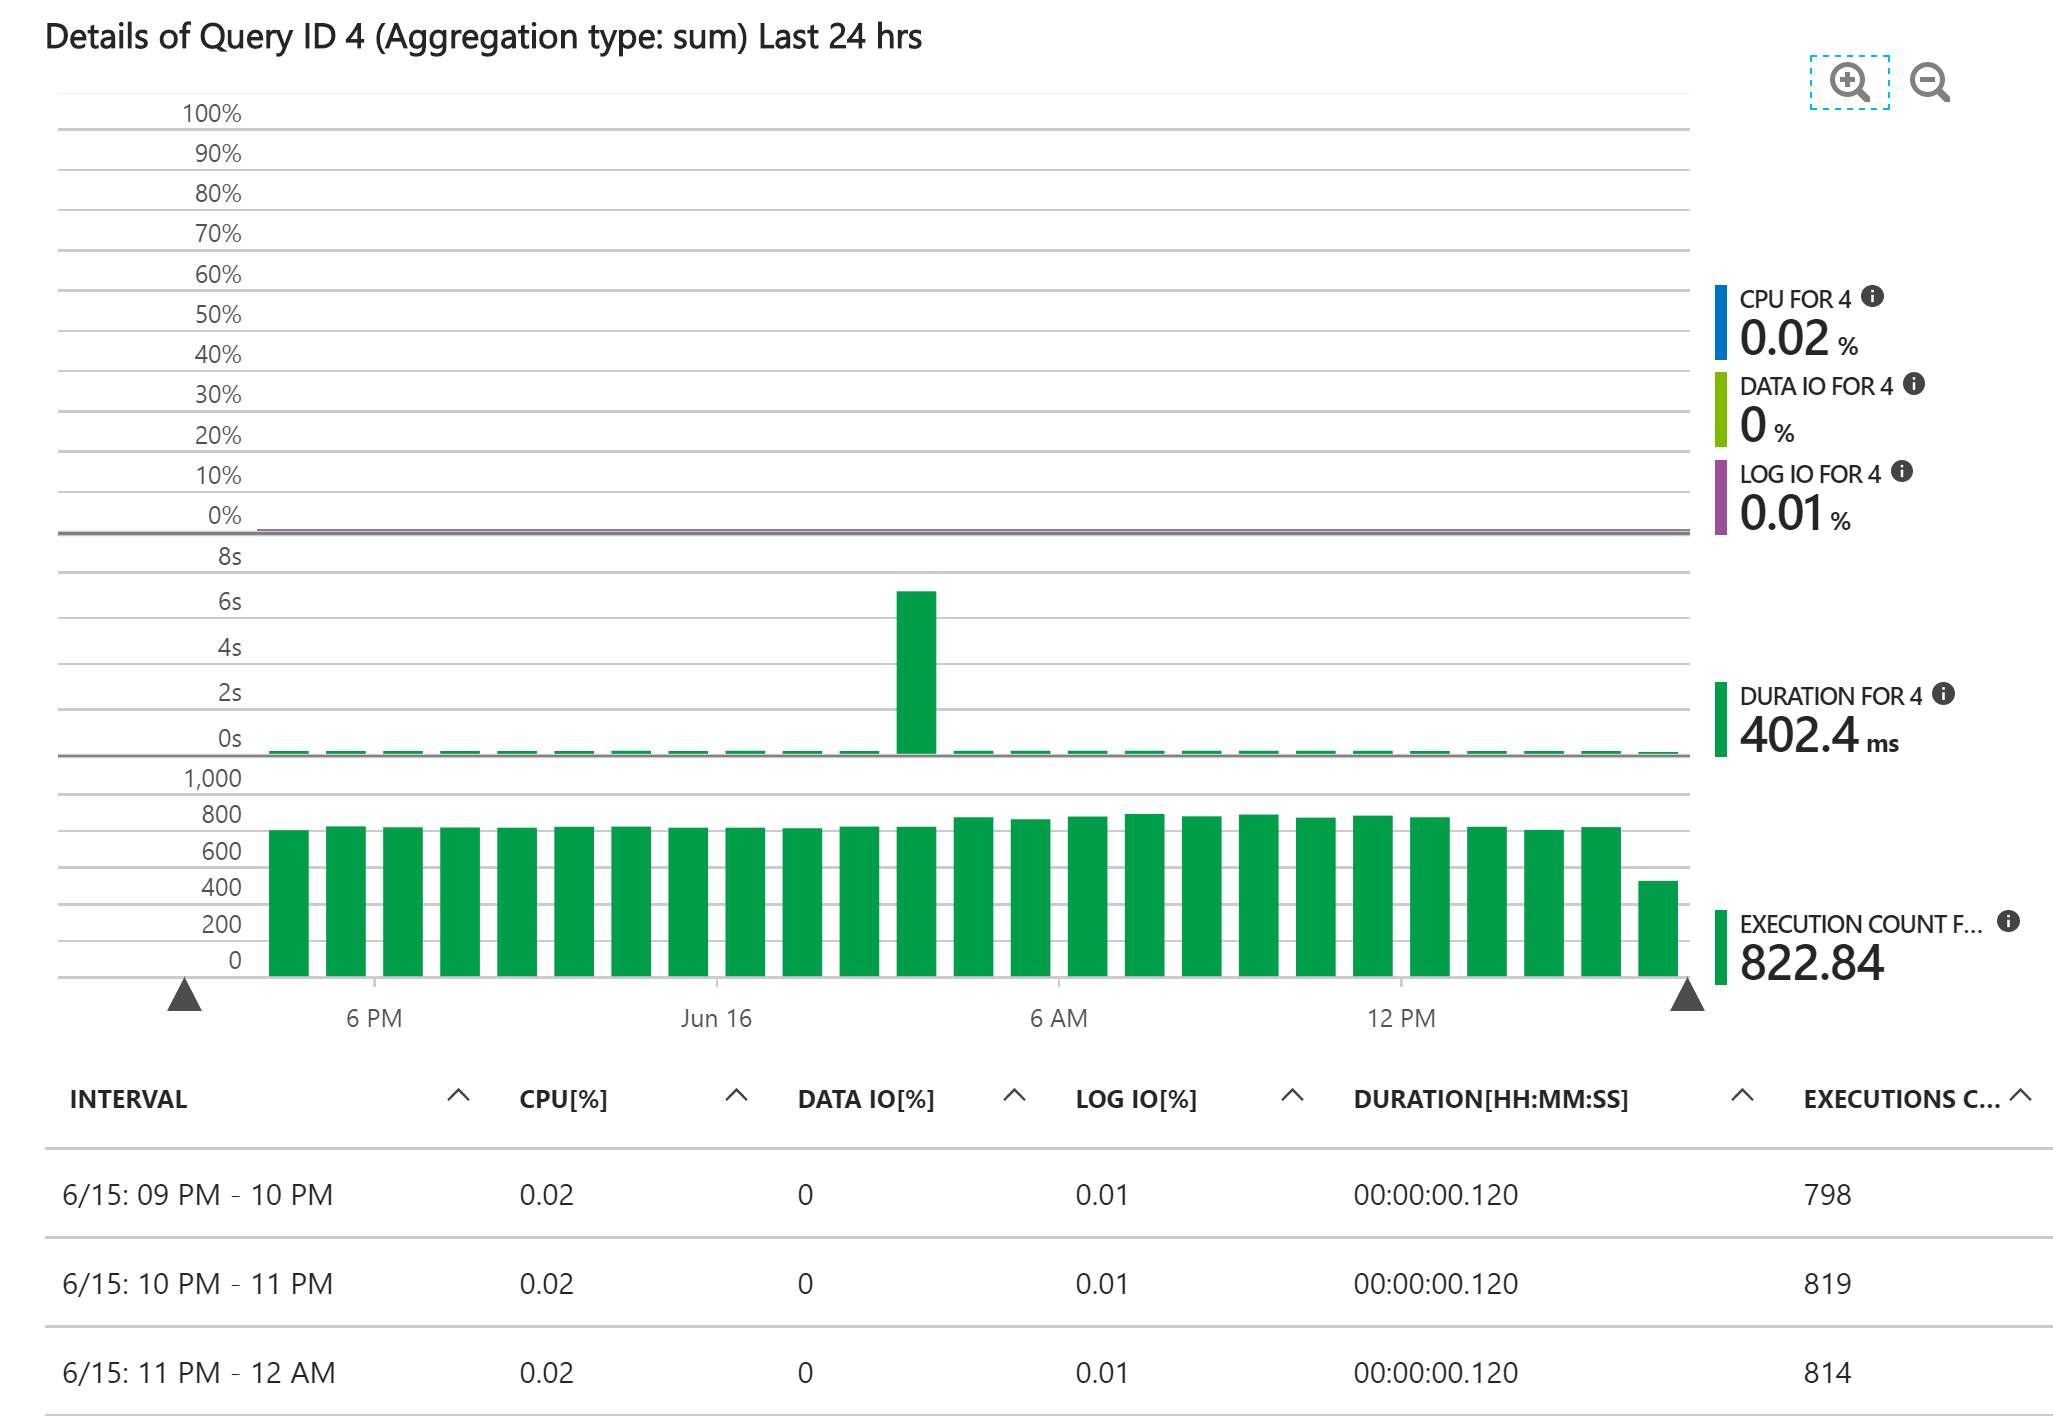
SQL Azure Query Details
Pros: Great basic reporting.
Cons: Only works on Azure. No reporting across multiple databases.
Summary
Next time you need to do some performance tuning with SQL Server, you will have a few options at your disposal to consider. Odds are, you will use more than one of these tools depending on what you are trying to accomplish.
If you are using an APM solution like Retrace, be sure to check what kind of SQL performance functionality it has built-in. If you don’t have an APM solution or aren’t sure what it is, be sure to read this: What is Application Performance Management and 10 critical features that developers need in APM.
Published at DZone with permission of Matt Watson. See the original article here.
Opinions expressed by DZone contributors are their own.
Comments