


Cutting Telemetry Volume Is Not the Same as Cutting Noise
A volume target removes bytes, not noise. Once easy cuts run out, you pay in answers you won't have. Govern the questions your team asks, not bytes per day.
Almost every conversation about observability budgets I have been in ultimately arrives at the same conclusion: “we need to reduce our telemetry volume.” That sentence is usually followed by a number. Thirty percent. Half. Whatever the finance spreadsheet needs it to be.
Then someone says the thing that makes everyone in the room relax. "Good news: most of it’s noise anyway. We can cut the volume and improve the signal at the same time."
It is a comforting idea, because it turns an unpleasant budget cut into an engineering improvement. But it only gets you so far.
It is true that some of your telemetry is noise, but it’s much less of it than "most." But it doesn’t follow that you can then simply cut volume and automatically improve signal.
There is real noise in your telemetry, and I will get to where it lives. But "reduce volume by thirty percent" is not an instruction to remove noise. It is an instruction to remove bytes, and your noise and your signal are made of the same bytes. The target doesn’t differentiate, so what you end up removing is dictated by whatever is easiest to find.
What is easy to find is a category. All INFO logs. All user agent strings. Everything below WARN. Categories are easy because your pipeline already knows them, and that is the whole of their appeal. Whether a category happens to be useful or not is a coincidence.
So your telemetry is full of junk, but the problem isn't that there is too much of it. It is that by adopting a volume reduction target, you are not looking at whether the telemetry data you cut has any value. Once you hit the byte target, the exercise is seen as a success.
Two Axes, Loosely Coupled
When you change your telemetry pipeline, two things move.
The first is easy: bytes through the pipeline, or active series if it is metrics, or whichever unit your contract happens to price. One number, on a chart, updated hourly. This is what we call volume.
The second is what those bytes enable you to find out. Whether, six weeks from now, you can still answer the question in front of you. This is what we commonly call signal, and everything else is noise. It is measurable, but it is not measured in bytes, and it is probably not on any chart you are currently looking at.
The two are related, obviously. Delete everything, and both go to zero. But across the range you actually operate in, they are only loosely coupled, because the bytes in your telemetry are not distributed anything like the value.
The smallest fields often do the most work. A tenant identifier is a few dozen bytes, and it tells you whether something is impacting everyone or just one customer. A trace ID is thirty-two hex characters, but without it you are correlating your signals by hand, across three browser tabs. If the resource attributes naming the deployment are missing, good luck telling a bad release from a bad node.
On the flipside, fields that take the most space frequently do the least. Meanwhile, the ten-thousandth identical stack trace in an hour is several kilobytes and tells you the same thing the first one did.
So a lever that operates on bytes will spend most of its effect in the wrong place, and no exchange rate exists that would let you convert one axis into the other. Drawing them as two axes is a crude picture for that reason. But it is still worth doing, because it separates four moves that a byte count reports as only two.
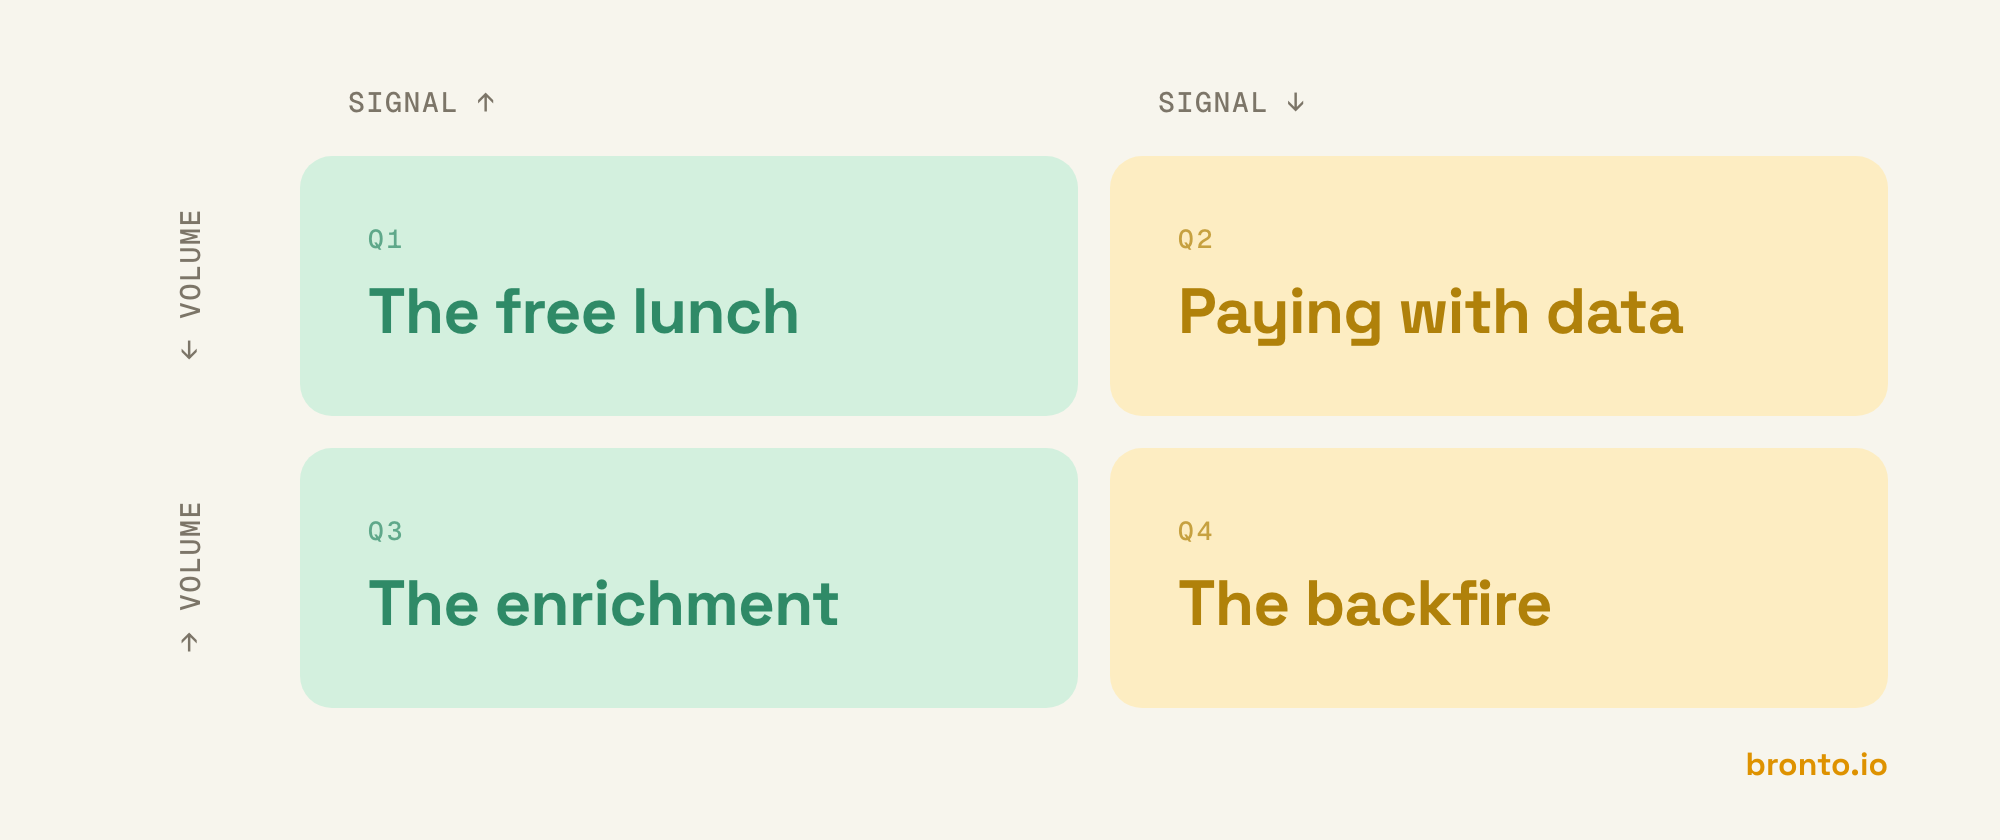
Let me walk through each one.
Q1: The Free Lunch, Real But Limited
This is the noise I promised at the top, and finding it feels great.
Every tutorial on making your observability pipeline better has these prominent examples: Kubernetes liveness and readiness probes logging every few seconds, per pod, forever. A debug logger somebody enabled during an incident last quarter, and nobody turned off. The same records shipped twice because a node agent and an application-level exporter both picked them up.
Most of this can go. But be careful even here, because a health check is not the same thing as a worthless record. Probe failures and probe latency are how you find a sick node before your users do. What you want to drop is the successful ones, the ninety-nine percent that only ever confirm that nothing is happening. The filter processor will do it:
processors:
  filter/healthchecks:
    log_conditions:
      - 'IsMatch(log.attributes["http.route"], "^/(healthz|readyz)$") and log.attributes["http.response.status_code"] == 200'
This assumes http.route has been promoted onto the log record; it is a span attribute by default, so on the trace side the equivalent lives under trace_conditions, with a span. prefix instead of log..
That status code check is the difference between Q1 and Q2. Without it, you have removed probe observability rather than probe noise, and you will find that out the next time readiness starts flapping and nothing in the logs can tell you when it began.
With it, volume goes down, and signal is untouched, or arguably goes up, because you are no longer scrolling past successful probe traffic to find a real request. Sounds like a good deal, right? This is the quadrant everybody is imagining when they say "most of it is noise anyway."
The same trade is available on the retry storm that repeats one stack trace ten thousand times in an hour. The logdedup processor collapses each ten-second window into one record carrying the count, so the storm stops drowning the query you are running, and you can still see how big it was. Finding the rest of this kind of waste means clustering records by shape and looking at what dominates, which is a different class of tool than a filter, and it is the part most volume-reduction programs skip.
The challenge is that this quadrant is finite. In my experience, it is somewhere in the range of 10-20%, depending on how neglected the pipeline has been. If your mandate was 30%, you exhaust Q1 in the first week, and then you keep going, because the mandate does not stop when the free lunch does.
Q2: Paying With Data Instead of Money
So the free lunch got you 15%, the middle of that range, and the mandate was 30%, so the next 15% has to come out of data that somebody might actually need. Which is a good moment to read the mandate again, because almost nobody means it literally. "We need to reduce our telemetry volume by thirty percent" is very rarely a statement about telemetry. It is a statement about an invoice. Does anybody in that meeting actually want fewer log lines? They want a smaller number at the bottom of a bill. Volume is simply the variable their contract happens to be calculated on.
The distinction matters because volume reduction and reducing your bill have different solution spaces. Reducing volume by 30% has one family of answers, and every one of them involves deleting something. Reducing observability spend by 30%, has a different set of options, several, and deleting your data is the one with the worst terms.
A logging config goes from INFO to WARN and ships with the next release. Retention drops from thirty days to seven. Traces get sampled at 5%:
processors:
  probabilistic_sampler:
    sampling_percentage: 5
None of these options is free. Each one of them is defensible in isolation, and what makes them defensible is that they have a big impact. INFO is most of your log volume, seven days covers most incidents, and 5% is a perfectly good sample if all you want is a latency distribution.
You end up paying the bill twice, but only one of the payments shows up on the invoice. You are also settling the bill in a second currency: answers you will not have, because you didn’t store the data needed for them. Nobody counts that. Nothing fails and nothing alerts, because a trace that was never recorded does not raise anything. When a customer sends an order ID on Thursday, and the trace behind it was one of the ninety-five per cent, the investigation stalls; somebody says we do not have that, and nobody goes back to look at the config change from earlier in the year that caused it to be dropped.
My position is that most of this work should not exist. The engineering is fine! The sampler is correct, the retention change is correct, and both do exactly what they say on the tin. It is just that the whole exercise is effort spent making a bad unit price easier to swallow. It's like an old fridge: defrost it, keep the door shut, put less in it, and yes, your bill really does go down every month. Somebody should still go and look at what a new fridge costs.
Q3: The Enrichment Nobody Gets To
There is a second way to improve signal-to-noise: instead of removing noise, you add signal. You make the data you are already paying for be more useful.
Attaching Kubernetes and cloud metadata with the k8sattributes processor, so a log line knows which namespace, deployment, node, and pod produced it. Parsing an unstructured message body into named, queryable fields with OTTL. Making sure trace context actually propagates across the boundary where it currently drops, so your logs and traces can be correlated instead of merely coexisting. Carrying code.file.path and code.line.number on the records that warrant it, so a log line points at the statement that emitted it instead of leaving you to grep the repository for the format string.
processors:
  k8sattributes:
    extract:
      metadata:
        - k8s.namespace.name
        - k8s.deployment.name
        - k8s.pod.name
        - k8s.node.name
  transform/parse_access_log:
    log_statements:
      - context: log
        statements:
          - merge_maps(attributes, ExtractPatterns(body, "^(?P<method>\\w+) (?P<path>\\S+) (?P<status>\\d{3}) (?P<duration_ms>\\d+)$"), "insert")
These changes make your telemetry substantially more valuable, but they also increase volume.
But most of that is cheaper than you would guess. The Kubernetes metadata are resource attributes, written once per batch in OTLP and shared by every record from the same pod, so at the collector's egress they cost a fraction of a byte per record. The parsing is the real exception: you keep the original body alongside the extracted fields, so the record roughly doubles, and no amount of batching recovers that.
A bytes-per-day chart shows you none of that. The enrichment that costs almost nothing and the one that doubles every record show up the same way: the budget line went up.
So the work never really gets argued about. Nobody is blocking k8sattributes – it ships enabled in half the Helm charts you might install – and most teams already intend to do all of the above. They just do not do it now, because a volume program has a number in it, and programs with numbers in them end when the number is hit. Q1 gets you fifteen percent, Q2 grinds out the rest, somebody screenshots the graph for the quarterly review, and the work is closed. There is no step after "we reduced it by 30%," because reducing it by 30% was the entire brief.
Whether your observability spend is value for money is unanswerable while the telemetry is unusable. You can't defend a bill for data nobody can query, and you can't really attack it either, so the argument settles on price – the only number anybody in the room actually has. Enriched telemetry gets used, and usage is evidence. Most of what produces it is unglamorous work: consistent structure, correlation IDs that survive a hop, log levels that mean the same thing across services. But a team that can name the investigations that resolved faster this quarter, and the correlation that did it, walks into the budget meeting with something to say.
Q4: The Change You Were Sure About
The framework logs the request. Then the middleware logs it, because the framework's version does not carry the tenant. Then the application logs it a third time with slightly different wording, because by that point nobody trusts the other two. Three records, one event, and no reliable way to say which is authoritative. Every one of those lines was added by somebody trying to improve matters, and each has a different team behind it.
That is what Q4 actually is, and why I think of it as the backfire. It is not really the stuff that piles up while nobody is looking; that was the double-shipping back in Q1, where either copy is safe to delete because they are identical. These three records differ from one another, and none of them goes without a conversation. Logging whole request and response bodies for completeness is the same story: you add a great deal of data, and the four fields anybody queries end up inside a blob that nothing has parsed.
The same thing happens with a processor from the previous section. Take the k8sattributes block from Q3, change nothing about it, and point it at a different pipeline:
service:
  pipelines:
    metrics:
      processors: [k8sattributes]
On logs, that was enrichment. On metrics, as soon as the backend treats resource identity as series identity, it is a separate series for every pod – and a fresh set of them after every deploy, because pod names churn. That is how a well-meaning label addition takes out a Prometheus. The config did not change, and neither did the intention behind it.
Underneath all three is an assumption that more data is the same thing as more signal, and that if the answer is not in there yet then adding should get you closer. It is the same mistake the volume mandate makes, pointed the other way, and I have watched one team make both inside about two years.
The awkward thing is that Q3 and Q4 are not separable at the time, and not only on the chart. From the inside, they are the same act: somebody adds something to a pipeline because they are fairly confident it will help. The engineer putting a pod name on a metric is doing what the engineer putting it on a log did. One of them is right. Review will not catch it either, because the reviewer is working from the same information and the same instinct. You need something that checks whether a question actually got easier to answer.
What to Govern Instead
Put the four quadrants back together, and the problem shows up in one line. Q1 and Q2 both report as a reduction in volume, so dropping probe traffic and dropping the log lines that explain a failure show up in the quarterly review as the same green arrow. Q3 and Q4 both report as volume up, so the enrichment that made an incident tractable and the label that took out your metrics backend are reported as the same red arrow. A bytes-per-day number cannot separate any of that, but it is the number the entire program is steered by.
None of which is an argument against governing telemetry. It grows without limit if nobody is watching, somebody has to own the bill, and a team that has never questioned its telemetry costs is not being principled, is just not looking. The argument is about which variable should be on the dashboard.
The goal is to try and measure signal, and it is less work than it sounds. Take the ten questions your team actually asks during an incident. Can I segment this failure by tenant? Can I get from this alert to the trace that caused it? Can I tell which deployment introduced it? Write each one as a literal query, in a file, checked into the repository that holds your collector config, and run them in CI against a replay of real telemetry, once with the proposed change and once without. If any answer moves, the build fails. Not just if it comes back empty: sampling does not empty a result; it quietly changes it.
That is the difference between Q3 and Q4 made mechanical. The engineer adding pod name to a metric finds out in the pull request instead of during the next incident. It works in reverse too, which is the part that matters for Q3: adding a question and watching it fail is how you justify an enrichment to somebody whose only other number is bytes per day. And if you would rather start with something off the shelf, the Instrumentation Score is an open specification for grading OTLP against semantic conventions and instrumentation best practice, which is a different cut at the same question. Either way: your observability pipeline is probably the only production system you own with no tests on it, and there is no particular reason for that.
Changing the Constraints
I want to end somewhere slightly uncomfortable, because I do not think this is really a discipline problem or an education problem. Which quadrants you can operate in is dictated by your observability platform's cost model, not by your engineers.
If ingest cost scales linearly with bytes, and retention is tiered so that older data becomes slow or expensive or both, then the economics have already made your architectural decisions. Q3 is priced out of existence. Q2 becomes not just permitted but mandatory, because it is the only lever that moves the number anybody is measured on. Your telemetry strategy is a downstream consequence of a pricing page.
Teams under that constraint are not making bad choices. They are making the only choices available, and then rationalizing them as noise reduction, because "we improved our signal-to-noise ratio" is a much better sentence than "we deleted data we may need."
The interesting question is what changes when volume stops being the binding constraint. When enriching a log record does not require a budget conversation, the matrix opens up. You can attack Q4 aggressively and invest in Q3, which is the combination that actually improves the ratio.
Until then, at minimum, name the quadrant. When somebody proposes a pipeline change, ask which of the four it is. It is a five-second question, and I have not yet seen it fail to change the conversation.
Comments