Telemetry With Scala, Part 1: OpenTelemetry
This blog post is the first of a series of articles aimed to show a landscape of metrics and telemetry solutions possible to use in different Scala ecosystems.
Join the DZone community and get the full member experience.
Join For FreeThis blog post is the first of a series of articles aimed to show a landscape of metrics and telemetry solutions possible to use in different Scala ecosystems, including some examples of APM solutions. I possibly won't cover all possible solutions or a combination of those but will try to cover the main one.
Please, NOTE: this series is not going to compare telemetry as whole products between each other; instead, it focuses on how to use each telemetry framework in different Scala ecosystem and perhaps highlight some pitfalls from this perspective only.
Since this is quite a large topic to discuss, just a small portion of code samples are present here. Please, see this repository for complete results.
As the title says, in this particular post, we will focus on OpenTelemetry framework.
Concepts
But before moving forward, it's worth mentioning that monitoring or telemetry is a pretty wide technical topic. Of course, I won't be able to cover it all. But, to be on the same page, first, let's introduce a shortlist of the main concepts I'm going to refer to. Definitions could differ from source to source, so I try to give some average notions:
- Metrics — abstract signals sent from service, resource, etc.
- Spans — data about single logical unit execution. For instance: timings about service method execution.
- Trace — data about single logical transaction execution. For instance: handling HTTP requests.
- Instrumentation — any tools or libraries which understand specifics of certain service stacks of technologies they run inside and can scrap valuable metrics or spans.
- Agent — service collecting or scrapping data from target services or resources.
- APM (application performance monitoring) — complex software solution capable to store, visualize, alert about, etc., received metrics. For example, Splunk, NewRelic, etc.
Overall, when we're talking about any telemetry solution, we usually mean building a complex solution consisting of certain instrumentation, agent/storage, and visualization/APM solution. Schematically it showed in the picture below: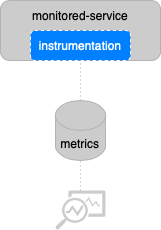
Ecosystems
The following ecosystems are going to be considered in the series:
- Lightbend — mostly known for
akkaand surrounding projects, such asakka-http,akka-streamsetc.; - Typelevel — ecosystem build on top of
cats-effectlibrary, such asfs2,doobie,http4setc.
Looking ahead, this and the next post are focused on the Lightbend stack, and the third will describe monitoring in the Typelevel stack.
System Under Monitoring
To compare how to plug and use certain telemetry solutions for end service, let's consider a single example service: a task ticketing system similar to well-known Jira or Asana. The domain model is pretty simple — there is Ticket represents a single task, Project which contains multiple tickets. This system, at a high level, consists of microservices responsible for projects management (projects-service), tickets management (tickets-service) and tickets change notifications, e.g., emails (notification-service). Since there is plenty of stuff to monitor, let's keep our focus on tickets-service only. The projects-service is stubbed in our case and provides API just to fetch the project by its id. The notification-service shown as theoretical services.
For the sake of example, the task tickets system is much simplified compared to the real-world production system and does not include things like auth, caching, load balancing, etc. Along with that, the technical stack has been chosen to be more or less diverse to simulate a real production system to some extent; hence certain architectural decisions might not look perfect.
The task ticketing system which we are going to monitor looks the following at a high level:
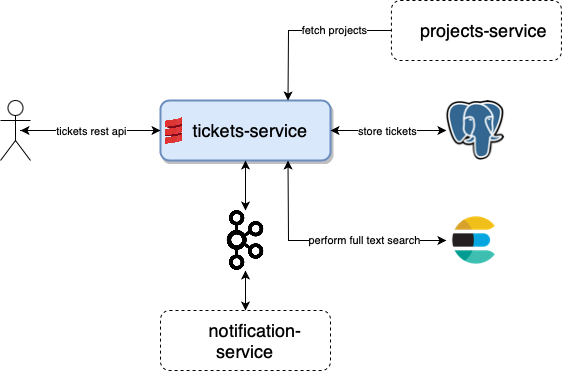
tickets-service— micro-service for tasks tickets, also provides full-text search capabilities, publishes a change to Kafka topic.notification-service— micro-service for user subscriptions, send emails for subscribed tickets. Just show Kafka intention, is not present in the implementation.projects-service— micro-service for projects, which tickets are leave-in. Stubbed with static data.
Please, note: implementation of the exact service depends on the stack we consider, but the overall architecture remains the same for the entire series.
tickets-service API
The example ticket model is following:
{
  "id": 1,
  "project": 2,
  "title": "ticket title",
  "description": "ticket title",
  "createdAt": 1644560213,
  "createdBy": "[email protected]",
  "modifiedAt": 1644560213,
  "modifiedBy": "[email protected]"
tickets-service exposes following API endpoints.POST /v1/tickets — create a single ticket:
- Request project by
projectid field fromprojects-serviceto verify project exists; - Insert a record into Postgre
ticketstable; - Index ticket document into
ticketsElasticsearch index; - Send a message to Kafka
ticketstopic identifying ticket created event;
GET /v1/tickets?search={search-query}&project={project-id} — performs a full-text search over all tickets:
- Search tickets by
titleanddescriptionin Elasticsearch; - Fetches full ticket records from Postgre
ticketstable by foundid's from Elasticsearch;
PUT /v1/tickets — update single ticket:
- Update a record in Postgre
ticketstable. - Index ticket document into
ticketsElasticsearch index; - Send a message to Kafka
ticketstopic identifying ticket updated event;
DELETE /v1/tickets/:id — delete single ticket:
- Delete ticket by id from both Postgre and Elasticsearch;
Things to Monitor
Moving to data, we would like to get from our telemetry:
- HTTP requests spans — timings and details about each request handling. Ideally, to get traces about how much time the application spends in.
- Tickets count — custom metric showing the number of existing tickets.
Simulating User Traffic
To get some data for any telemetry from ticket-service we need to send some requests. I decided to use Gatling for this. Although this is a rather load and performance testing tool, let's omit the testing aspect and use it just to simulate user traffic. The following scenario for a single user is used to put some load on service:
- Create 20 tickets for 10 different projects via
POST /v1/ticketsendpoint; - Search tickets for 10 different projects via
GET /v1/tickets?search={search-query}&project={project-id}endpoint; - Update 20 tickets via
PUT /v1/ticketsendpoint; - Delete 30 tickets via
DELETE /v1/tickets/:idendpoint;
And this scenario is used for simulating the activity of 100 concurrent users.
Implementation Details
The following libraries and frameworks were used to implement tickets-service in Lightbend ecosystem:
akka-http— for HTTP server and client;slick— for database access layer, along with Postgre JDBC driver;elastic4s— not really a library supported by Lightbend, but it provides convenient Scala API, abstracted over underlying effect, hence can be used withFuture, which is our case.kafka— plain Java client to write records totickets.
OpenTelemetry
Instrumentation
OpenTelemetry is, as the documentation says:
OpenTelemetry is a set of APIs, SDKs, tooling and integrations that are designed for the creation and management of telemetry data such as traces, metrics, and logs.
As you may see, nothing is Scala specific, and so far, it has no dedicated support for a variety of Scala libraries, but luckily it provides a number of JVM instrumentation. In particular for ticket-service case, we are interested in the following instrumentation: "Akka HTTP," "JDBC," "Elasticsearch Client," and "Kafka Producer/Consumer API."
Despite the fact that the list of available instrumentations is pretty long, I strongly encourage you to check if it fits your particular needs.
Export
OpenTelemetry is designed in a way that instrumentation is abstracted over a backend it exposes metrics to. Such an approach allows for supporting a variety of exporters, both pull and push-based. See the Data Collection page for more details. We will consider the following exporters in examples: Prometheus, Zipkin, and OTPL.
Talking about APM solutions, there are many services natively supporting OpenTelemetry, such as Splunk, Datalog, etc.
Automatic Instrumentation
OpenTelemetry provides an easy way to plug automatic instrumentation Taking into account sbt specifics, it is possible to implement the following approach.
First, add OpenTelemetry dependencies to the project:
lazy val openTelemetrySpecific = {
  val version = "1.11.0"
  val alphaVersion =  s"$version-alpha"
  Seq(
    "io.opentelemetry" % "opentelemetry-bom" % version pomOnly(),
    "io.opentelemetry" % "opentelemetry-api" % version,
    "io.opentelemetry" % "opentelemetry-sdk" % version,
    "io.opentelemetry" % "opentelemetry-exporter-jaeger" % version,
    "io.opentelemetry" % "opentelemetry-sdk-extension-autoconfigure" % alphaVersion,
    "io.opentelemetry" % "opentelemetry-exporter-prometheus" % alphaVersion,
    "io.opentelemetry" % "opentelemetry-exporter-zipkin" % version,
    "io.opentelemetry" % "opentelemetry-exporter-jaeger" % version,
    "io.opentelemetry" % "opentelemetry-exporter-otlp" % version,

    "io.opentelemetry.javaagent" % "opentelemetry-javaagent" % version % "runtime"
  )
}
Use sbt-javaagent plugin to run app with javaagent parameter. Add to plugin.sbt:
addSbtPlugin("com.lightbend.sbt" % "sbt-javaagent" % "0.1.6")And add the following code for project settings:
libraryDependencies += openTelemetrySpecific
javaAgents += "io.opentelemetry.javaagent" % "opentelemetry-javaagent" % "1.11.0"
Agent configuration can be supplied through environment variables or with Java options (e.g. -D argument). Automatic tracing covers "HTTP requests spans" monitoring requirements.
Metrics
Apart from automatic tracing, with OpenTelemetry, it is possible to expose custom metrics. Please, pay attention to that:
Note The stability of Metrics in opentelemetry-java is mixed. The first stable metrics API was release in version 1.10.0; however, the metrics SDK is alpha and still subject to change
As was said above: we want to track the total number of tickets. First, let's instantiate a counter for tickets:
/*
 * `GlobalOpenTelemetry` singleton configured by OpenTelemetry Java agent, based environment variables or Java options
 */
import io.opentelemetry.api.metrics.{LongCounter, Meter}
import io.opentelemetry.api.{GlobalOpenTelemetry, OpenTelemetry}

lazy val sdk: OpenTelemetry = GlobalOpenTelemetry.get()
lazy val ticketsMeter: Meter = sdk.meterBuilder("tickets-service").build()
lazy val ticketsCounter: LongCounter = ticketsMeter
  .counterBuilder("tickets_count")
  .setDescription("Total number of tickets")
  .setUnit("1")
Great, now we can utilize ticketsCounter to track the number of tickets, for instance, by increasing:
ticketsCounter.add(1)Now we have plugged instrumentation and custom metrics for ticket-service. The full-service implementation you can find by this link.
Metrics Example: Prometheus
Since OpenTelemetry supports integration with Prometheus for metrics exporting, we can use it to monitor tickets_count. Let's start the local Prometheus instance using docker-compose (partial example):
prometheus:
  image: prom/prometheus:v2.33.3
  container_name: prometheus
  restart: always
  ports:
Set necessary environment variables for ticket-service for Prometheus exporter (see, link for more details)
OTEL_SERVICE_NAME=tickets_service
OTEL_METRICS_EXPORTER=prometheus
OTEL_EXPORTER_PROMETHEUS_PORT=9094
OTEL_EXPORTER_PROMETHEUS_HOST=0.0.0.0
Don't forget to expose 9094 port for tickets-service for the Prometheus agent to scrap metrics.
Let's start the whole setup and run Gatling tests after. On Prometheus UI at localhost:9090 we can find tickets_count metric:
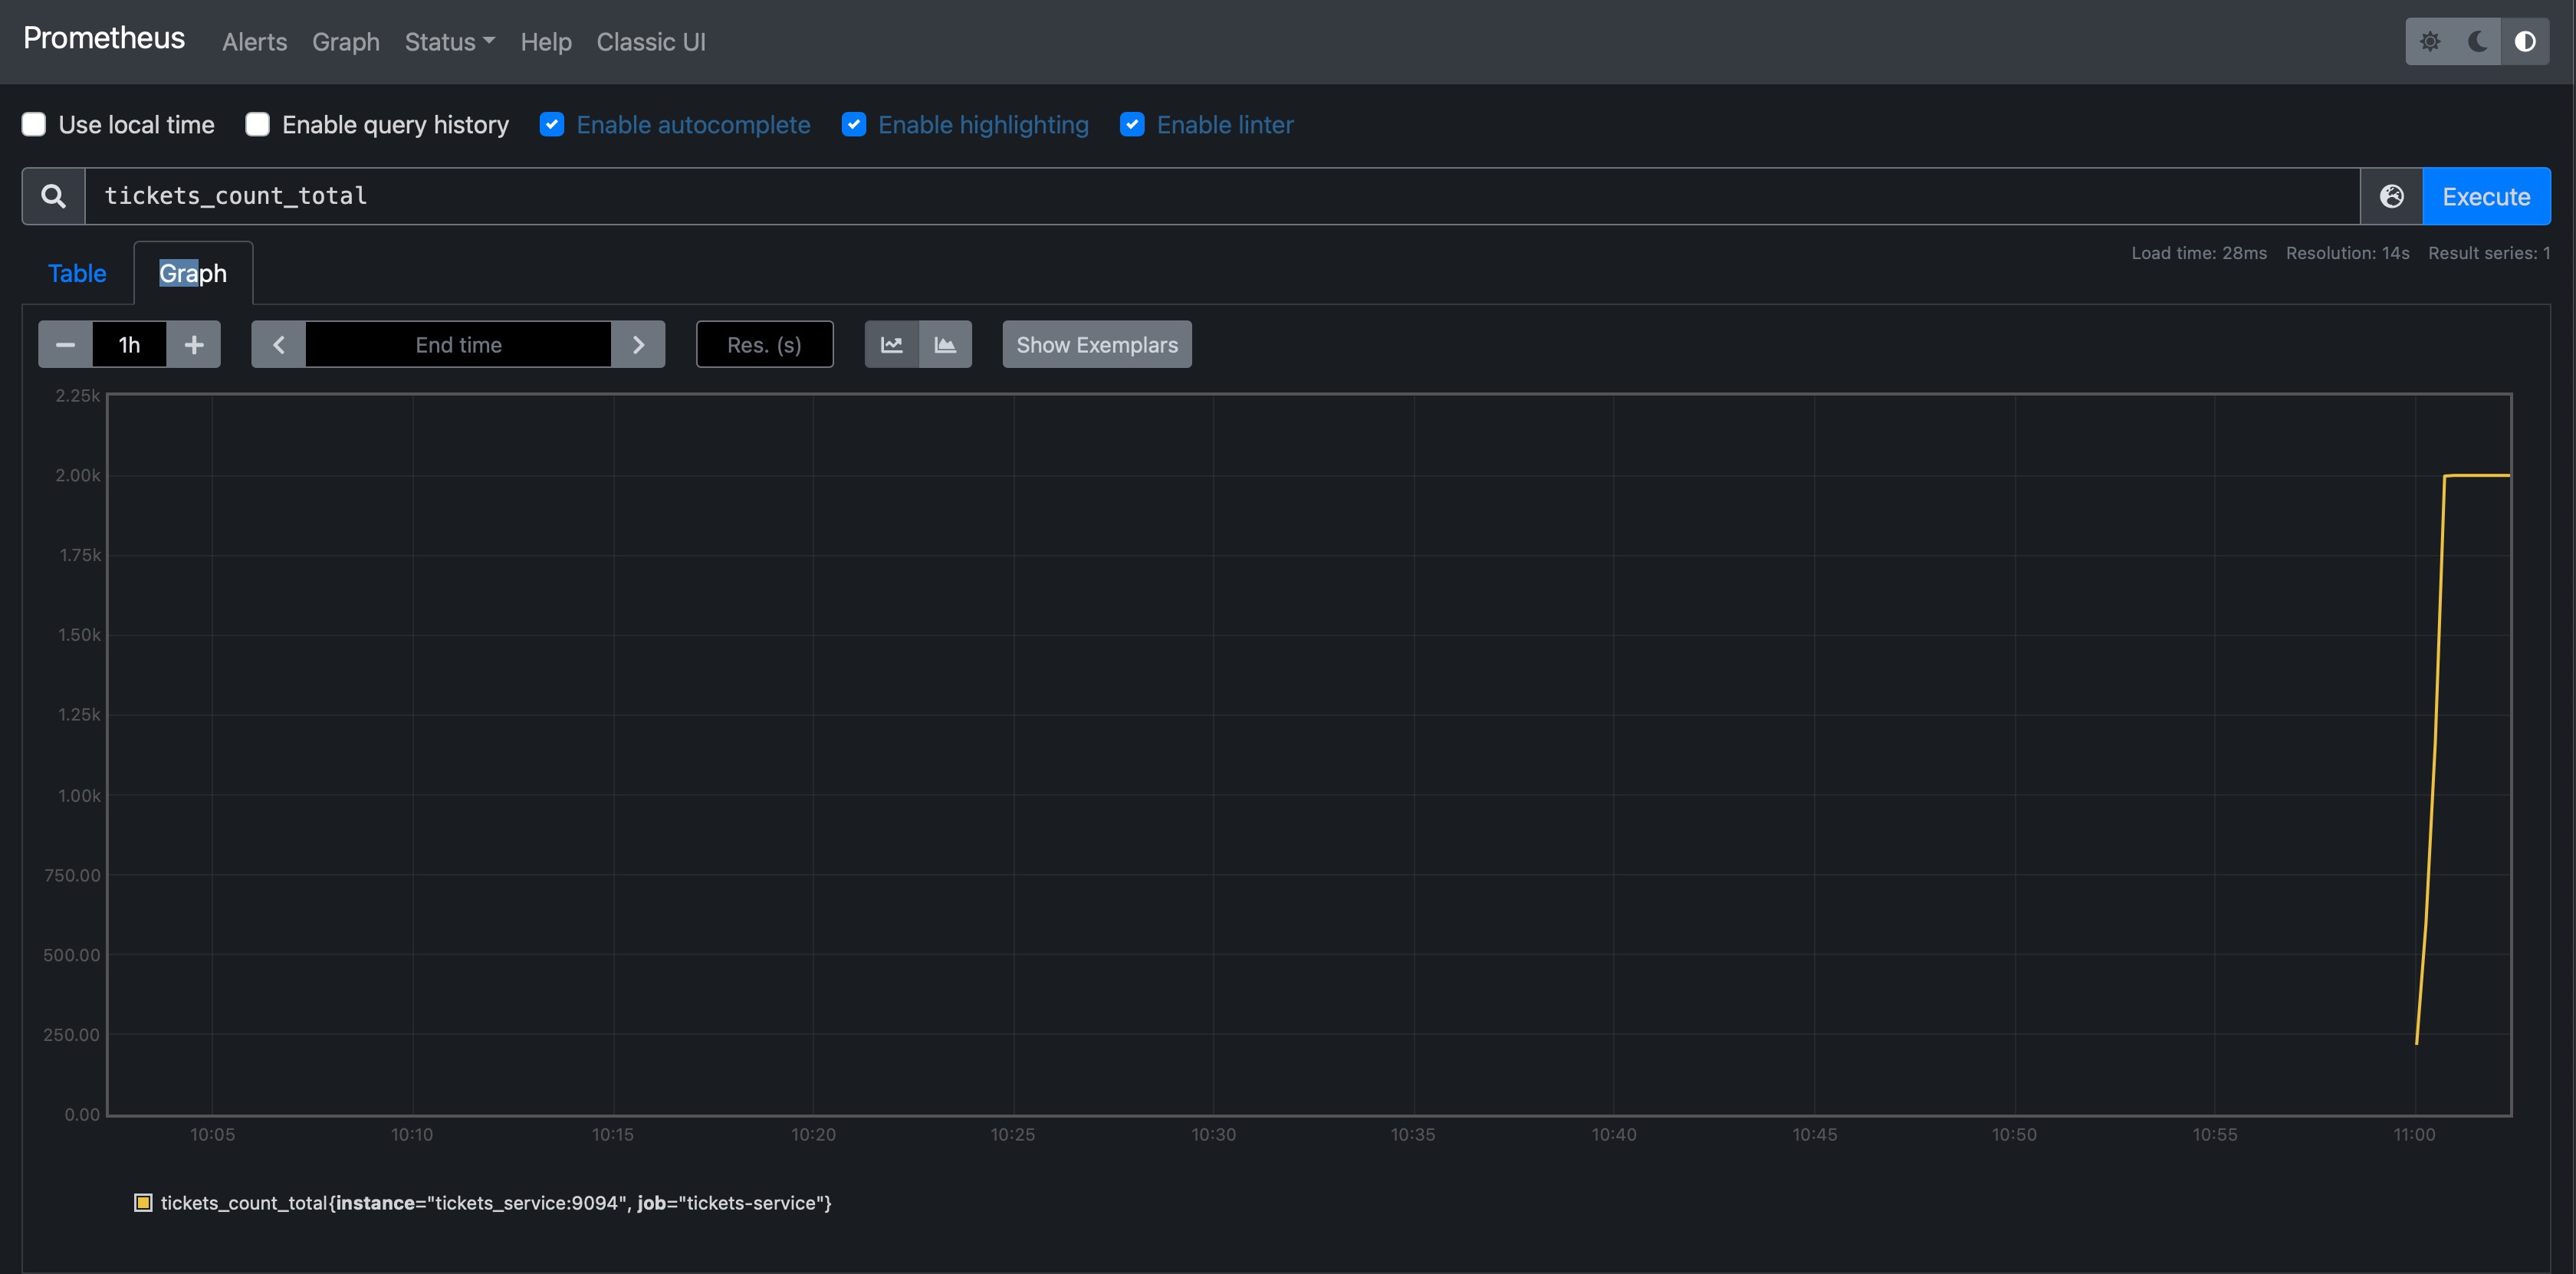
Full docker-compose you can find by this link.
Tracing Example: Zipkin
As it was mentioned earlier, OpenTelemetry supports exporters for Zipkin, but this time for spans only. To send some span's data, let's start a local Zipkin instance using the following: docker-compose:
zipkin:
    image: openzipkin/zipkin:2
    hostname: zipkin
    restart: always
    networks:
      - tickets
    ports:
      - "9411:9411"
Then set the necessary environment variables for ticket-service for Zipkin exporter (see link for more details)
OTEL_SERVICE_NAME=tickets_service
OTEL_TRACES_EXPORTER=zipkin
OTEL_EXPORTER_ZIPKIN_ENDPOINT=http://zipkin:9411/api/v2/spans # Replace `zipkin:9411` with your host and port.
Let's start the whole setup and run Gatling tests after. On Zipkin UI at localhost:9411 we can find some tickets_service traces:
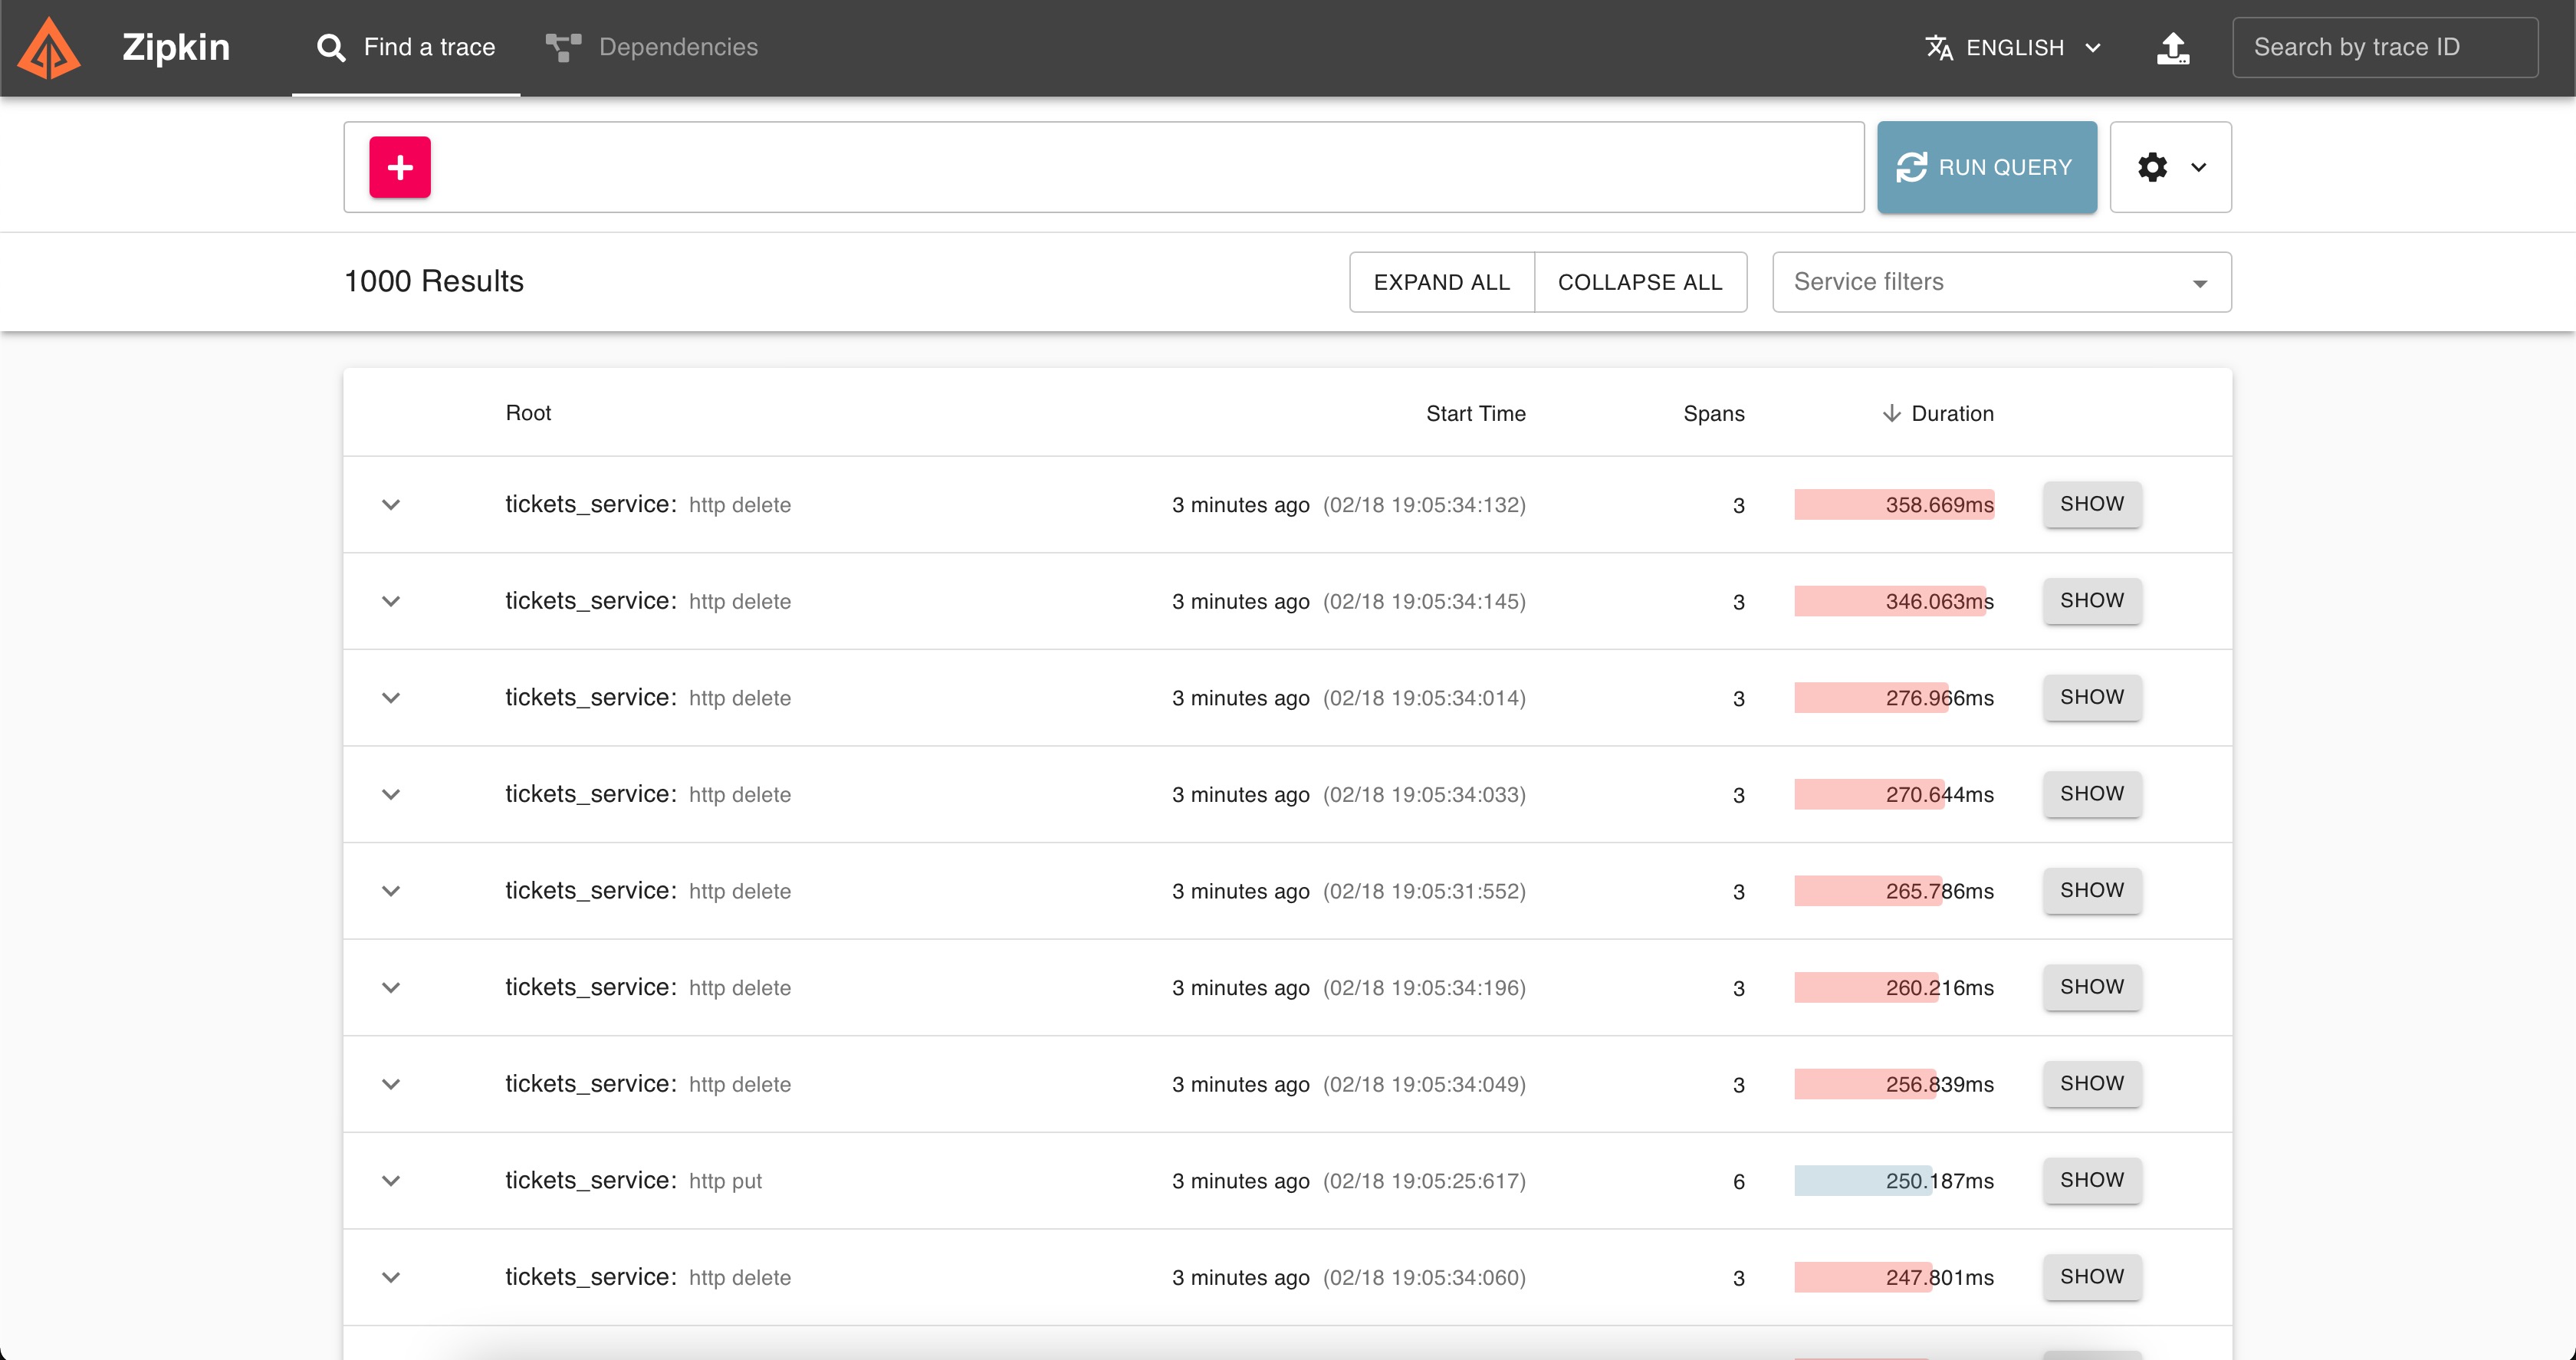
If we open some example request, for instance DELETE /tickets/:id, not many details could be found:
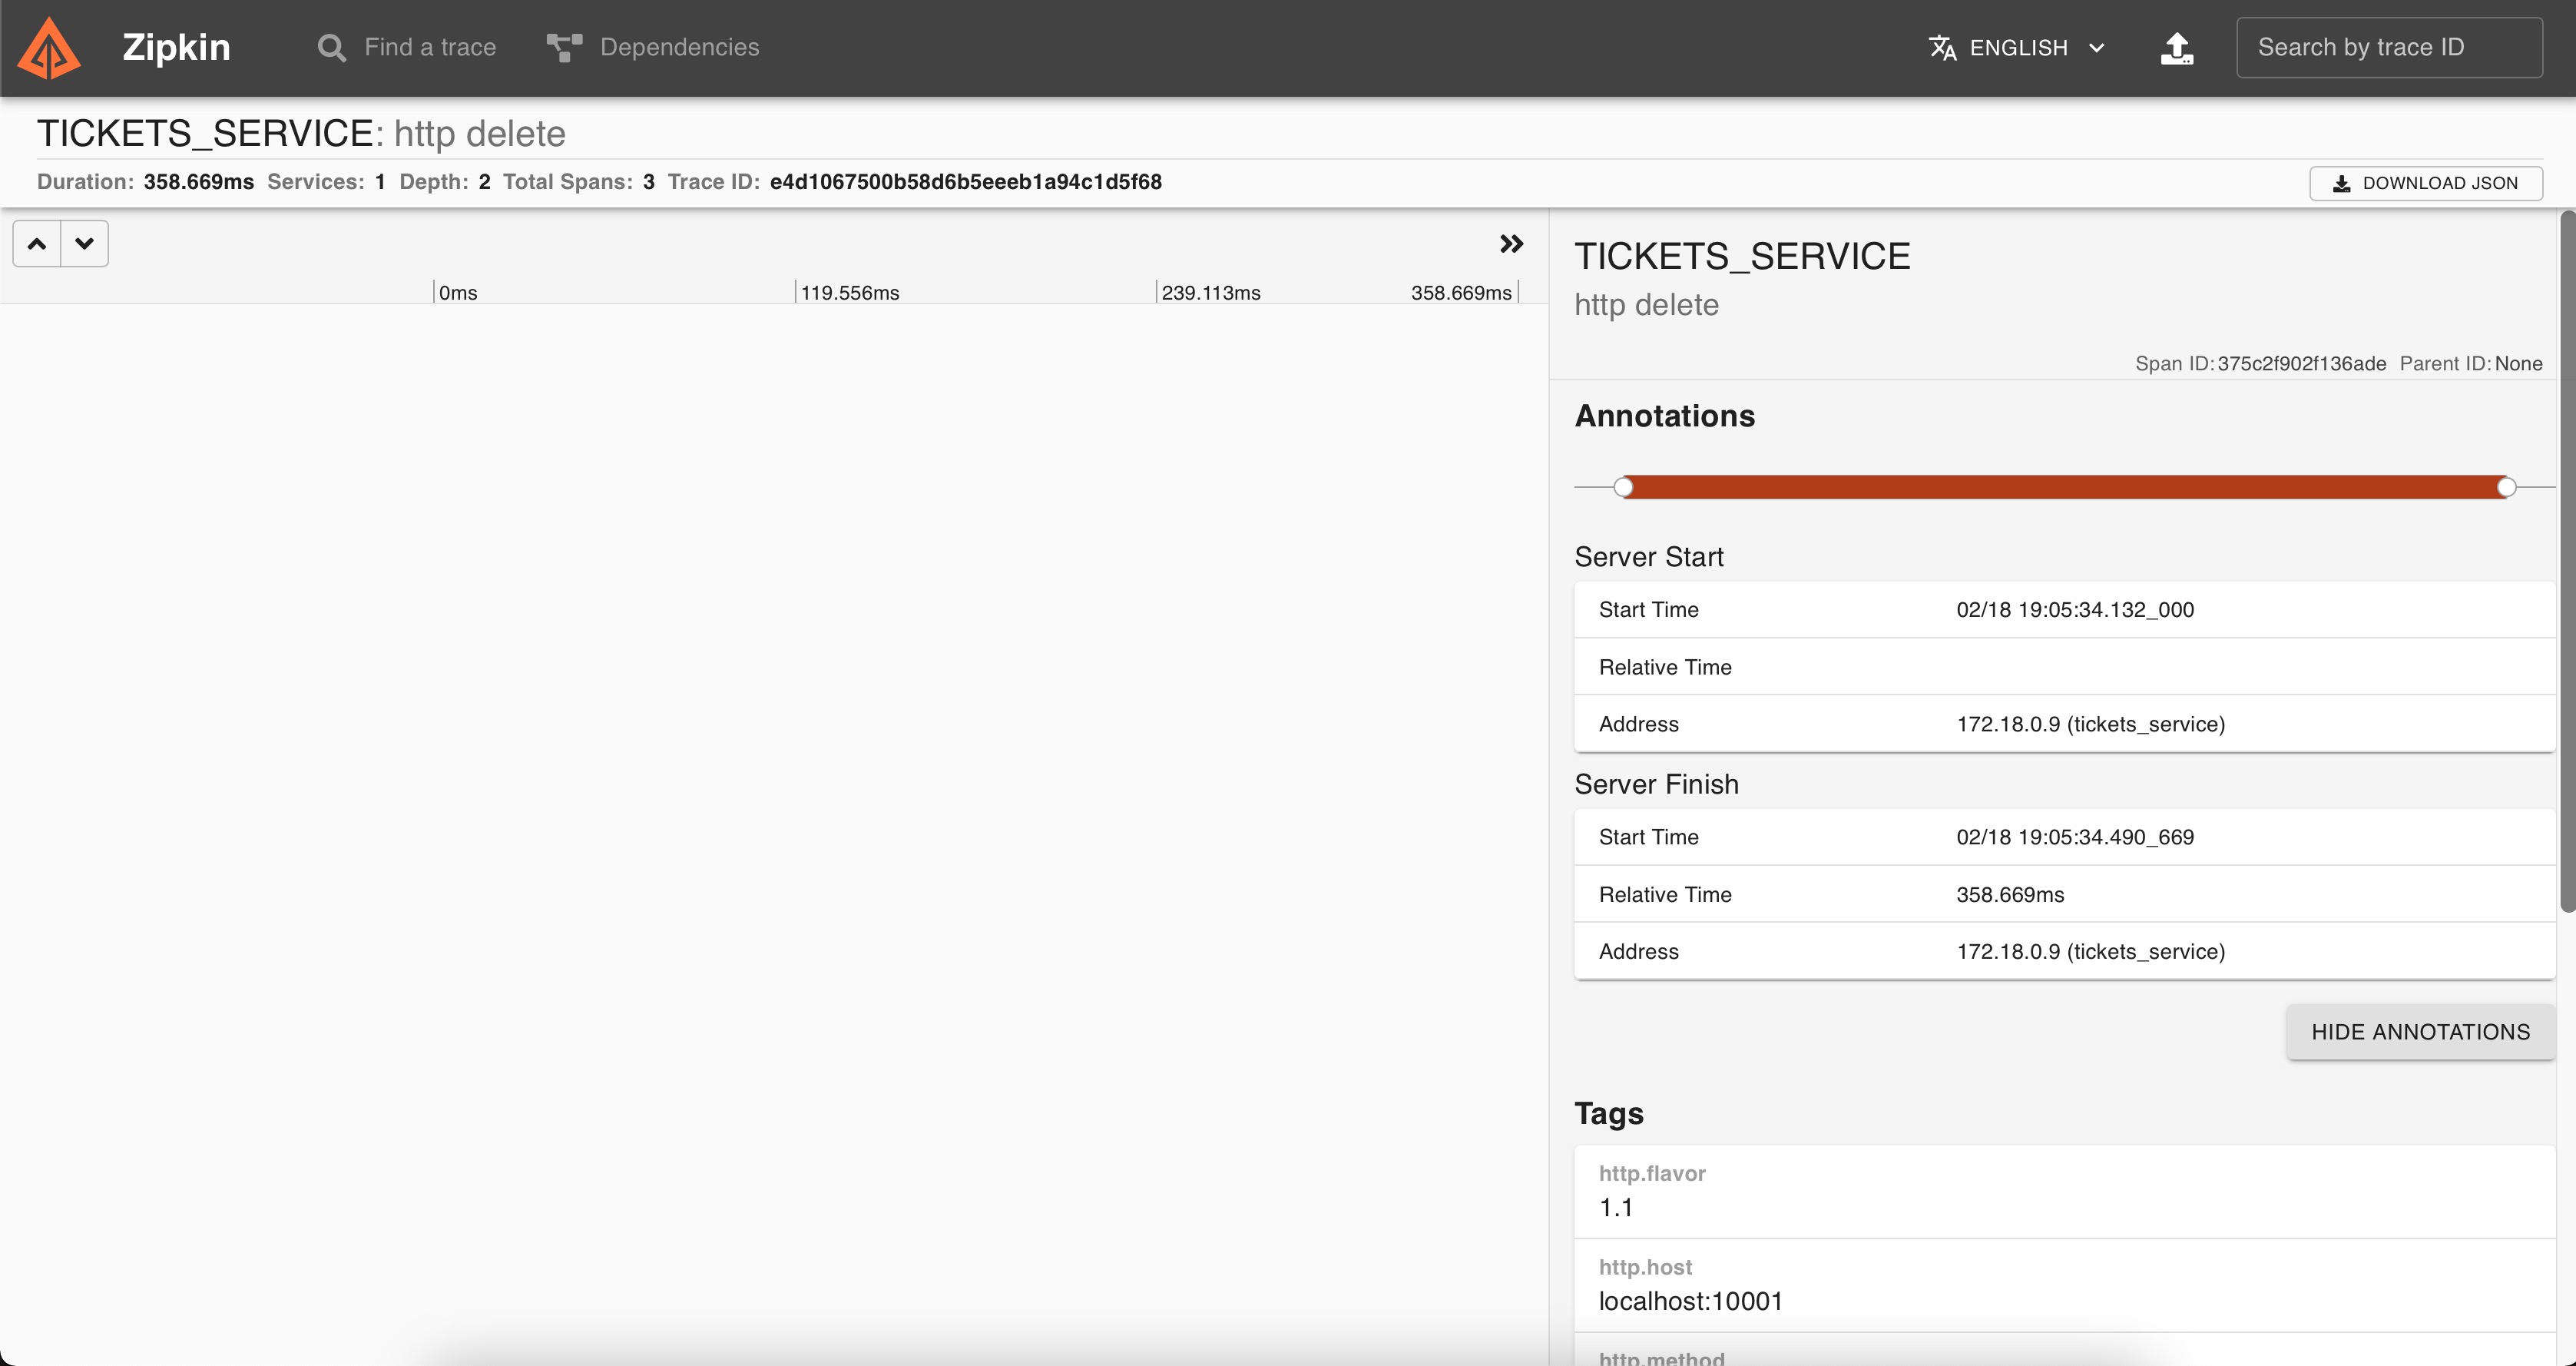
Full docker-compose you can find by this link.
APM Example: Datadog
Within complex APM solutions like Datadog, it is possible to combine and monitor both metrics and spans in a single place. OpenTelemetry offers its own protocol called OTLP, which main advantage is it supports simultaneous export for metrics, spans, and logs (not covered here). OTLP is a push-based protocol, meaning the application must send data to a collector.
In the case of Datadog APM, our application won't send data directly to the Datadog site or API. Instead, what we need is to set up and configure the collector. See the documentation for more details. Let's start with collector configuration:
# Enables OTPL receiver
receivers:
  otlp:
    # Enable OTPL receiver thought both gRPC and HTTP protocol.
    protocols:
      grpc:
      http:

processors:
  batch:
    timeout: 10s

# Configure export of metrics and traces to Datadog
exporters:
  datadog/api:
    # Enrich incoming data with additional metadata.
    env: local
    service: tickets-service
    version: latest

    # Replace `DATADOG-API-KEY` and `DATADOG-API-SITE` (e.g. datadoghq.eu) with your own values
    api:
      key: {DATADOG-API-KEY}
      site: {DATADOG-API-SITE}

service:
  pipelines:
    # Enable receiving traces or spans data from application though OTPL protocol and export it to Datadog
    traces:
      receivers: [otlp]
      processors: [batch]
      exporters: [datadog/api]

    # Enable receiving metrics data from application though OTPL protocol and export it to Datadog
    metrics:
      receivers: [ otlp ]
      processors: [ batch]
Great, now we can use this configuration to either extend collector base Docker image and build our own:
FROM otel/opentelemetry-collector-contrib:0.45.0Please, NOTE: there are two similar base Docker images for OpenTelemetry collectors:
- opentelemetry-collector — OpenTelemetry Collector core distribution.
- opentelemetry-collector-contrib — OpenTelemetry Collector customizations, which are not a part of the core distribution. And we need exactly this one.
After, our customized collector can be used, for example, in docker-compose:
  opentelemetry-collector-contrib:
    build: docker-opentelemetry-collector-contrib # Folder with Dockerfile and configuration
    container_name: opentelemetry-collector-contrib
    hostname: opentelemetry-collector-contrib
    restart: always
    command: ["--config=/etc/otel-collector-config.yaml"] # Specify path to configuration
    networks:
      - tickets
    ports:
      - "4317:4317"
The collector part is ready. Now we need to configure application instrumentation. For this, specify necessary environment variables for ticket-service for OTLP exporter (see, link for more details)
OTEL_SERVICE_NAME=tickets_service
OTEL_TRACES_EXPORTER=otlp
OTEL_METRICS_EXPORTER=otlp
OTEL_EXPORTER_OTLP_ENDPOINT=http://opentelemetry-collector-contrib:4317
Pay attention to one detail: we need to specify both OTEL_TRACES_EXPORTER and OTEL_METRICS_EXPORTER to point to otlp exporter.
Let's start the whole setup and run Gatling tests after. First, we can check tickets_count in "Metrics" section of Datadog:
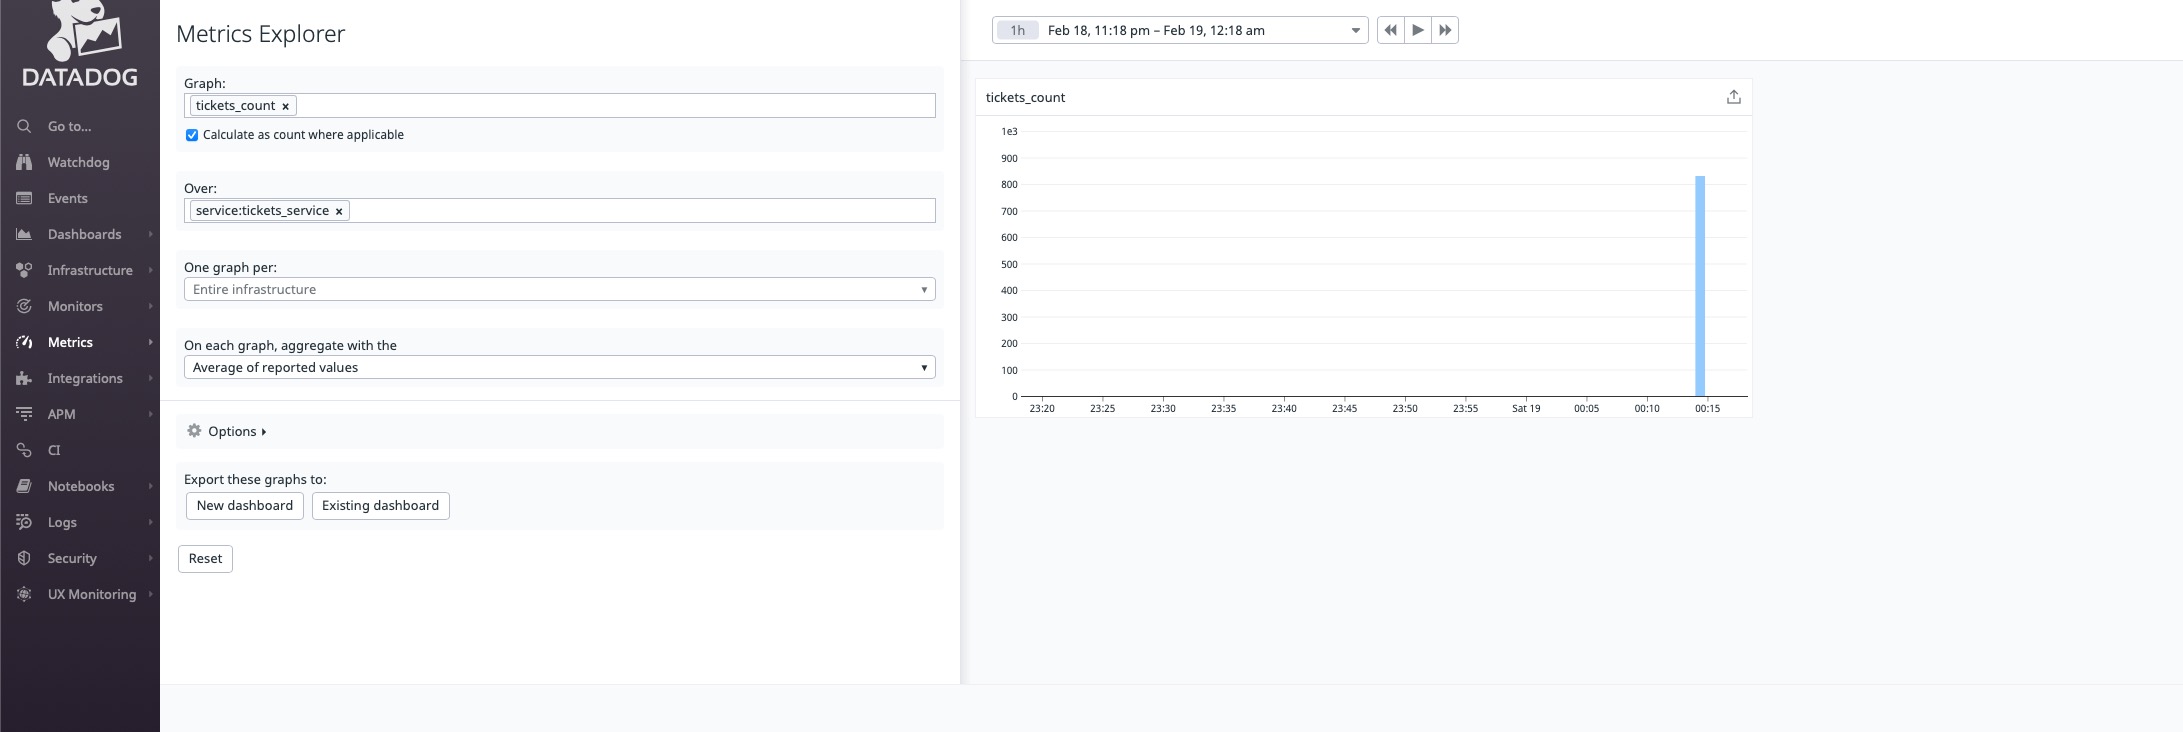
Awesome, that works. Now moving on to traces: open "APM" -> "Traces". You can find plenty of tracked spans.
We can have a closer look, for instance, at some POST /tickets endpoint invocation that is responsible for ticket creation. Choose any trace for this endpoint and open "Span List":
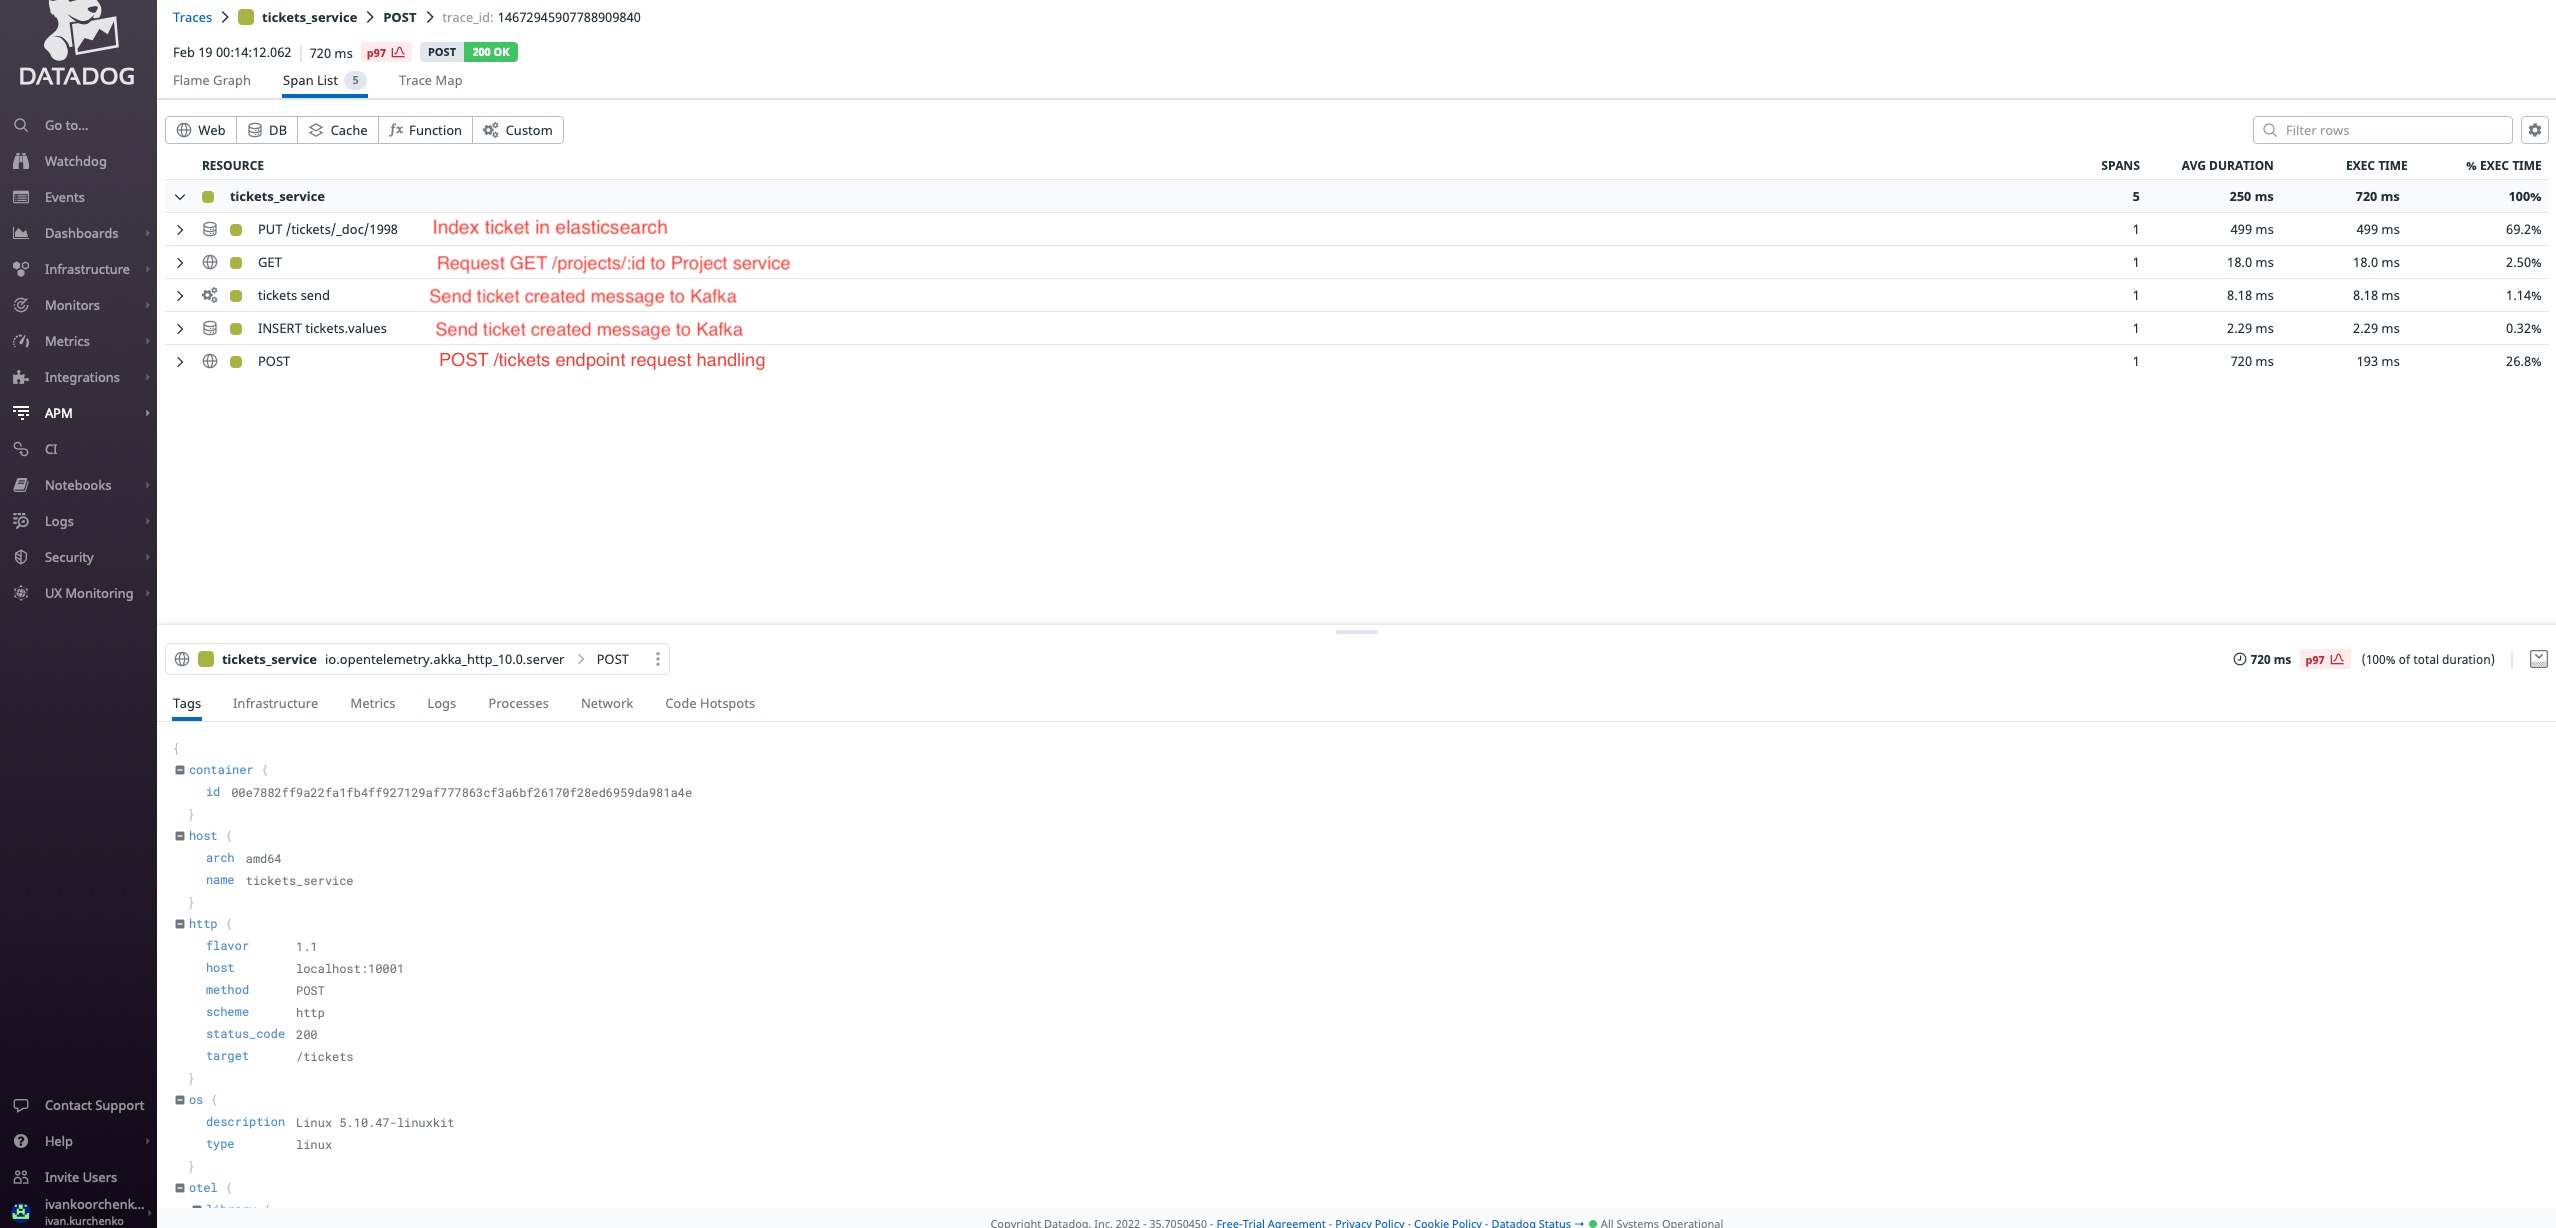
And in this list, you can observe all requests from ticket_service to other services, it does while creating a new ticket. Full docker-compose you can find by this link. Of course, this is just an example of APM usage, check opentelemetry-collector-contrib and documentation of an APM you are interested in. Highly likely it supports any of protocols supported by OpenTelemetry (such as Jaeger) or has a dedicated OpenTelemetry collector exporter.
Conclusions
In conclusion, I would like to share the list of pros and cons of using OpenTelemetry for Scala and Lightbend stack projects.
Pros:
Open, vendor-agnostic standard with wide support among free and commercial monitoring solutions. It is worth highlighting, that OpenTelemetry is not just a library designed for JVM. Its whole standard includes, but not limited to, multiple language instrumentation, a standard protocol for metrics, spans, tracing, logging data, and a variety of exporters for free and commercial backends.
Effortless to plug automatic telemetry. This is a huge benefit. With just several environment variables and java agent you can start sending telemetry data to almost any monitoring backend you need.
Cons:
- Not that many natively supported Scala libraries. For instance, Slick framework. Yes, OpenTelemetry can instrument low-level JDBC API, but in complex cases, it's better to have some more high-level data.
- Some dependencies with version
1.11.0are still inalpha. E.g.: opentelemetry-sdk-extension-autoconfigure
Last but not least, I'd like to emphasize - choose APM or build your own telemetry solution bearing in mind needs all the infrastructure you need to monitor and not only the ecosystems or the programing language of software.
In the next part of "Telemetry with Scala," we will dive into the Kamon framework, and it's usage in conjunction with Lightbend stack.
Thank you!
Published at DZone with permission of Ivan Kurchenko. See the original article here.
Opinions expressed by DZone contributors are their own.
Comments